![[Uncaptioned image]](/html/1303.1189/assets/x1.png)
CERN-PH-TH/2013-035
Edinburgh 2013/02
FR-PHENO-2013-003
IFUM-1008-FT
TTK-13-06
Theoretical issues in PDF determination and associated uncertainties
The NNPDF Collaboration:
Richard D. Ball,1 Valerio Bertone,2 Luigi Del Debbio,1 Stefano Forte,3
Alberto Guffanti,4 Juan Rojo5 and Maria Ubiali.6
1 Tait Institute, University of Edinburgh,
JCMB, KB, Mayfield Rd, Edinburgh EH9 3JZ, Scotland
2 Physikalisches Institut, Albert-Ludwigs-Universität Freiburg,
Hermann-Herder-Straße 3, D-79104 Freiburg i. B., Germany
3 Dipartimento di Fisica, Università di Milano and
INFN, Sezione di Milano,
Via Celoria 16, I-20133 Milano, Italy
4 The Niels Bohr International Academy and Discovery Center,
The Niels Bohr Institute, Blegdamsvej 17, DK-2100 Copenhagen, Denmark
5 PH Department, TH Unit, CERN, CH-1211 Geneva 23, Switzerland
6 Institut für Theoretische Teilchenphysik und Kosmologie, RWTH
Aachen University,
D-52056 Aachen, Germany
Abstract
We study several sources of theoretical uncertainty in the determination of parton distributions (PDFs) which may affect current PDF sets used for precision physics at the Large Hadron Collider, and explain discrepancies between them. We consider in particular the use of fixed-flavor versus variable-flavor number renormalization schemes, higher twist corrections, and nuclear corrections. We perform our study in the framework of the NNPDF2.3 global PDF determination, by quantifying in each case the impact of different theoretical assumptions on the output PDFs. We also study in each case the implications for benchmark cross sections at the LHC. We find that the impact in a global fit of a fixed-flavor number scheme is substantial, the impact of higher twists is negligible, and the impact of nuclear corrections is moderate and circumscribed.
Precision physics at the LHC requires ever better estimates of parton distribution (PDF) uncertainties (see e.g. [1]). At present PDF uncertainties do not include all sources of theoretical uncertainty: they only reflect the uncertainty of the underlying data, and (possibly) in the procedure used in the PDF determination, but not the effect of the some of the necessary theoretical approximations. However, these published PDF uncertainties are now rapidly decreasing because of the availability of abundant and precise new data from the LHC. Hence, theoretical uncertainties are soon going to become significant and in certain cases even dominant. Indeed, this might already be sometimes the case: a recent benchmarking of the dependence on PDFs of predictions for several LHC processes [2] shows that in some cases predictions obtained using different PDF sets disagree by a sizable amount on the scale of PDF uncertainties. It is then natural to ask whether some known differences in the theoretical approach used in different PDF extractions may explain these differences.
There are two sources of theoretical uncertainty on which there is currently some, albeit partial, knowledge. The first is the dependence on the perturbative order. Since all PDF sets [1] are now available at NLO and NNLO (and most also at LO), the uncertainty on the NLO results can be determined exactly, and that on the NNLO result can be at least in principle estimated from the behavior of the perturbative series [3]. The second is the dependence on the matching scheme used to include heavy quark masses. Most PDF fitting groups use a so-called general-mass variable-flavor number (GM-VFN) scheme to combine fixed order contributions computed with full inclusion of heavy quark masses with all-order resummation of contributions due to perturbative evolution in which heavy quarks are treated as massless partons. Several ways of doing so used by various PDF fitting groups, which differ by subleading terms, have been compared and benchmarked in Ref. [4]. However, some PDF fitting groups use a fixed-flavor number (FFN) scheme, where only the three lightest flavors and antiflavours are treated as massless partons and enter QCD evolution equations, while the contributions of heavy quarks are included in partonic cross sections. There are indications [5] that this choice may explain some, or perhaps even most, of the differences between PDF sets. Hence this issue deserves further investigation.
There are two further obvious, potentially large, sources of theoretical uncertainty in PDF fits. The first is related to the treatment of the medium energy region, where power-suppressed (higher-twist) contributions to the Wilson expansion may be relevant, especially for deep-inelastic scattering (DIS) data, the kinematic coverage of which sometimes extends to relatively low scales, not much above the nucleon mass. While the lowest-scale, potentially dangerous DIS data are usually excluded from PDF determinations by suitably chosen kinematic cuts, the potential impact of such data (and thus in particular the dependence on the choice of kinematic cuts) needs to be studied systematically. The second source of uncertainty is related to the fact that a sizable fraction of the DIS data (and also some Drell-Yan data) are obtained using nuclear targets: deuterium for charged-lepton DIS, and heavy nuclei for neutrino DIS. These data are crucial for the separation of light flavors, and it has been suggested recently [6, 7] that corrections due to nuclear structure may have a significant impact on the extraction of PDFs.
In this paper we will consider these three, possibly dominant, sources of theoretical uncertainties on PDFs: the use of a FFN scheme, the impact of higher twist terms, and the impact of nuclear corrections. In each case, we will repeat the NNPDF2.3 NNLO PDF fit [8] by varying the way these effects are treated, and will compare the results both in terms of their impact on PDFs and the quality of the fit, and also by checking their impact on standard LHC observables.
FFN Schemes
We first discuss the impact of the use of the FFN scheme to treat heavy flavor contributions. In the default NNPDF2.3 fit heavy quark mass effects in deep-inelastic structure functions are included using the FONLL-C scheme (see Refs. [8, 9]). In this study we have performed a new fit in which all data for DIS structure functions are treated using a FFN scheme, while other (hadronic) data are treated in the VFN scheme, with massless heavy quarks. In the FFN fit, we take, for the DIS data, at GeV2, which corresponds to , and . For the hadronic data, we also use . The fits are performed at NNLO, using massive coefficient functions for charm (namely, the same massive charm terms as in the FONLL-C scheme).
The rationale for only treating DIS data in an FFN scheme in our study is that the use of a FFN scheme has been advocated [10, 11] mostly in conjunction to the inclusion of heavy quark mass terms in deep-inelastic heavy quark production. Heavy quark mass corrections to inclusive hadronic processes used in PDF determination are usually not included (though this could be done also in a VFN scheme [12] using the FONLL method used by NNPDF), so nothing is to be learnt by using a FFN scheme in the description of these data.
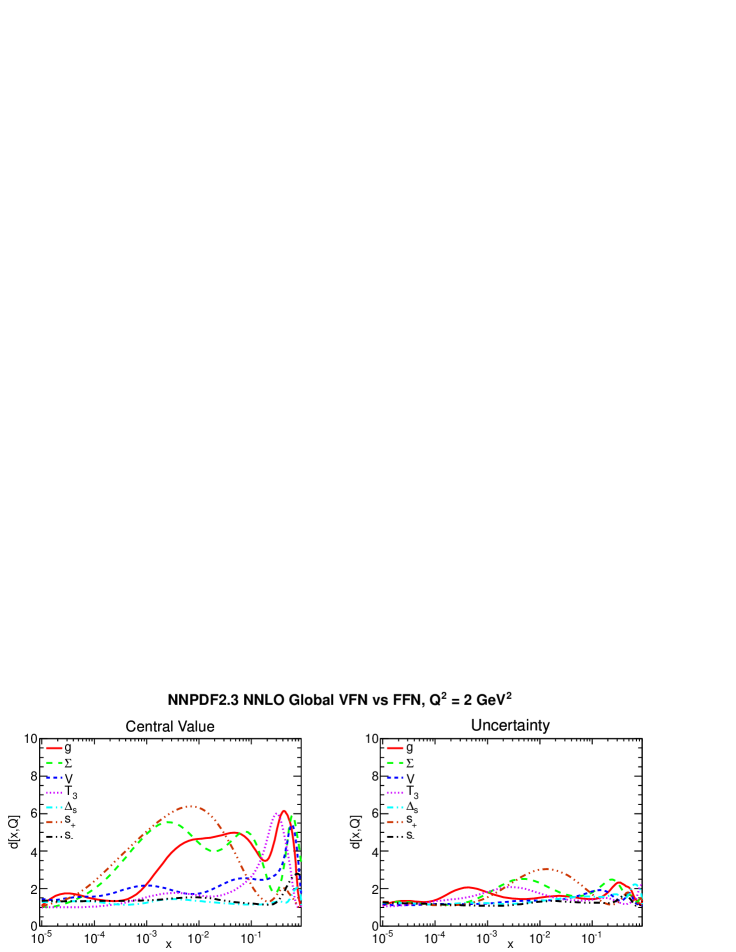
In Fig. 1 we show the distances between central values and uncertainties of PDFs thus determined, and the default NNPDF2.3 PDFs, at the initial scale GeV2. The distance between a pair of replica samples for a certain PDF at a given value of and (as defined in Appendix A of Ref. [13]) is basically the difference of the means of the two samples, in units of the standard deviation of the mean (distance between central values), or the difference of their standard deviations in units of the standard deviation of the standard deviation (distance between uncertainties). The definition entails that if we compare two different samples of replicas, each extracted from the same distribution, then on average , while if the two samples are extracted from two distributions whose means differ by one standard deviation, then on average , the difference being due to the fact that the standard deviation of the mean scales as . So corresponds to statistically equivalent PDFs, while (with replicas) corresponds to statistically inequivalent PDFs which differ by one sigma.
It is clear from Fig. 1 that the two fits are inequivalent, but differences are moderate, at the half sigma level or so, with the change being observed in central values, but with no significant change in uncertainties. The PDF which varies most is the gluon: this is easily understandable given that the gluon is determined mostly by scaling violations, which are different in the FFN case.
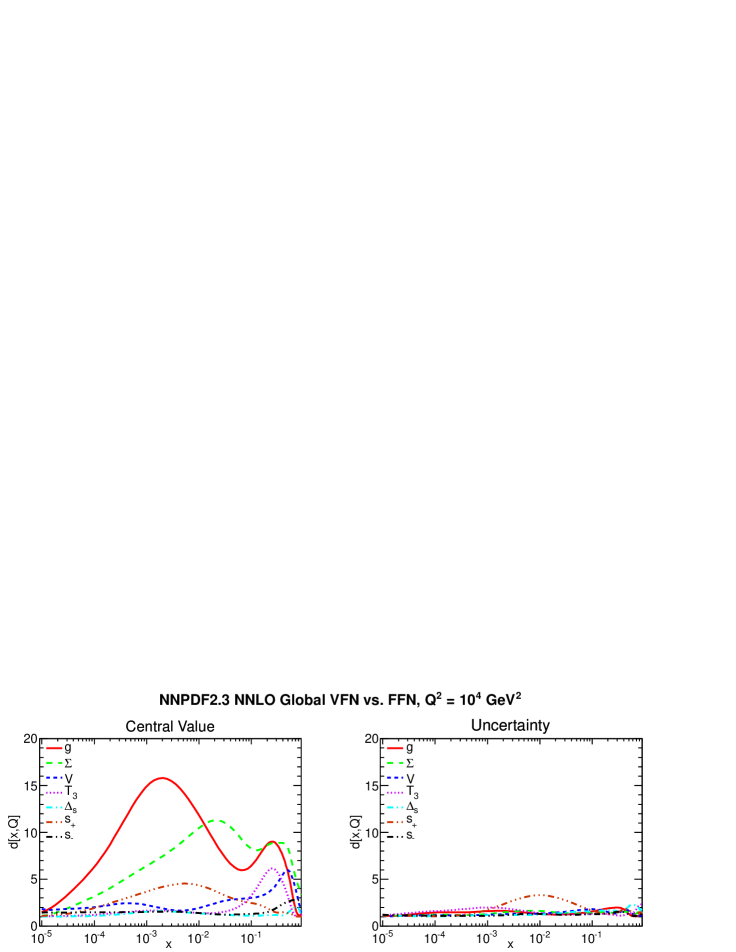
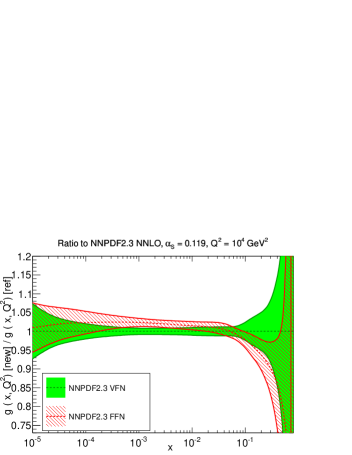
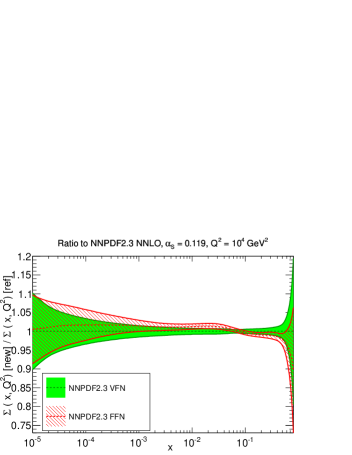
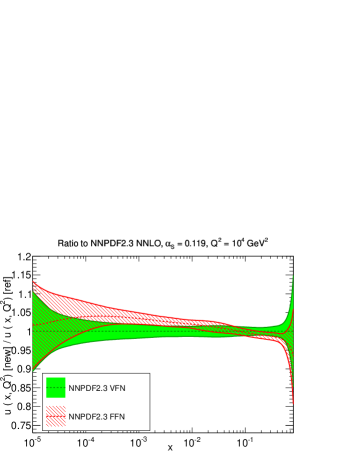
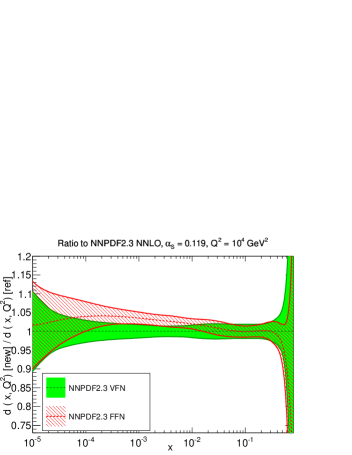
For collider physics applications, the initial PDFs, whether determined in a GM-VFN scheme, or in a FFN scheme [10, 11], are evolved upwards using the usual VFN evolution equations. It turns out that this evolution amplifies differences between GM-VFN and FFN PDFs. The amplification is demonstrated in Fig. 2, where the same distances of Fig. 2 are shown, but now at the scale GeV2 (relevant e.g. for , or Higgs production). While uncertainties are still unchanged, central values for some PDFs (specifically the gluon and the quark singlet) now differ by more than one sigma. The fact that differences become larger when evolving to higher scales can be understood as a consequence of the fact that differences in the large region (where uncertainties are large) at low scale lead upon evolution to high scale to differences in the small region, where uncertainties are relatively small. In Fig. 3 the PDFs that change most with respect to the standard NNPDF2.3 ones when adopting a FFN scheme are compared to their default counterparts, shown as a ratio to NNPDF2.3.
Having ascertained that the impact of choosing a FFN scheme is not negligible, we next ask whether a theoretical uncertainty of order of the difference between PDFs extracted in the FFN and GM-VFN schemes is being neglected when results are presented in a particular scheme. In order to understand if this is the case, we have studied the fit quality in the two fits. In Tab. 1 we show the difference between the of the DIS data, computed using the FFN or VFN PDF sets both for the total DIS dataset, or for the subset of the combined HERA-I data [14], in various kinematic regions. The so-called ‘experimental’ definition of the (to be found in the Appendix of Ref [2]) is used. The contribution to the difference from HERA DIS data is shown separately, and in each case the number of data points is given. Note that the default NNPDF2.3 cut on the final state invariant mass GeV2 is always imposed. The difference is always positive, indicating that the fit quality is always worse in the FFN case than it is with the default GM-VFN scheme. The difference in is also positive for all the remaining data in the global fit, and is equal to about 20 units for about 750 data points. Hence, the FFN PDFs provide a worse fit to the global dataset, and especially a worse fit to DIS data.
| (GeV) | (GeV) | (DIS) | (HERA-I) | ||||
|---|---|---|---|---|---|---|---|
| 72.2 | 2936 | 77.1 | 592 | ||||
| 87.1 | 1055 | 67.8 | 405 | ||||
| 40.9 | 422 | 17.8 | 202 | ||||
| 53.6 | 2109 | 76.4 | 537 | ||||
| 91.4 | 620 | 97.7 | 412 | ||||
| 84.9 | 583 | 67.4 | 350 | ||||
| 87.7 | 321 | 87.1 | 227 |
Comparing the fit quality in different kinematic regions, one can see that the deterioration in fit quality for the FFN structure functions is concentrated in the region of large GeV2 and small (and thus mostly the HERA data). This may perhaps be understood in terms of the so-called ‘double-asymptotic scaling’ properties of the structure function in this region [15]: the rise of the structure function at small has a universal logarithmic slope, driven by perturbative evolution, which depends on the number of active flavors, and current HERA data are precise enough to see the change of slope when going above threshold (see Ref. [16], in particular Fig. 5). In a FFN scheme the contribution of heavy flavors to this rise is expanded out to finite order rather than being exponentiated to all orders, and this is likely to provide a worse description of this double scaling behaviour.
We conclude that the FFN fit is actually based on a less precise theory, in that it does not include full resummation of the contribution of heavy quarks to perturbative PDF evolution, and thus provides a less accurate description of the data. The difference between FFN and GM-VFN PDFs should, therefore, be added as a theoretical uncertainty to FFN PDFs, but not to GM-VFN ones, just like the difference between NLO and NNLO PDFs is part of the theoretical uncertainty on NLO PDFs, which disappears when going to NNLO.
Higher Twist
We turn now to the study of the impact on PDF determinations of power-suppressed corrections. As is well known, DIS structure function data are affected both by power corrections of kinematic origin related to the mass of the target (TMCs, henceforth), as well as corrections related to higher twist contributions to the Wilson expansion. The former can be determined exactly in the form of an expansion in powers of , with the nucleon target mass, while the latter are of dynamical origin, and thus if included they must be fitted, just like the leading twist PDFs.
Currently, TMCs are included up to in the NNPDF2.3 (and in fact in all previous NNPDF sets) and in the ABM11 PDF determinations, though not in other PDF determinations such as MSTW08 [17], CT10[18], and HERAPDF1.5 [19, 20], where they are kept under control through suitable kinematic cuts. Dynamical higher twist corrections, on the other hand, are parametrized and fitted in the ABM11 PDF determination, but not in any of the other PDF sets, and in particular not in NNPDF2.3, where again they are kept under control by imposing a suitable kinematic cut on the invariant mass of the final state: NNPDF2.3 removes DIS data for which GeV2, and only includes data with GeV2. Similar cuts are adopted in other global fits: CT10 removes data with GeV2 and only accepts data with GeV2; MSTW08 removes data with GeV2 and only accepts data with GeV2. HERAPDF1.5 only removes data with as there are no low data in their dataset, while ABM11, who fit higher twist corrections, only remove DIS data with GeV2, while including all data with GeV2.
One may nevertheless worry that despite these cuts there might be a residual non-negligible uncertainty related to the neglect of higher twist corrections. To estimate it, we have performed a series of fits in which the leading twist computation of DIS structure functions is supplemented by a twist four correction
| (1) |
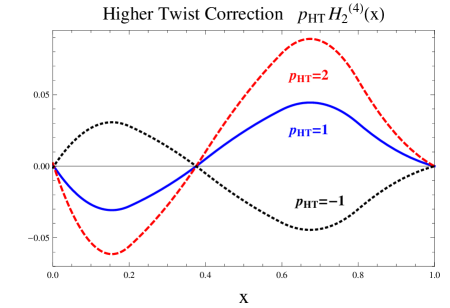
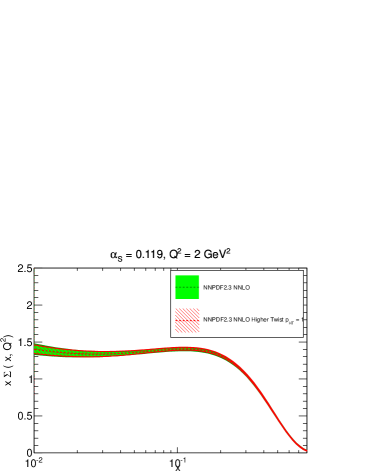
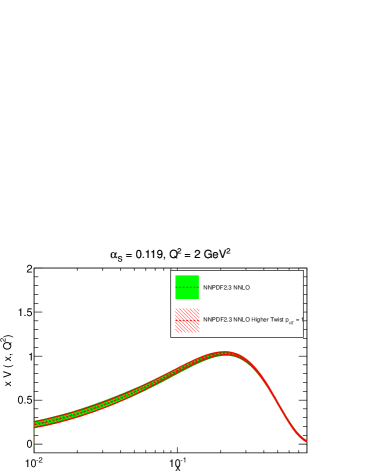
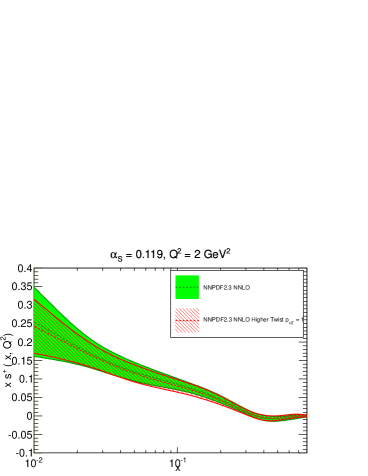
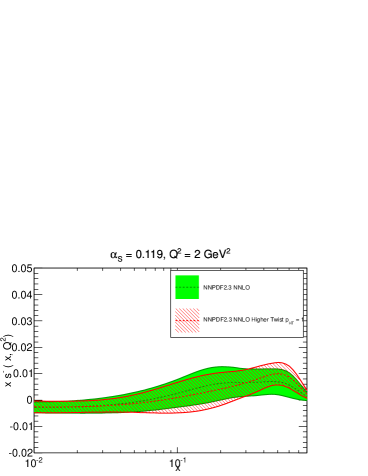
where is the leading twist NNPDF2.3 determination of the longitudinal or transverse structure function (including target-mass corrections), is a function, with dimensions of mass squared, assumed to be independent of (thus neglecting the logarithmic scale dependence of higher twist corrections) and to be taken from models or from an independent fit, and is a constant, to be used to rescale the size of the higher twist correction. We have further assumed for the form that was obtained in Ref. [11] along with the ABM11 PDF set, and we have varied the parameter , i.e. we have made it twice as large, or reversed its sign. The shape of is displayed in Fig. 4.
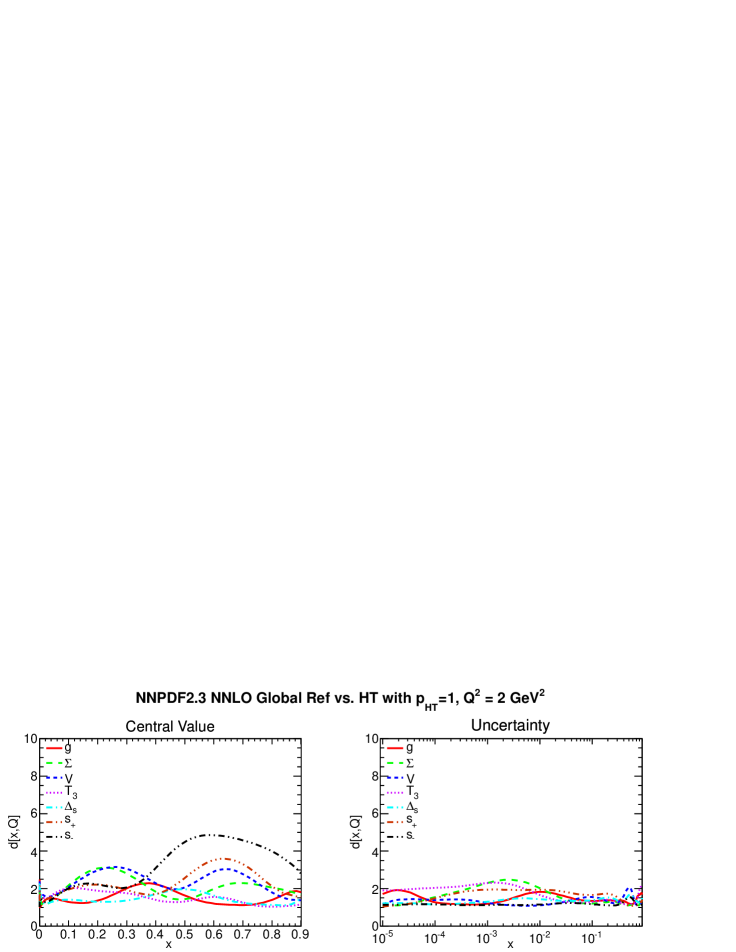
In Fig. 5 we show the distances between the PDFs determined including the higher twist correction Eq. (1) with and the default fit. The PDFs are mostly indistinguishable, the distance being compatible with statistical fluctuations. The only PDF which changes by a statistically significant amount is (which is arguably the worst determined PDF combination in the context of a global fit), which undergoes a shift by about half sigma in the valence region. The other PDFs which are most affected, namely the total strangeness, valence and singlet change even less. The PDFs which change most are compared in Fig. 6: the changes are barely visible.
| Exp | (ref) | (=1) | (=2) | (=-1) | |
|---|---|---|---|---|---|
| Total | 3561 | 3989.4 | 4003.3 | 4096.6 | 4085.7 |
| NMC | 132 | 125.5 | 125.2 | 127.3 | 126.4 |
| NMC | 224 | 365.5 | 378.1 | 385.8 | 363.1 |
| SLAC | 74 | 74.7 | 51.7 | 50.9 | 124.6 |
| BCDMS | 581 | 768.6 | 790.9 | 892.4 | 811.2 |
| HERA-I | 592 | 611.9 | 610.7 | 609.7 | 618.3 |
| CHORUS | 862 | 959.9 | 957.6 | 956.6 | 959.5 |
| H1 | 8 | 9.8 | 9.8 | 9.8 | 9.8 |
| NuTeV | 79 | 44.2 | 47.0 | 44.3 | 41.5 |
| ZEUS HERA-II | 127 | 163.5 | 164.0 | 163.8 | 163.3 |
| ZEUS | 62 | 60.9 | 60.2 | 60.9 | 62.3 |
| H1 | 45 | 69.4 | 69.2 | 68.9 | 70.1 |
| DY E605 | 119 | 98.6 | 100.4 | 97.8 | 98.0 |
| DY E886 | 199 | 263.2 | 258.0 | 253.7 | 260.9 |
| CDF asy | 13 | 21.2 | 22.0 | 21.6 | 21.4 |
| CDF rap | 29 | 53.2 | 57.7 | 62.7 | 52.2 |
| D0 rap | 28 | 17.5 | 17.7 | 18.2 | 17.6 |
| ATLAS | 30 | 41.4 | 43.1 | 42.9 | 41.4 |
| CMS el asy | 11 | 8.9 | 9.5 | 9.4 | 8.6 |
| LHCb | 10 | 7.8 | 7.8 | 7.8 | 7.6 |
| CDF RII | 76 | 59.6 | 59.77 | 53.9 | 59.6 |
| D0 RII cone | 110 | 90.6 | 89.7 | 87.2 | 93.5 |
| ATLAS jets | 90 | 73.3 | 72.7 | 70.7 | 74.7 |
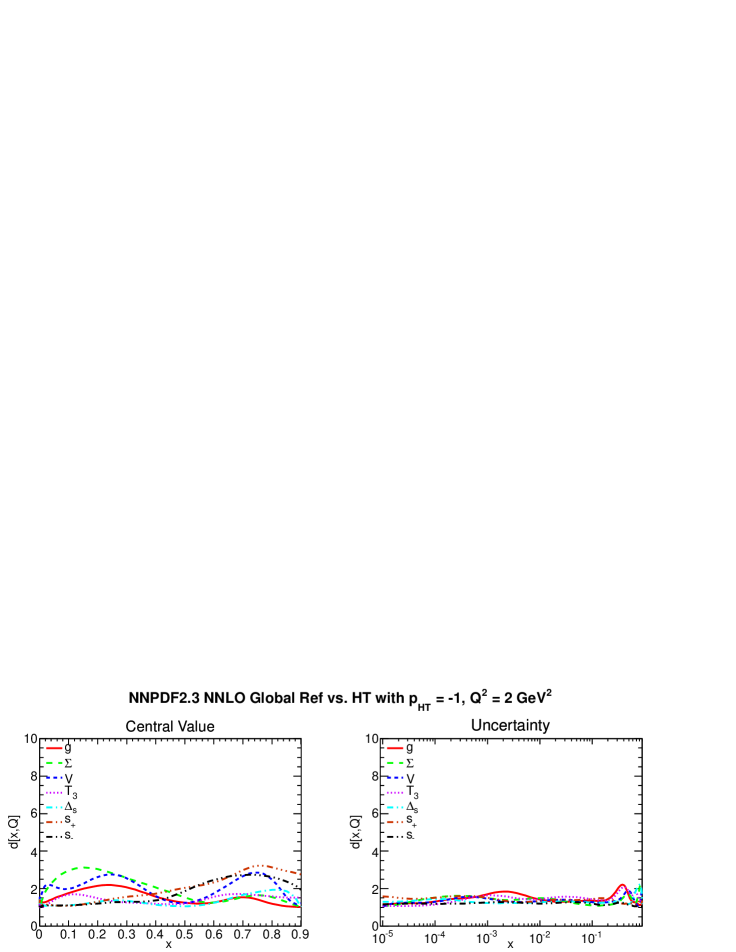
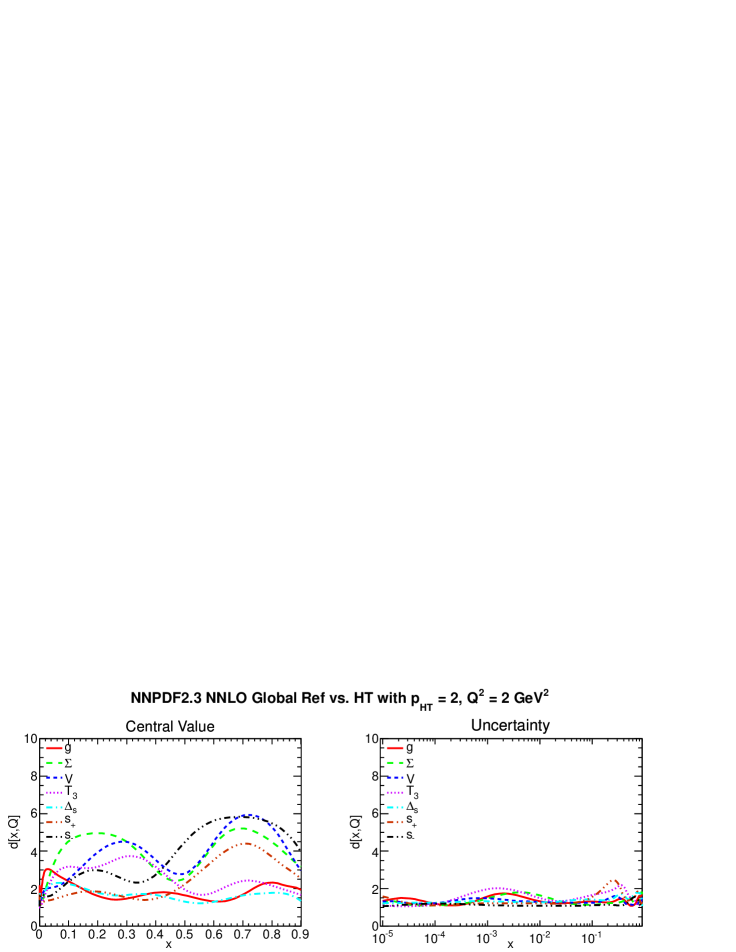
We have then repeated the PDF determination with the extreme choices and in Eq. (1). Distances are shown in Fig. 7. It is clear that when the sign of higher twist corrections is reversed, their effect remains negligible, and even when they are arbitrarily doubled, PDFs always change by less than half sigma, and mostly much less than that. This fit is performed with the same default cut GeV2 adopted in NNPDF PDF determinations: it appears that with this cut, the impact of including higher twist corrections to DIS structure functions is negligible. The same conclusion is very likely to apply to the MSTW08 and CT10 PDF determinations, which adopt similar cuts.
In Table 2 we show the for the three fits including higher twist corrections, both for the global dataset, and for each experiment. It appears that when the global is essentially unchanged, with the improvement in the desription of the SLAC data compensated by the deterioration of the fit to BCDMS data. With the other two choices, or , the fit quality deteriorates substantially, as one might expect.
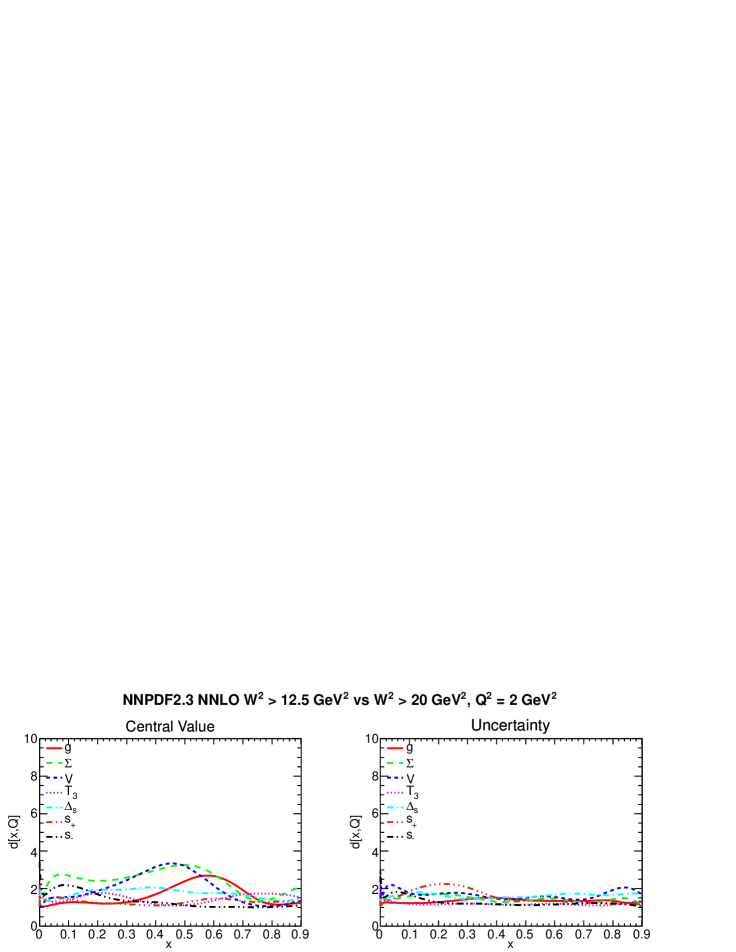
As a final consistency check, we have repeated the standard NNPDF2.3 PDF determination with no higher twist corrections, but with a stricter cut GeV2. With this cut, any possible residual effect of higher twists in the default fit would be greatly reduced, and thus the variation of results is an indication of their possible presence in the default fit. The distances between this PDF set and the default are shown in Fig. 8. Again, they are barely above the level of statistical fluctuations — because the more stringent cut changes the dataset, full statistical equivalence is not expected, but changes are below, usually much below, the half sigma level, and thus not statistically significant. We conclude that higher twist corrections and associated uncertainties are negligible in current global NNPDF sets, and so is their impact on the quality of the global fit. Similar results were found in a related MSTW analysis [21].
Nuclear Corrections
Finally, we discuss the impact of nuclear corrections on PDF determinations. In the NNPDF2.3 fit (and in other global fits such as MSTW08 and CT10) three classes of data which may be affected by nuclear corrections are used: neutrino DIS data, which are obtained on heavy, approximately isoscalar, nuclear targets (such as iron); fixed-target data for DIS on deuterium, and fixed-target Drell-Yan data on deuterium. The impact of nuclear corrections on neutrino DIS data was studied in Ref. [22], and found to be negligible in comparison to the sizable uncertainties on these data. Nuclear corrections to deuterium are rather smaller than those for heavy nuclei, but structure function data on deuterium targets can be quite precise, so here they could have an impact, especially on the determination of the up-down quark ratio at large .
The possible impact of deuterium nuclear corrections was recently emphasized in Ref. [7] where, relying on previous studies [23, 6], the CJ12 PDF sets were presented, based on CTEQ methodology but including nuclear corrections to deuterium structure function data derived using a variety of models. The impact of deuterium corrections was also recently studied in Ref. [24], where they were fitted to the data.
We have studied the impact of deuterium corrections on the NNPDF2.3 PDF determination by correcting all deuterium structure function data according to
| (2) |
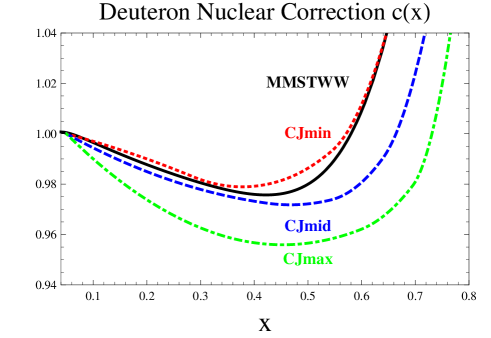
For the correction factor we have first adopted the phenomenological determination obtained in Ref. [24]. This is -independent and such that the correction is negative below a given value of and positive above it, and is parametrized by three parameters determined through a global PDF fit based on the MSTW08 methodology. We have also computed for the three choices considered in Ref. [7] (CJmin, CJmid and CJmax) using the expressions of , and provided by the authors.
Eq. (2) should be viewed as a -factor approximation, because in the nuclear models used in Ref. [7] the nuclear correction is not just multiplicative, but rather it is a -dependent correction which depends on the structure function itself, partly in a convolutive way. This approximation is adequate for our current goal, which is to determine the size of these corrections and their associated uncertainties, rather than their shape. Even though the correction of Ref. [7] is scale dependent, we have evaluated it at GeV2 and we have assumed it to be -independent, as the dependence is weak in the region [25] where, as we shall see, the impact of the correction is significant. The shape of the nuclear correction Eq. (2) in all these cases is displayed in Fig. 9.
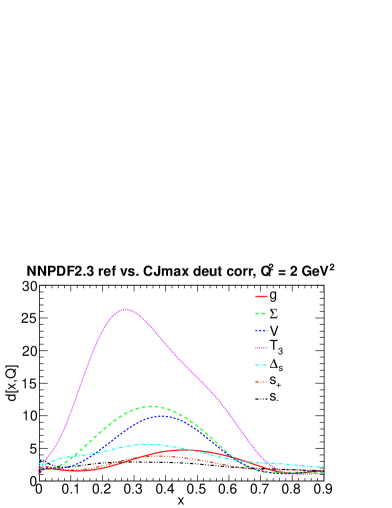
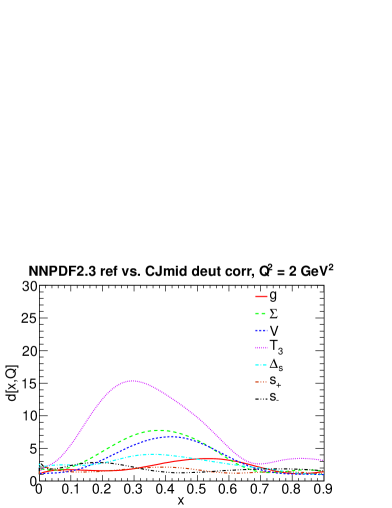
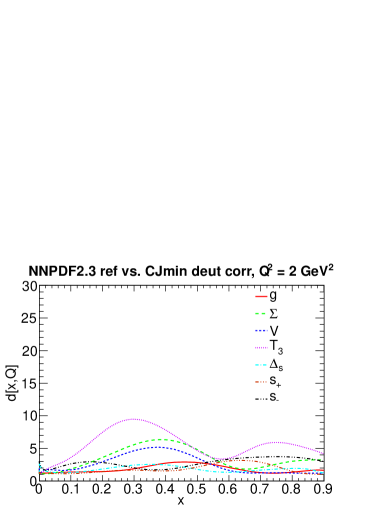
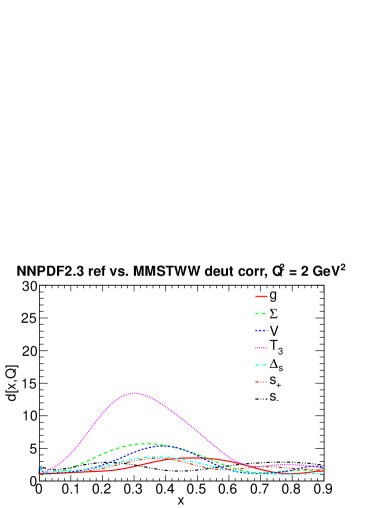
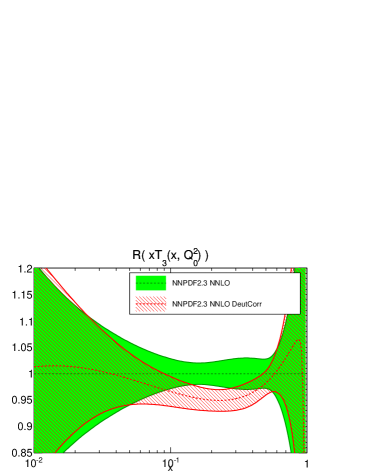
We have then repeated the NNPDF2.3 PDF determination including the correction according to each of these four models in turn. Note that only deuterium structure function data are corrected, so in particular Drell-Yan data on fixed deuterium targets remain uncorrected: indeed, Refs. [24, 7] only consider deuterium corrections to DIS structure functions. These data, however, are mostly in a kinematic region where nuclear corrections are very small. The distances between PDFs obtained including nuclear corrections in this way, and the default NNPDF2.3 PDFs, are displayed in Fig. 10. We only show distances between central values, as we have verified that uncertainties are unaffected. The only PDF combination which is significantly affected by the introduction of deuterium corrections is the isospin triplet, which changes by more than one sigma for and up to one and a half sigma at the valence peak , for the intermediate MMSTWW and CJmid cases. Changes of up to half sigma at the peak are seen also in the valence and combinations, though these, as well as all other PDFs, mostly display changes which are compatible with statistical fluctuations. In the extreme CJmax case, the variation can be up to three sigma at the peak for the isospin triplet, and up to one sigma for the singlet and . A comparison between the default fit, and that with nuclear corrections included following Ref. [24], is presented in Fig. 11 for the two PDF combinations which change most, namely the triplet and singlet.

| Exp | (ref) | (+MMSTWW) | (+CJmin) | (+CJmid) | (+Cjmax) | |
|---|---|---|---|---|---|---|
| Total | 3561 | 3989.4 | 4024.1 | 4051.0 | 4039.1 | 4102.1 |
| NMC | 132 | 125.5 | 126.6 | 130.8 | 126.5 | 132.7 |
| NMC | 224 | 365.5 | 359.2 | 363.7 | 360.0 | 367.7 |
| SLAC | 74 | 74.7 | 85.5 | 80.1 | 82.5 | 93.2 |
| BCDMS | 581 | 768.6 | 775.5 | 788.6 | 772.9 | 795.4 |
| HERA-I | 592 | 611.9 | 609.7 | 618.1 | 611.5 | 609.9 |
| CHORUS | 862 | 959.9 | 977.5 | 981.7 | 989.6 | 996.4 |
| H1 | 8 | 9.8 | 9.8 | 10.2 | 9.8 | 9.9 |
| NuTeV | 79 | 44.2 | 49.5 | 44.6 | 52.0 | 56.2 |
| ZEUS HERA-II | 127 | 163.5 | 163.8 | 162.7 | 162.9 | 163.3 |
| ZEUS | 62 | 60.9 | 60.8 | 58.0 | 61.0 | 58.7 |
| H1 | 45 | 69.4 | 69.2 | 68.0 | 68.6 | 67.9 |
| DY E605 | 119 | 98.6 | 100.7 | 100.1 | 103.0 | 102.9 |
| DY E886 | 199 | 263.2 | 258.7 | 267.4 | 265.0 | 265.4 |
| CDF asy | 13 | 21.2 | 18.3 | 22.5 | 18.9 | 19.1 |
| CDF rap | 29 | 53.2 | 57.9 | 58.1 | 57.8 | 60.5 |
| D0 rap | 28 | 17.5 | 18.2 | 18.3 | 18.3 | 18.8 |
| ATLAS | 30 | 41.4 | 41.8 | 43.6 | 41.5 | 41.7 |
| CMS el asy | 11 | 8.9 | 9.0 | 9.0 | 8.4 | 8.7 |
| LHCb | 10 | 7.8 | 7.5 | 7.3 | 7.5 | 8.7 |
| CDF RII | 76 | 59.6 | 61.4 | 57.5 | 58.4 | 62.0 |
| D0 RII cone | 110 | 90.6 | 90.5 | 89.6 | 90.4 | 90.0 |
| ATLAS jets | 90 | 73.3 | 73.1 | 71.1 | 72.7 | 72.9 |
In Ref. [7] it was argued that the quality of the global fit is essentially unaffected by these nuclear corrections, which are absorbed in a change of the PDFs, but only if they are not too large, and thus in particular it was argued that deuterium corrections as large as CJmax are disfavored by the data. In Ref. [24] a moderate but non-negligble improvement in fit quality was found when the nuclear corrections are added. In our case, we find that the fit quality is essentially unaffected by the inclusion of nuclear correction, unless they are too large, in which case the fit quality deteriorates significantly. In Table 3 we show the for the global fit and for each dataset included in it, both for the default fit and for the fits with deuterium corrections. The fit quality deteriorates somewhat upon inclusion of nuclear corrections, by an amount per datapoint () which (with the MMSTWW form of the correction) is about half the improvement seen in Ref. [24]. It is interesting to observe that most of this deterioration comes from the CHORUS neutrino deep-inelastic scattering data, which are obtained using heavy nuclear targets. These data are corrected for nuclear effects in Ref. [24], but not in our study, which might explain the difference. When CJmin and CJmid corrections are applied, the fit quality deteriorates by a smilar or somewhat larger amount (also mostly due to CHORUS data), while it deteriorates significantly if CJmax corrections are used, in agreement with the findings of Ref. [7].
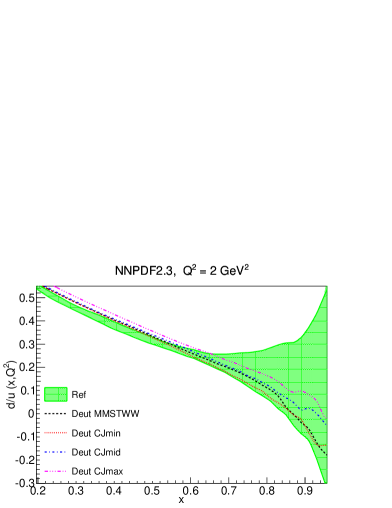
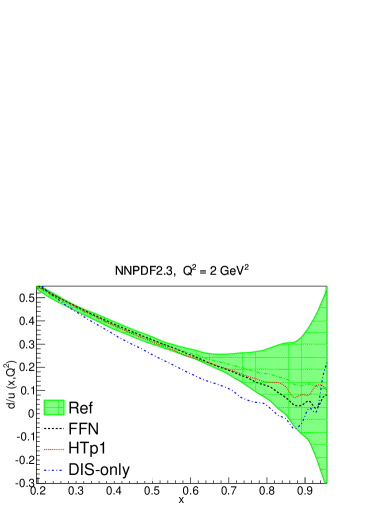
The role of nuclear corrections in determining the down/up ratio in the limit has been especially emphasized in Refs. [23, 6, 7]. In order to elucidate this point, in Fig. 12 we look at the ratio at GeV2: we show the NNPDF2.3 result with uncertainty, and we superimpose on it the central value of the ratio obtained in fits where different types of deuterium nuclear corrections are included (left plot). For comparison, we also show the effect on the central value of the ratio of only fitting to DIS data, of using a FFN scheme, and of including higher twists according to Eq. (1) with the default choice (right plot). PDF uncertainties are computed as 68% CL, since at large- uncertainties show non-gaussian behaviour. It is clear that the impact of deuterium corrections is visible for , as already seen in the distances plots of Fig. 10, but it is completely negligible in comparison to the uncertainty for larger values. Similarly negligible are the impact of higher twist corrections, and even of the use of a FFN scheme. By contrast, what does have a significant impact, up to very large is the use of DIS only data in the PDF determination.
We can therefore conclude that the use of a global dataset, including in particular a wide variety of hadronic data, is crucial in order to have a handle on the large flavor separation. On the other hand for , the light flavor separation is affected by a large uncertainty due to the scarcity of experimental information. Theoretical uncertainties related to the effects which we study here, and in particular nuclear corrections are completely negligible on the scale of these uncertainties. A somewhat different conclusion was reached in Ref. [7], where it was argued that nuclear corrections affect signficantly the ratio in the limit. In this reference, a wider dataset was used, including low and low data, while higher twist and nuclear corrections were introduced. Whereas inclusion of such data might raise somewhat the value of at which uncertainties start blowing up, it appears that when using a the more general NNPDF parametrization, rather than the more restrictive one used in Ref. [7], the uncertainties on the ratio in the limit are necessarily so large that nuclear corrections are unlikely to play a significant role.
We conclude that the impact of deuterium nuclear corrections is non-negligible in the region on the isospin triplet combination, i.e. on the up-down separation. However, the theoretical status of these corrections is not entirely satisfactory: a variety of models is available, but they are not clearly favored by the data, and may become disfavored if the correction is large. Given the uncertainties involved, the inclusion of such corrections is not clearly advantageous at present. However, it should be kept in mind that the uncertainty on the isotriplet should be supplemented by a theoretical uncertainty related to nuclear corrections in the region.
Conclusions
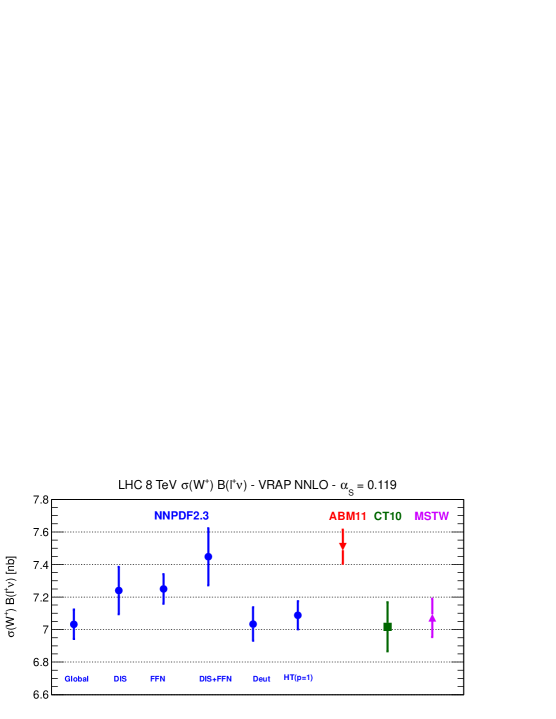
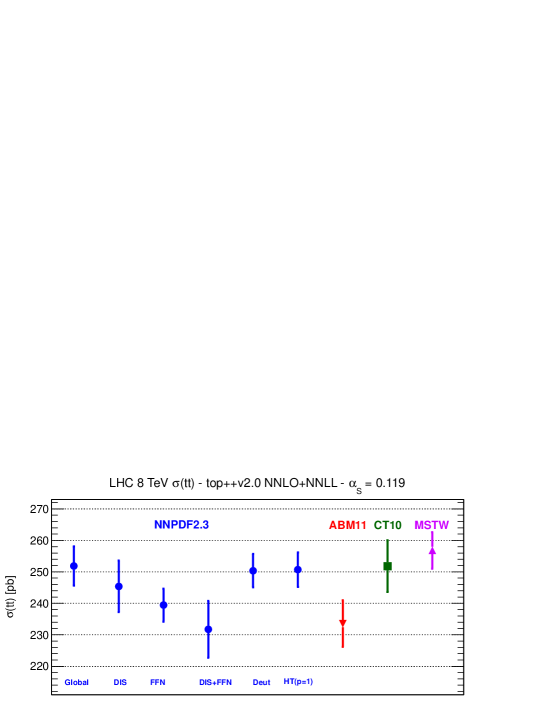
We summarize our results by looking at the impact of the three different sources of theoretical uncertainties considered here on the predictions for a representative set of LHC standard candles, namely the total cross sections for production, which is sensitive to quark and antiquark distributions, and top production, which is sensitive to the gluon distribution at large Bjorken-. We have computed these processes at NNLO, using the default NNPDF2.3 PDFs and various other sets discussed in this paper, as well as with other PDF sets which we have referred to in the course of the present discussion, namely ABM11 [11], CT10 [26, 27] and MSTW08 [17], all with a common value of . The codes and settings used to compute the various cross sections are the same as in the recent benchmark study Ref. [2]; for top production we have used the more recent version 2.0 of the Top++ code [28] (the NNPDF2.3 and ABM11 results shown are thus the same as in Ref. [29]) . Higher twist corrections are shown using the curve from Fig. 4, and deuteron corrections are shown using the MMSTWW curve from Fig. 9.
These cross-sections are shown in Fig. 13. It is clear that the impact of higher twist and nuclear corrections is negligible, both compared to PDF uncertainties and to the differences between different sets. Based on our previous discussion, it is likely that for higher twist corrections this will always be the case, while nuclear corrections might have a visible impact, up to the half sigma level on sufficiently exclusive observables which are sensitive to the up-down difference at large (such as, for example, the charge asymmetry for very high mass virtual production, or, more interestingly, heavy new particles with flavour-dependent couplings). On the other hand, the use of a FFN scheme has a visible impact, comparable to that of using a smaller dataset which only includes DIS data: however, in the latter case the PDF uncertainty automatically increases because of the smaller dataset, while when the FFN scheme is adopted an extra theoretical uncertainty should be added to the result. It is interesting to observe that Fig. 13 shows that adopting a FFN scheme, or fitting only DIS data makes the NNPDF2.3 results closer to those obtained using the ABM11 set, which is based on a smaller (mostly DIS) dataset and which uses a FFN scheme. Indeed, we have also produced a fit using the FFN scheme to DIS data only: the cross-sections we get, also shown in Fig. 13, are in suprisingly good agreement with those obtained using the ABM11 set.
In summary, we have studied the impact of three sources of theoretical uncertainties on PDF determinations: the use of a FFN scheme, and the inclusion of higher twist corrections and deuterium nuclear correction. We conclude that, adopting the dataset, methodology, and kinematic cuts of the NNPDF2.3 PDF determination, the impact of the FFN is significant, especially at high scales (), and that it leads to an extra uncertainty on the results obtained. Higher twist corrections have by contrast a negligible impact. Deuterium nuclear corrections have a moderate impact, up to one sigma, but only on the up-down separation in the large region (). Because of the poor theoretical knowledge of these effects, this should again be treated as an extra theoretical uncertainty. Forthcoming LHC data may help in keeping some of these uncertainties under control, by allowing PDF determinations which make no use of data which are subject to nuclear corrections [1].
Acknowledgements: We thank A. Accardi for providing code for the deuterium corrections of Ref. [7], and R. Thorne for providing the deuterium corrections of Ref. [24]. J. R. is supported by a Marie Curie Intra–European Fellowship of the European Community’s 7th Framework Programme under contract number PIEF-GA-2010-272515. S.F. is partially supported by a PRIN 2010 grant. The work of M.U. is supported by the DFG Sonderforschungsbereich/Transregio 9 “Computergestützte Theoretische Teilchenphysik”.
References
- [1] S. Forte and G. Watt, (2013), 1301.6754.
- [2] R.D. Ball et al., (2012), 1211.5142.
- [3] M. Cacciari and N. Houdeau, (2011), 1105.5152.
- [4] J. Rojo et al., Chapter 22 in: J. R. Andersen et al., ”The SM and NLO multileg working group: Summary report”, arXiv:1003.1241, 2010.
- [5] R. Thorne, Phys. Rev. D86 (2012) 074017, 1201.6180.
- [6] A. Accardi et al., Phys.Rev. D84 (2011) 014008, 1102.3686.
- [7] J. Owens, A. Accardi and W. Melnitchouk, (2012), 1212.1702.
- [8] R.D. Ball et al., (2012), 1207.1303.
- [9] S. Forte et al., Nucl. Phys. B834 (2010) 116, 1001.2312.
- [10] S. Alekhin et al., Phys. Rev. D81 (2010) 014032, 0908.2766.
- [11] S. Alekhin, J. Blumlein and S. Moch, (2012), 1202.2281.
- [12] M. Cacciari, M. Greco and P. Nason, JHEP 05 (1998) 007, hep-ph/9803400.
- [13] The NNPDF collaboration, R.D. Ball et al., Nucl. Phys. B838 (2010) 136, 1002.4407.
- [14] H1 and ZEUS collaborations, A. F. et al., (2009), 0911.0884.
- [15] R.D. Ball and S. Forte, Phys. Lett. B335 (1994) 77, hep-ph/9405320.
- [16] F. Caola, S. Forte and J. Rojo, Nucl.Phys. A854 (2011) 32, 1007.5405.
- [17] A.D. Martin et al., Eur. Phys. J. C63 (2009) 189, 0901.0002.
- [18] J. Gao et al., (2013), 1302.6246.
- [19] H1 and ZEUS Collaborations, V. Radescu, PoS ICHEP2010 (2010) 168.
- [20] ZEUS Collaboration, H1 Collaboration, A. Cooper-Sarkar, PoS EPS-HEP2011 (2011) 320, 1112.2107.
- [21] R. Thorne and G. Watt, JHEP 1108 (2011) 100, 1106.5789.
- [22] The NNPDF collaboration, R.D. Ball et al., Nucl. Phys. B823 (2009) 195, 0906.1958.
- [23] A. Accardi et al., (2009), 0911.2254.
- [24] A.D. Martin et al., (2012), 1211.1215.
- [25] A. Accardi, AIP Conf.Proc. 1369 (2011) 210, 1101.5148.
- [26] P.M. Nadolsky and W.K. Tung, Phys. Rev. D79 (2009) 113014, 0903.2667.
- [27] P. Nadolsky et al., (2012), 1206.3321.
- [28] M. Czakon and A. Mitov, (2011), 1112.5675.
- [29] M. Czakon et al., (2013), 1303.7215.