Transition linewidth of cross-correlations in random intensity fluctuations in EIT
Abstract
It is known that cross-correlation between the random intensity fluctuations of two lasers forming electromagnetically-induced transparency (EIT) exhibits a transition from correlation to anticorrelation. We study the linewidth behavior of this transition and have found the linewidth is below the (effective) coherence lifetime limit and is only limited by competing noises. We established a numerical model which reveals the linewidth dependence on laser linewidth and laser power. Our experiments using lasers with different linewidth showed results in qualitative agreement with the model. This result is useful for quantum optics using EIT, and may also have applications in spectroscopy and precision measurements.
pacs:
32.70.Jz, 42.50.Gy, 42.62.FiI Introduction
Manipulating photon statistics and laser noise through coherent atom-light interaction has recently become a topic of great interest for quantum optics, spectroscopy and quantum information processing. Electromagnetically induced transparency (EIT) EITreview or coherent population trapping (CPT) CPTreview is one of the most widely used processes for such purposes. Interesting findings on both the quantum fluctuations and the classical noises in EIT/CPT fields have been reported. For instance, a CPT system can be used to generate entangled bright photon pairs CPTsqueezing1 and spin squeezing simultaneously CPTsqueezing2 ; EIT is opaque to quantum fluctuations in laser fields OpacityEIT ; EIT-like features exist in the noise spectrum of lasers Godone ; Lezama ; XiaoPRA even when far off EIT resonance.
In this paper, we study the linewidth of the transition from correlation to anticorrelation in the random intensity fluctuations of the two EIT fields. Random phase noise in a laser can be converted to random intensity fluctuations after resonant laser-atom interactions. Previously, it was found that such random intensity fluctuations in the two EIT fields exhibit a transition from correlation to anticorrelation when one detunes from EIT resonance, and the transition had a linewidth narrower than that of EIT Sautenkov ; XiaoPRA ; Ariunbold ; Felinto , and seemed not to be power broadened. However, it remains unclear what determines the cross-correlation resonance linewidth, and whether this linewidth can be even narrower than the non-power-broadened EIT width, i.e., the coherence lifetime limited width.
Here, we report the finding that the linewidth is below the coherence lifetime limit and depends on the laser linewidth and laser power. In principle the linewidth can approach zero for infinitely small laser width if other noise sources are neglected. We established a numerical model (section II) which predicts linewidth behaviors in good qualitative agreement with our experimental results (section III). Although our current study is on classical noise, the result is meaningful for quantum noise experiments since laser phase noise is inevitable and laser phase noise to intensity noise conversion (PN-IN) Camparo may overwhelm quantum correlations. Meanwhile, this study can contribute to the interesting field of noise spectroscopy Noisespectroscopy1 ; Noisespectroscopy2 , and can also be useful for precision measurement purpose since such PN-IN process degrades performance of atomic frequency standards Godone .
II Theory
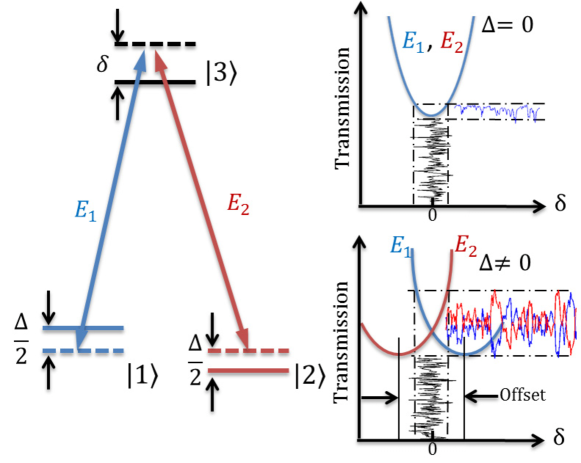
The physics picture for the sharp transition from correlation to anticorrelation was provided in ourFM for frequency-modulated lasers. It is still applicable here since the random laser noise can be viewed as the sum of frequency modulation at all frequencies noise-OL . We consider a typical CPT configuration (see Fig. 1) where the pump and probe have equal Rabi frequencies and identical phase noises originated from the same laser source. They couple the excited state to two ground states , respectively. Although the physics is valid for a generic system, we consider the Zeeman EIT for simplicity. When the two-photon detuning , and have the same one-photon detuning, and hence experience parallel PN-IN slopes leading to correlations; when , the sharp dispersion associated with the ground state coherence breaks the symmetry and induces a large offset () between the minima of the two transmission spectra ourFM . This offset gives rise to opposite PN-IN slopes around resulting in anticorrelated IN Note . This picture indicates that narrower laser linewidth leads to sharper transition from correlation to anticorrelation, as shall be verified by our theory and experiments below.
In our model, we assume the Rabi frequencies for and are , with being the random phase noise obeying Gaussian statistics, known as Wiener-Levy process qnbook ; Scullybook :
| (1) |
where is the half width of laser spectrum at half maximum (HWHM). As in Eq. (1), the phase changing rate does not depend on its historical fluctuations. Dynamics of the density matrix is determined by the stochastic optical Bloch equation CPTbook and the Hamiltonian is:
| (2) |
where is the average one-photon detuning, is the two-photon detuning and is the Hermitian conjugate. We phenomenologically introduce the excited state decay rate with equal rates to and , and ground state population difference (coherence) decay rate (). The Rabi frequency is assumed to be much smaller than , so the excited state can be eliminated and the optical coherence adiabatically follows the ground states.
Since for typical diode lasers, the effect of phase noise on atom-light interaction dominates over that of the intrinsic intensity noise, we neglect the latter in our model. The PN converted IN, and are obtained for cross-correlation calculation: where is the time average. In the optically thin regime, intensity fluctuations are proportional to coherence fluctuations of atoms, which gives the zero time lag cross correlation of the INs Sautenkov
| (3) |
where is the element of the atomic density matrix, and is the ensemble average.
The average terms in Eq. (3) can be rewritten as , where . We then define a vector composed of the independent elements of the density matrix where was applied. Following the perturbation treatment in Stocha-book using Eq. (1), the averaged master equation can be written as
| (4) |
where and contain Rabi frequency, decay rates and detunings, and is a constant diagonal matrix.
To compute the motion of , we define a matrix , and perform the same stochastic average and projection as for Eq. (4), and obtain
| (5) |
where and are of similar origins with and in Eq. (4) and is a constant matrix arising in the projection from to . Since the slowly varying envelope of is of our interest, the stationary solution of Eq. (5) is taken to compute the cross correlation. For a two level-system, analytical solution for Eq. (5) has been derived, providing a clear picture of PN to IN conversion ZollerPRA79 ; ZollerPRA88 ; ZollerPRA90 ; however, explicit forms of the solution for a three-level system are difficult to obtain due to the much more cumbersome algebra.
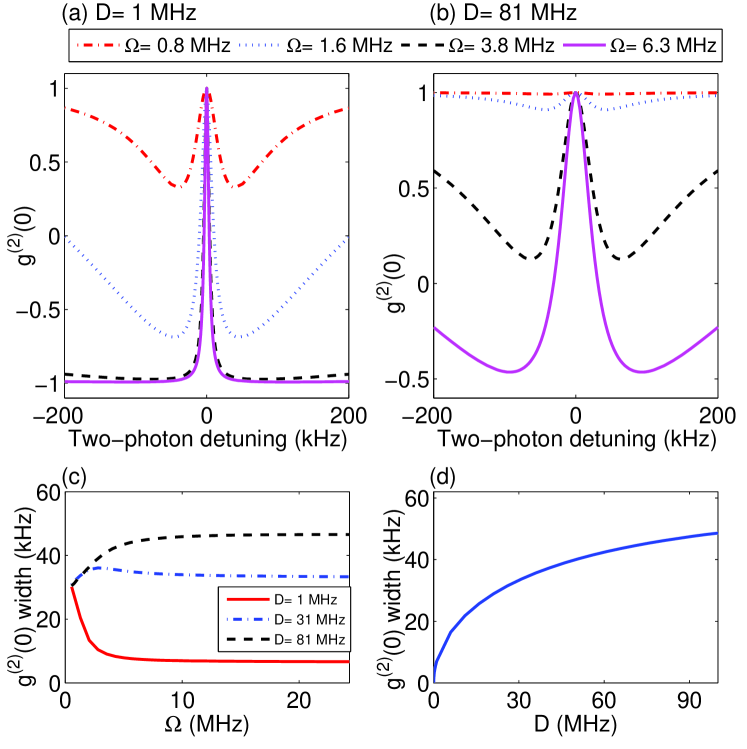
We have performed numerical calculation using Eq. (5), and found that generally the spectral lineshape of vs. two-photon detuning contains a central narrow peak superimposed on a broader dip-shaped or wing structure. It is seen that the linewidth of the wing structure increases linearly with laser power, and decreases with laser linewidth. This dependence can be explained. Anticorrelation arises from ground state coherence; since the wing structure corresponds to the disappearance of anti-correlation, its linewidth should be associated with the ground state coherence decay rate, which is equal to the optical pumping rate in the power broadening regime. We have , where is the laser linewidth, is the total Rabi frequency and is the phenomenological excited state decay rate ( MHz), and it can be seen that increases with the laser power and decreases with the laser linewidth. However, the narrow structure, when separated well from the wing structure, has an opposite linewidth dependence. Its linewidth decreases with the laser power and then saturate, as shown in Fig. 2(a) and (c), and increases with the laser linewidth. Similar trend has been observed and understood for the phase modulated laser case ourFM , where the modulation depth plays a similar role with the laser linewidth here. The physics picture is that, for higher laser power, the ground state coherence is stronger and hence the offset between the two EIT transmission minima is larger, making anti-correlation appear sooner, and linewidth smaller; for larger laser linewidth, the laser frequency effectively samples through a larger range and sees more correlation.
The linewidth of the central peak of , defined as the full width at half of the central peak’s amplitude, is then the competition result of the narrow and wing structure since the two structures are often not well separated. This is especially the case for relatively lower laser power and larger laser linewidth, where the ground state coherence is weaker, and hence complete anticorrelation cannot be reached. As shown in Fig. 2(c), the linewidth vs. Rabi frequency curve shows different trend for different laser linewidth. When the laser linewidth is larger, the wing width becomes smaller and the central peak becomes broader, making the central peak merge into the wing structure. Since the wing’s linewidth increases with Rabi frequency, the width increases with Rabi frequency. For smaller laser linewidth, the central peak separates better from the wing, and so the width behavior is dominated by that of the central peak whose width decreases with increased laser power. For intermediate laser linewidth, the linewidth increases first and then decreases with the laser power. For all laser widths, the width is saturated at high Rabi frequency because full anticorrelation is reached. The saturated width increases with laser linewidth but all remains below the lifetime limited width (Fig. 2 (c)).
III Experiment
To test the above theoretical results, experiments were carried out using a 87Rb enriched vacuum vapor cell under CPT configuration with ground states being Zeeman sublevels of , and exited states being Zeeman sublevels of , . The effective ground state coherence decay rate in our system is determined by the transit time of the atoms crossing the laser beam. Within a three-layer magnetic shield, the vapor cell was placed in a solenoid which produces a homogenous magnetic field for two-photon detuning adjustment. The laser beam was linearly polarized before entering the cell, and its right and left circular polarized components acted as and in Fig. 1 and are separately detected at the cell output by amplified photo-detectors. ac signals were acquired at the computer from an oscilloscope and the value was computed offline.
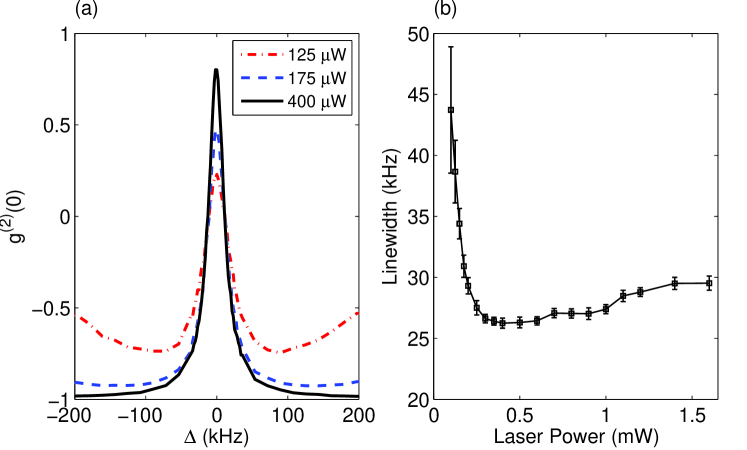
We first used an external cavity diode laser with linewidth 1 MHz. The cell temperature was C. EIT FWHM vs. laser power was measured (not shown) and We extrapolated the transit time limited width by fitting the data with polynomials and extending the fitting result to zero power. The obtained full width is 75 kHz, close to the transit time limited width estimated from the measured laser beam diameter of 2.8 mm. The vs. spectra at different laser power is shown in Fig. 3(a). The FWHM of the central peaks of vs. laser power are plotted along with EIT linewidth in Fig. 3(b). The narrowest linewidth of observed is about 1/3 of the transit linewidth of EIT. At small laser power, the spectrum can not achieve perfect anticorrelation because of the weak ground state coherence. Besides, electronics noise from the photo-detectors makes INs less correlated at . The trend of the width vs. laser power is consistent with our theoretical prediction for small laser width, except for slight broadening at large laser power. We attribute this broadening to increased influence of laser intensity noise on at higher laser power.
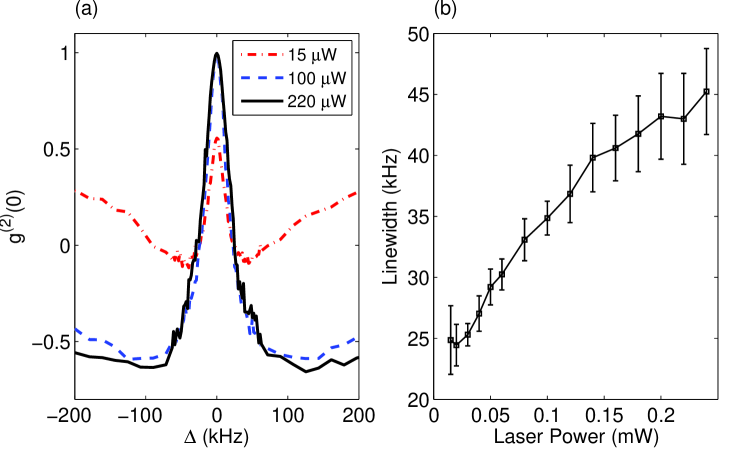
In a second experiment, we used a vertical cavity surface emitting laser (VCSEL) with a linewidth of 80 MHz. The vapor cell temperature was at C to avoid excess absorption of the relatively weak laser beam (maximal power was 250 ) . The spectra [Fig. 4(a)] and the width [Fig. 4(b)] along with EIT width are obtained at different laser power. The extrapolated transit width of EIT is 61 kHz, close to the transit width estimated from the laser diameter of 2.5 mm. linewidth is also below the transit width. The linewidth increase with laser power is consistent with the theory prediction for larger laser linewidth.
In both experiments, measured width is larger than predicted. Several factors neglected in our simple model contribute to the discrepancy: (a) intrinsic intensity noise from the laser in and are correlated and hence reduces anticorrelation; (b) electronics noise in the photo detector and data acquisition system, and eventually laser shot noise (negligible compared to other noise in our system) are not correlated and bring the towards zero; (c) Our system is not strictly in the optically thin regime, and studies show that linewidth increases with optical depth tobepublished . It is due to such broadening that for the MHz laser experiment performed under C, we observed larger linewidth than that in the VCSEL experiment performed under C. ; while the model predicts that narrower linewidth always gives narrower linewidth as shown in Fig. 2 (c). Overall, these noise sources and complications prevent the linewidth from approaching zero as predicted in our simple model.
It is worth noting that we could only achieve 1/3 of the transit linewidth here, while in our previous work, we have obtained 1/30 of the transit linewidth using frequency modulated laser ourFM . We identify the following two factors that contribute to this difference. First, although the linewidth has a positive correlation with the effective laser linewidth (including random noise and the modulated noise), one cannot compare linewidth across these two different types of laser noises simply based on the effective linewidth, because the intrinsic random phase noise has all the frequency components and there is also a random phase between different frequency components. This tends to make the linewidth for the random noise case broader than the modulated noise case even for the same effective laser linewidth. Second, when the laser frequency is modulated, the converted intensity fluctuation is at the same or twice the modulation frequency, which allows to average out random background noises such as residual laser intensity noise and electronics noise from the photo detectors. For the case of random phase noise only, converted random noise and background noise cannot be separated in the detection process, and the latter tends to wash out correlation or anticorrelation. As can be seen from Fig. 3 and Fig. 4, complete correlation and anticorrelation cannot be reached and therefore the resonance is broadened.
We note that the sharp transition from correlation to anticorrelation here has an inherent connection with the predicted sudden appearance of entanglement between collective optical modes when Raman detuning deviates from zero HXM . In ref HXM , a phase sensitive EIT based on a double system is considered, where each couples two optical fields, and the two fields coupling to the same ground state form a quantum beat and hence can be viewed as a collective field. When the Raman detuning is zero, atoms are transparent to light and cannot induce quantum correlations to the lasers; once the Raman detuning deviates from zero, the sharp dispersion of the ground state coherence drastically modifies the statistics of the fields, and entanglement occurs between any two fields from different collective modes. In brief, the connection lies in that, in our case, atom-light interaction induces anticorrelation when exact EIT resonance condition is broken, and in HXM , it introduces quantum correlation between optical fields.
IV Conclusion
In conclusion, we theoretically and experimentally studied the laser intensity noise correlations generated in atom-light interactions with a phase diffused laser in a CPT system, and found that the transition from correlation to anticorrelation can be very sharp due to the ground state coherence, with a linewidth below the lifetime-limited width and theoretically approaching zero at small laser width. This result is relevant to the realization of recent proposals of creating quantum correlations between two bright optical fields and also among atomic spins using CPT, and may also be used for spectroscopy.
We thank Michael Crescimanno, Xiangming Hu, Liang Jiang, Jianming Wen, Saijun Wu and Michael Hohensee for stimulating discussions, and Irina Novikova for suggestions in manuscript revision. This work was funded by the NBRPC(973 Program Grants No. 2012CB921604 and No. 2011CB921604), NNSFC (Grants No. 61078013, 10904018, and J1103204), and the Research Fund for the Doctoral Program of Higher Education of China. Correspondence should be sent to yxiao@fudan.edu.cn.
References
- (1) M. Fleischhauer, A. Imamoglu, J. P. Marangos, Rev. Mod. Phys. 77, 633 (2005).
- (2) J. Vanier, Appl. Phys. B 81, 421 (2007).
- (3) A. Dantan, J. Cviklinski, E. Giacobino, M. Pinard, Phys. Rev. Lett. 97, 023605 (2006).
- (4) A. Sinatra, Phys. Rev. Lett. 97, 253601 (2006).
- (5) P. Barberis-Blostein and M. Bienert, Phys. Rev. Lett. 98, 033602 (2007).
- (6) A. Godone, S. Micalizio, and F. Levi, Phys. Rev. A 66, 063807 (2002).
- (7) M. Martinelli, P. Valente, H. Failache, D. Felinto, L. S. Cruz, P. Nussenzveig and A. Lezama, Phys. Rev. A 69, 043809 (2004).
- (8) Y. Xiao, T. Wang, M. Baryakhtar, M. V. Camp, M. Crescimanno, M. Hohensee, L. Jiang, D. F. Phillips, M. D. Lukin, S. F. Yelin, and R. L. Walsworth, Phys. Rev. A 80, 041805(R) (2009).
- (9) V. A. Sautenkov, Y. V. Rostovtsev, and M. O. Scully, Phys. Rev. A 72, 065801 (2005).
- (10) G. O. Ariunbold, Y. V. Rostovtsev, V. A. Sautenkov, M. O. Scully, J. Mod. Opt. 57, 1417 (2010).
- (11) D. Felinto, L. S. Cruz, R. A. de Oliveria, H. M. Florez, M. H. G. de Miranda, P. Nussenzveig, M. Martinlli, J. W. R. Tabosa, Opt. Express 21, 1512 (2013).
- (12) J. C. Camparo, J. G. Coffer, Phys. Rev. A 59, 728(1999).
- (13) S. A. Crooker, D. G. Rickel, A. V. Balatsky, and D. L. Smith, Nature (London) 431, 49 (2004).
- (14) N. Muller and A. Jerschow, Proc. Natl. Acad. Sci. U.S.A. 103, 6790 (2006).
- (15) L. Feng, P. Li, L. Jiang, J. Wen, and Y. Xiao, Phys. Rev. Lett. 109, 233006 (2012).
- (16) M. Bahoura, A. Clairon, Opt. Lett., 26, 926 (2001).
- (17) The offset only exists when the ground state population difference decay rate is nonzero. However, the condition of anticorrelations is not the offset, but a nonzero imaginary part of .
- (18) C. W. Gardiner, Quantum Noise (Springer-Verlag, Berlin, 2000).
- (19) M. O. Scully, and M. S. Zubairy, Quantum Optics (Cambrige University Press, Cambridge, 1997).
- (20) A. Godone, F. Levi, and S. Micalizio, Coherent Population Trapping Maser (C. L. U. T, Toriao, 2002).
- (21) N. G. Van Kampen, Stochastic Processes in Physics and Chemistry (Elsevier, Singapore, 1997).
- (22) P. Zoller, Phys. Rev. A 19, 1151 (1979).
- (23) T. Haslwanter, H. Ritsch, J. Cooper, and P. Zoller, Phys. Rev. A 38, 5652 (1988).
- (24) H. Ritsch and P. Zoller, Phys. Rev. A 41, 2654 (1990).
- (25) P. Li, L. Feng et.al., to be published.
- (26) F. Wang, X. Hu, W. Shi, Y. Zhu, Phys. Rev. A 81, 033836 (2010).