A near-infrared relationship for estimating black hole masses in active galactic nuclei
Abstract
Black hole masses for samples of active galactic nuclei (AGN) are currently estimated from single-epoch optical spectra using scaling relations anchored in reverberation mapping results. In particular, the two quantities needed for calculating black hole masses, namely, the velocity and the radial distance of the orbiting gas are derived from the widths of the Balmer hydrogen broad emission lines and the optical continuum luminosity, respectively. We have recently presented a near-infrared (near-IR) relationship for estimating AGN black hole masses based on the widths of the Paschen hydrogen broad emission lines and the total 1 m continuum luminosity. The near-IR offers several advantages over the optical: it suffers less from dust extinction, the AGN continuum is observed only weakly contaminated by the host galaxy and the strongest Paschen broad emission lines Pa and Pa are unblended. Here we improve the calibration of the near-IR black hole mass relationship by increasing the sample from 14 to 23 reverberation-mapped AGN using additional spectroscopy obtained with the Gemini Near-Infrared Spectrograph (GNIRS). The additional sample improves the number statistics in particular at the high luminosity end.
keywords:
galaxies: active – galaxies: nuclei – infrared: galaxies – quasars: general1 Introduction
The discovery of tight correlations between a galaxy’s central black hole mass and the luminosity, velocity dispersion and mass of its stellar bulge (Magorrian et al., 1998; Gebhardt et al., 2000; Ferrarese & Merritt, 2000; Marconi & Hunt, 2003; Häring & Rix, 2004) is expected to strongly constrain how galaxies form and grow over cosmic time. Therefore, much effort in particular goes into measuring the rate of black hole growth (e.g., Yu & Tremaine, 2002; Heckman et al., 2004; Kelly et al., 2009). Since this requires both large samples of galaxies with easily obtainable black hole mass estimates and sources that probe the highest redshifts, such studies rely heavily on active galactic nuclei (AGN).
In general, the masses of black holes at the centres of active galaxies are measured based on the gravitational force they exert on other massive objects such as stars or gas clouds. But, whereas measurements of the stellar dispersion require spectroscopy at very high angular resolution in order to resolve the black hole’s sphere of influence, the velocity dispersion of the broad-emission line gas present at the centre of AGN can be readily measured from a single long-slit optical, ultraviolet (UV) or near-infrared (near-IR) spectrum. Then, assuming that the dynamics of the broad-emission line gas is dominated by gravitational forces, one can use the virial theorem to calculate black hole masses:
| (1) |
where is the radial distance of the broad emission line gas from the black hole, is the velocity dispersion of the gas, is the gravitational constant and is a scaling factor that depends on the (unknown) dynamics and geometry of the broad line region (BLR).
The BLR radius can be directly measured through reverberation mapping, a technique which determines the light-travel time-delayed lag with which the flux of the BLR responds to changes in the ionising continuum flux (see reviews by Peterson, 1993; Netzer & Peterson, 1997; Peterson & Bentz, 2006). However, since reverberation mapping campaigns are observing time intensive, at present the BLR radii of fewer than 50 AGN have been measured (Kaspi et al., 2000; Peterson et al., 2004; Kaspi et al., 2007; Bentz et al., 2008; Bentz et al., 2009b; Barth et al., 2011). Therefore, the so-called radius-luminosity (–) relationship is used to estimate the BLR sizes for large samples of AGN. As Peterson (1993), Wandel et al. (1999), Kaspi et al. (2000) and Bentz et al. (2009a) have shown, the BLR lags obtained from reverberation mapping campaigns correlate with the optical luminosity (of the ionising component) largely as expected from simple photoionisation arguments. The continuum luminosity is usually measured in the optical (at rest-frame 5100 Å) or in the UV.
Given the importance of the – relationship for AGN black hole mass determinations, alternatives to the optical and UV continuum luminosity are being explored, e.g., the X-ray luminosity and broad H line luminosity (Kaspi et al., 2005; Greene et al., 2010), the [O III] Å emission-line luminosity (Greene et al., 2010), the Pa and Pa emission-line luminosities (Kim et al., 2010), and the mid-infrared [Ne V] m and [O IV] m emission-line luminosities (Dasyra et al., 2008; Greene et al., 2010). In Landt et al. (2011a) we proposed the 1 m continuum luminosity as an efficient alternative that connects directly to the spectrum of the ionising source. Then, in Landt et al. (2011b) we introduced the relationship between the black hole mass and the near-IR virial product, i.e., the product between the total 1 m continuum luminosity and the width of the Paschen hydrogen broad emission lines.
The near-IR potentially affords some advantages over the optical and UV. First, the observed optical continuum can be severely contaminated by host galaxy starlight if a large slit is used (as is often the case in reverberation studies), especially in low-redshift sources that have a weak AGN or sources with a luminous stellar bulge, and so does not give directly the ionising flux. High-resolution, deep optical images are then required to estimate the host galaxy starlight enclosed in the aperture in order to correct the optical spectra (Bentz et al., 2006b, 2009a). Secondly, the optical hydrogen broad-emission lines, in particular H, and most of the UV broad emission lines are strongly blended with other species, making it difficult to reliably measure the line width. Thirdly, all optical and UV measurements may suffer from dust extinction.
Near-IR spectroscopy is now available at excellent observing sites that regularly achieve subarcsecond seeing. Additionally, the seeing is improved at longer wavelengths (e.g., by a factor of at 1 m relative to 5100 Å). This means that the host galaxy flux contribution in the near-IR can be reduced to a minimum. Note, however, that for the same (small) aperture the optical spectrum would be less dominated by host galaxy light than the near-IR one since the AGN to host galaxy flux ratio is intrinsically higher at optical wavelengths. Then, as we have shown in Landt et al. (2008), the strongest Paschen hydrogen broad emission lines Pa and Pa are observed to be free from strong blends offering the opportunity to reliably measure their widths. Furthermore, since attenuation by dust is much reduced in the near-IR compared to the optical and UV, our near-IR relationship should be particularly useful as an alternative for dust-obscured AGN.
Here we present an improved calibration of our near-IR relationship for estimating black hole masses in AGN. The paper is structured as follows. In Section 2, we introduce the enlarged sample that includes additional sources, which were observed as described in Section 3. In Section 4, we present an improved calibration of the near-IR – relationship, and in Section 5, we derive the revised relationship between the black hole mass and the near-IR virial product. A few sources in our sample are found to have near-IR luminosities dominated by host galaxy starlight and we discuss them in the context of the near-IR relationships in Section 6. In Section 7, we summarize our results and present our conclusions. Throughout this paper we have assumed cosmological parameters km s-1 Mpc-1, , and .
2 The sample
| Object name | R.A. (J2000.0) | Decl. (J2000.0) | z | J | Ref. | Ref. | log | line | type | FWHM | |||
|---|---|---|---|---|---|---|---|---|---|---|---|---|---|
| (mag) | (lt-days) | ( ) | (erg s-1) | (km s-1) | (km s-1) | ||||||||
| (1) | (2) | (3) | (4) | (5) | (6) | (7) | (8) | (9) | (10) | (11) | (12) | (13) | (14) |
| PG 0026129 | 00 29 13.60 | 13 16 03.0 | 0.145⋆ | 13.58 | B09 | 39396 | P04 | 44.72 | Pa | e | 1793 | 1798 | |
| PG 0052251 | 00 54 52.10 | 25 25 38.0 | 0.155 | 13.89 | B09 | 36976 | P04 | 44.46 | Pa | i | 4133 | 1750 | |
| 3C 120 | 04 33 11.10 | 05 21 15.6 | 0.033 | 12.67 | G12 | 667 | G12 | 43.45 | Pa | i | 2733 | 1815 | |
| PG 0804761 | 08 10 58.60 | 76 02 42.5 | 0.100 | 12.98 | 14719 | B09 | 69383 | P04 | 44.58 | Pa | lack | 2304 | 1193 |
| NGC 3516 | 11 06 47.49 | 72 34 06.9 | 0.009 | 11.13 | D10 | D10 | 43.04 | Pa | lack | 4469 | 1527 | ||
| NGC 4051 | 12 03 09.61 | 44 31 52.8 | 0.002 | 11.65 | 1.90.5 | D10 | D10 | 41.51 | Pa | e | 1681 | 762 | |
| PG 1211143 | 12 14 17.70 | 14 03 12.6 | 0.081 | 13.15 | B09 | 14644 | P04 | 44.33 | Pa | e | 1601 | 955 | |
| PG 1307085 | 13 09 47.00 | 08 19 48.2 | 0.155 | 14.16 | B09 | 440123 | P04 | 44.61 | Pa | i | 2982 | 1631 | |
| Mrk 279 | 13 53 03.45 | 69 18 29.6 | 0.030 | 12.19 | 174 | B09 | 359 | P04 | 43.43 | Pa | i | 3568 | 1580 |
| 3C 390.3 | 18 42 09.00 | 79 46 17.1 | 0.056 | 13.60 | B09 | 28764 | P04 | 44.03 | Pa | i | 7460 | 2612 | |
| Mrk 1513 | 21 32 27.81 | 10 08 19.5 | 0.063 | 12.84 | G12 | 419 | G12 | 44.08 | Pa | e | 1905 | 1265 |
The columns are: (1) object name; (2) and (3) position, and (4) redshift from the NASA/IPAC Extragalactic Database (NED); (5) band magnitude from the Two Micron All-Sky Survey (2MASS; Cutri et al., 2003); (6) radius of the H broad-emission line region (in light-days); (7) reference for the H radius, where B09: Bentz et al. (2009a), D10: Denney et al. (2010), G12: Grier et al. (2012); (8) black hole mass (in solar masses) calculated from the line dispersion assuming a scaling factor of ; (9) reference for the black hole mass, where D10: Denney et al. (2010), G12: Grier et al. (2012), P04: Peterson et al. (2004); (10) integrated total 1-m continuum luminosity; (11) Paschen emission line with the highest signal-to-noise ratio; (12) type of transition between the broad and narrow emission line component, where i: inflected (i.e., transition point is obsvious), e: estimated (i.e., transition point is estimated) and lack: absent narrow emission line component; (13) full width at half maximum (FWHM) and (14) dispersion of the broad emission line component (both uncorrected for instrumental resolution). Errors represent uncertainties.
⋆ We measure a redshift of from narrow emission lines, whereas a value of is listed in NED.

Peterson et al. (2004) reanalysed the available reverberation mapping data of a sample of 37 AGN and presented improved black hole mass determinations for 35 objects. Later, Bentz et al. (2006a), Denney et al. (2006), Denney et al. (2010) and Grier et al. (2012) refined the black hole mass estimates for some of these sources and added a new determination for the source Mrk 290.
Our original sample observed with the SpeX spectrograph (Rayner et al., 2003) on the NASA Infrared Telescope Facility (IRTF), a 3 m telescope on Mauna Kea, Hawai’i, included 16/36 reverberation-mapped AGN from the Peterson et al. sample (Landt et al., 2008). For observations with the Gemini Near-Infrared Spectrograph (GNIRS) at the Gemini North observatory, an 8.1 m telescope on Mauna Kea, Hawai’i, we have selected all the remaining northern () reverberation-mapped AGN. We were granted observations of one source (3C 120) in the Science Verification (SV) phase of GNIRS and of eight sources in semester 2011B. Additionally, two reverberation-mapped AGN (NGC 4051 and Mrk 279) were observed with the IRTF by Riffel et al. (2006) and we made use of their publicly available spectra. Therefore, our enlarged sample contains 27/36 reverberation-mapped AGN from the Peterson et al. sample. Table 1 lists the general properties of the additional sample.
Fig. 1 shows the radius of the H broad-emission line region () versus the black hole mass for the reverberation-mapped AGN with (filled circles) and without near-IR spectroscopy (open circles). The remaining sample of nine sources would increase the number statistics in particular at the high end of values. Therefore, obtaining near-IR spectroscopy of them could lead to a significant improvement of the calibration of our near-IR relationship for estimating black hole masses.
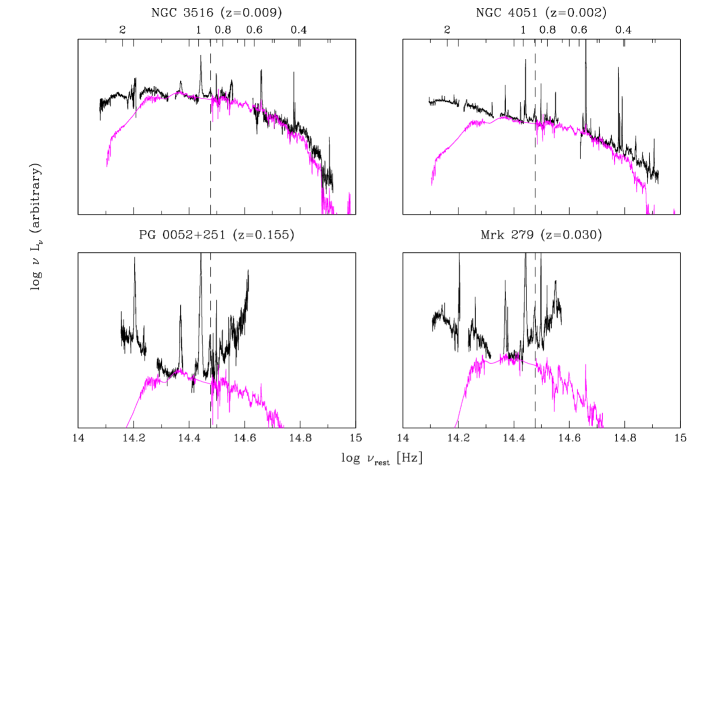
Four sources in our enlarged sample, namely, Mrk 590, NGC 3227, NGC 3516 and NGC 4051, were found to be in a very low luminosity state with a continuum spectral energy distribution (SED) strongly dominated by host galaxy emission (see Fig. 2, top panels, and Landt et al. (2011b), their Fig. 6). We have excluded these sources from the calibration of the near-IR relationships in Sections 4 and 5, but we discuss them in the general context in Section 6, since an upper limit to the integrated 1 m continuum luminosity of the AGN can be obtained from the total observed value.
3 The observations
| Object name | observation | exposure | airmass | continuum S/N | telluric standard star | ||||
| date | (sec) | J | H | K | name | distance | airmass | ||
| (∘) | |||||||||
| (1) | (2) | (3) | (4) | (5) | (6) | (7) | (8) | (9) | (10) |
| PG 0026129 | 2011 Aug 3 | 8120 | 1.144 | 62 | 95 | 69 | HD222558 | 12.1 | 1.113 |
| PG 0052251 | 2011 Aug 3 | 8120 | 1.012 | 69 | 89 | 119 | HD222558 | 23.1 | 1.149 |
| 3C 120 | 2010 Dec 15 | 2120 | 1.046 | 49 | 55 | 164 | HD34035 | 10.7 | 1.053 |
| PG 0804761 | 2011 Nov 30 | 8120 | 1.828 | 84 | 106 | 160 | HD48049 | 8.8 | 1.786 |
| NGC 3516 | 2011 Dec 8 | 4120 | 1.791 | 130 | 168 | 149 | HD48049 | 20.2 | 1.606 |
| PG 1211143 | 2011 Dec 18 | 8120 | 1.473 | 147 | 70 | 119 | HD101060 | 8.9 | 1.402 |
| PG 1307085 | 2011 Aug 11 | 8120 | 1.851 | 50 | 48 | 92 | HD116960 | 5.5 | 1.789 |
| 3C 390.3 | 2011 Aug 4 | 8120 | 2.034 | 132 | 156 | 187 | HIP942 | 27.2 | 1.901 |
| Mrk 1513 | 2011 Aug 3 | 8120 | 1.034 | 132 | 92 | 85 | HD210501 | 11.9 | 1.116 |
The columns are: (1) object name; (2) observation date; (3) exposure time; (4) average airmass; S/N in the continuum over Å measured at the central wavelength of the (5) J, (6) H, and (7) K band; for the star used to correct for telluric absorption (8) name, (9) distance from the source, and (10) average airmass.
We observed in queue mode with the Gemini Near-Infrared Spectrograph (GNIRS; Elias et al., 2006), which has recently been recommissioned at the Gemini North observatory. One source (3C 120) was observed during the Science Verification (SV) phase of GNIRS in semester 2010B (Program ID: GN-2010B-SV-165) and eight sources in semester 2011B (Program ID: GN-2011B-Q-97). We used the cross-dispersed mode with the short camera at the lowest resolution (31.7 l mm-1 grating), thus covering the entire wavelength range of m without inter-order contamination. We chose a slit of for the source 3C 120 and, due to a poor weather allocation, a larger slit of for the sources observed in semester 2011B. This set-up gives an average spectral resolution of full with at half-maximum (FWHM) km s-1 for 3C 120 and of FWHM km s-1 for the remainder of the sources. The chosen exposure times ensured that we obtained spectra with a high signal-to-noise ratio (S/N ) in order to reliably measure the broad emission line profiles.
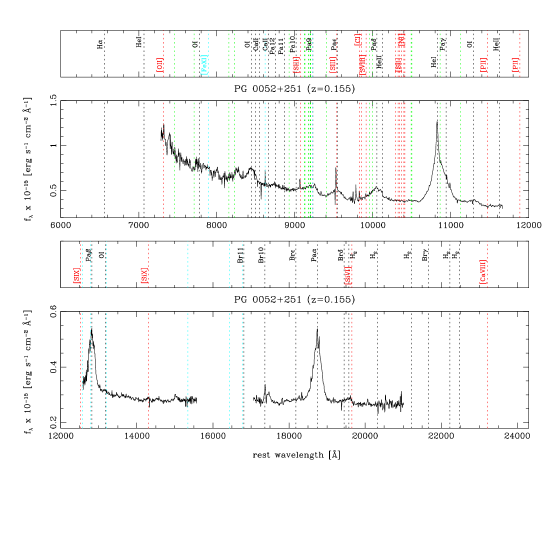
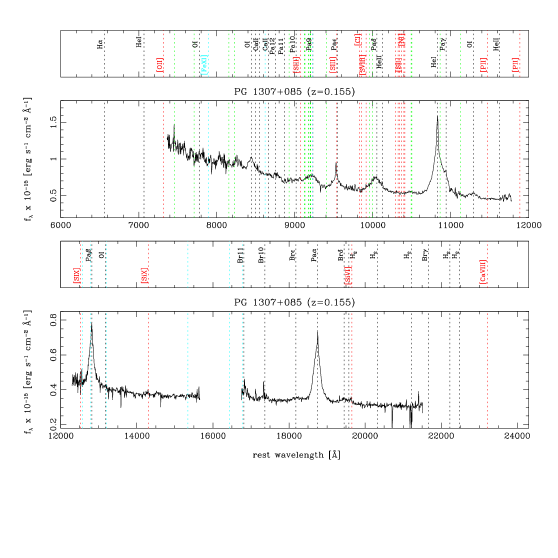
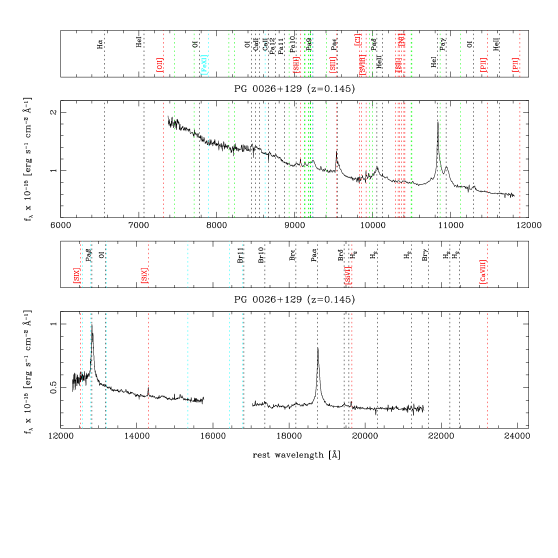
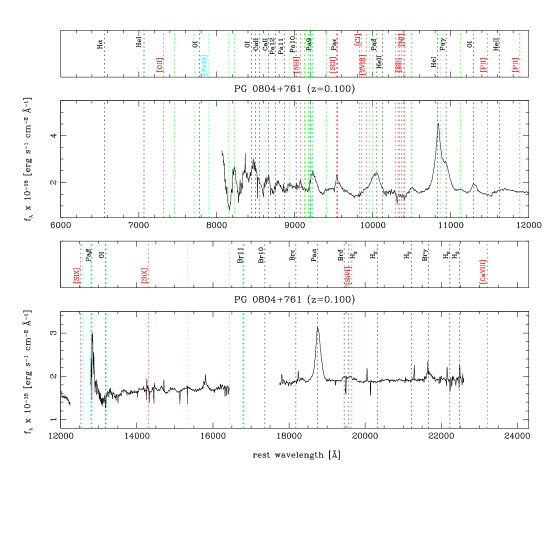
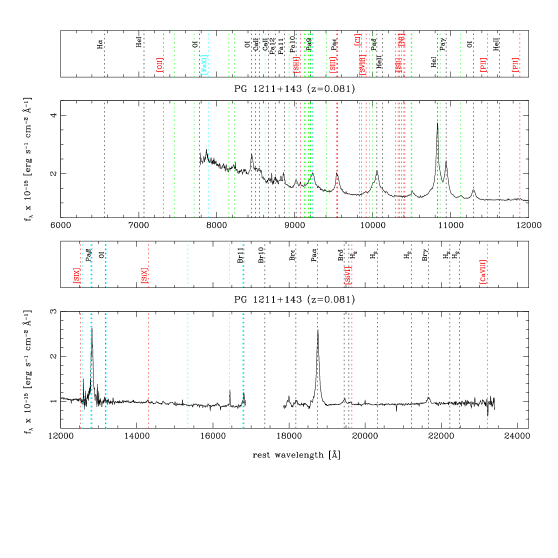
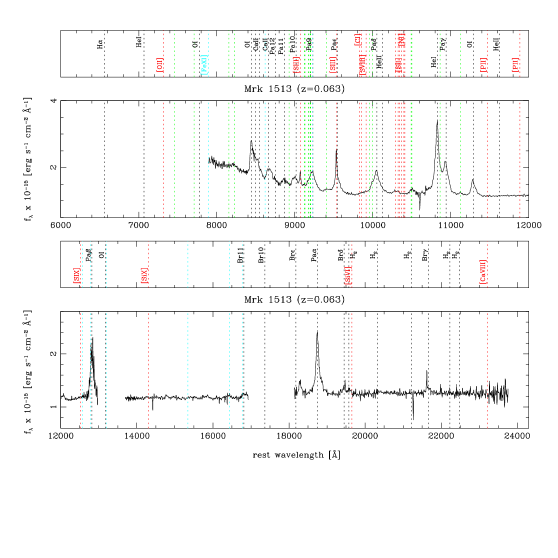
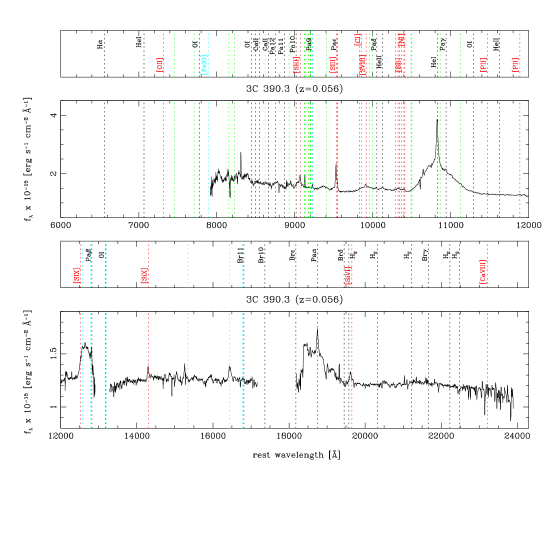
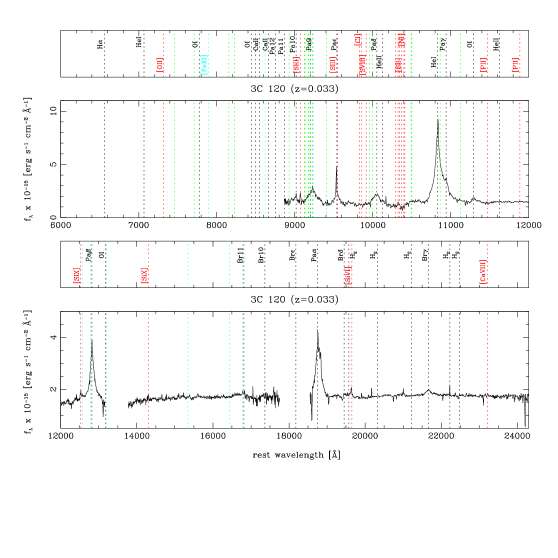
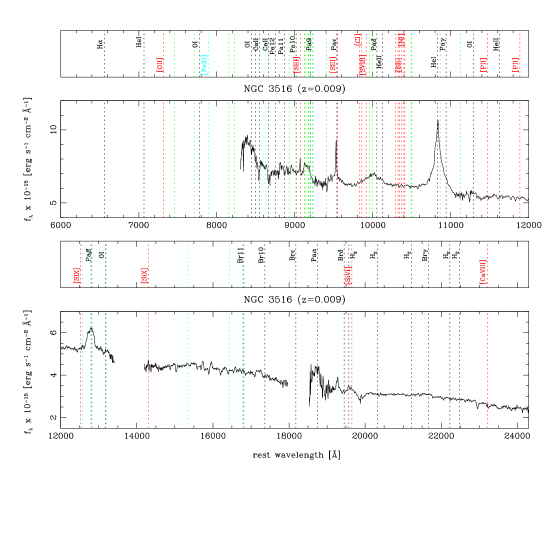
Either before or after each source, we observed a nearby (in position and air mass) A0 V star with accurate near-IR magnitudes. These stars were used to correct the source spectra for telluric absorption and for flux calibration. Flats and arcs were taken with each source/telluric standard star pair. In Table 2 we list the journal of observations. The data were reduced using the Gemini/IRAF package (version 1.11) with GNIRS specific tools (Cooke & Rodgers, 2005). The data reduction steps included preparation of calibration and science frames, processing and extraction of spectra from science frames, wavelength calibration of spectra, telluric correction and flux-calibration of spectra, and merging of the different orders into a single, continuous spectrum. The spectral extraction width was adjusted interactively for each telluric standard star and source to include all the flux in the spectral trace. The final spectra were corrected for Galactic extinction using the IRAF task onedspec.deredden with input values derived from Galactic hydrogen column densities published by Dickey & Lockman (1990). The results are shown in Fig. 9.
4 The near-IR – relationship
| Object Name | A(1+z)5100 | host | ref. | near-IR spectrum | HST flux | log | AGN/ | |
|---|---|---|---|---|---|---|---|---|
| (mag) | type | aperture | PA | ( Å) | (erg s-1) | host | ||
| (arcsec2) | (∘) | (erg s-1 cm-2 Å-1) | ||||||
| (1) | (2) | (3) | (4) | (5) | (6) | (7) | (8) | (9) |
| PG 0026129 | 0.105 | E | B09 | 0.7 5.8 | 0 | 7.65E17 | 43.70 | 9 |
| PG 0052251 | 0.115 | Sb | H02 | 0.7 4.3 | 0 | 2.67E16 | 44.22 | 0.7 |
| 3C 120 | 0.509 | S0 | P07 | 0.3 1.9 | 0 | 7.30E17 | 42.26 | 14 |
| PG 0804761 | 0.014 | E | B09 | 0.7 5.5 | 0 | 2.42E17 | 42.83 | 55 |
| NGC 3516 | 0.030 | Sb | RC3 | 0.7 4.5 | 0 | 3.06E15 | 42.66 | 1 |
| NGC 4051 | 0.000 | Sb | RC3 | 0.8 1.6 | 132 | 2.04E15 | 41.17 | 1 |
| PG 1211143 | 0.000 | E | B09 | 0.7 5.5 | 0 | 1.63E16 | 43.46 | 6 |
| PG 1307085 | 0.000 | E | B09 | 0.7 3.7 | 0 | 2.94E17 | 43.35 | 17 |
| Mrk 279 | 0.000 | Sa | P07 | 0.8 1.7 | 0 | 1.12E15 | 43.33 | 0.3 |
| 3C 390.3 | 0.085 | Sa | B09 | 0.7 5.6 | 0 | 3.58E16 | 43.40 | 3 |
| Mrk 1513 | 0.114 | S0/a | P07 | 0.7 5.7 | 0 | 1.68E16 | 43.22 | 6 |
The columns are: (1) object name; (2) Galactic extinction at rest-frame 5100 Å; (3) Hubble type of the host galaxy; (4) reference for the host type, where H02: Hamilton et al. (2002), P07: Petrosian et al. (2007), B09: Bentz et al. (2009a), RC3: de Vaucouleurs et al. (1991); (5) near-IR extraction aperture; (6) near-IR slit position angle, where PA=0∘ corresponds to E-W orientation and is defined E through N; (7) host galaxy flux at rest-frame 5100 Å, corrected for Galactic extinction using the values in column (3); (8) integrated host galaxy 1-m continuum luminosity; and (9) luminosity ratio between AGN and host galaxy at rest-frame 1-m.
| original sample (14 obj.) | enlarged sample (23 obj.) | |||||
|---|---|---|---|---|---|---|
| Type | K | S⋆ | K | S⋆ | ||
| BCES | ||||||
| Avg | 0.910.11 | 0.560.10 | 0.890.11 | 0.640.09 | ||
| MC | 0.900.13 | 0.880.12 | 0.640.10 | |||
| FITEXY | ||||||
| Avg | 0.820.10 | 0.520.10 | 53 | 0.830.09 | 0.570.08 | 53 |
| MC | 0.810.11 | 0.530.11 | 522 | 0.810.10 | 0.580.09 | 521 |
| GaussFit | ||||||
| Avg | 1.000.10 | 0.540.10 | 0.940.09 | 0.600.09 | ||
| MC | 0.950.14 | 0.560.12 | 0.620.11 | |||
⋆ Scatter calculated as the percentage of the value that, when added in quadrature to the error value, gives .
In Landt et al. (2011b) we have shown that the accretion disc spectrum of AGN, which is believed to be the main source of ionising radiation, extends well into the near-IR and still dominates the continuum at m. Therefore, a single-epoch near-IR spectrum of a broad-emission line AGN can in principle be used to estimate the BLR radius. We verified this conjecture in Landt et al. (2011a), where we introduced the near-IR radius – luminosity (–) relationship. Here we present an improved calibration of it.
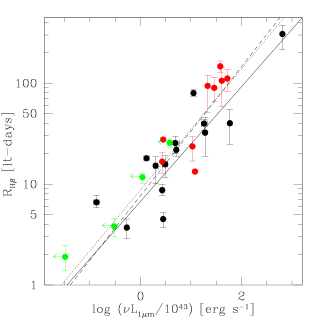
In Fig. 3 we plot the radius of the H broad-emission line region () versus the integrated total 1 m continuum luminosity for our enlarged sample of reverberation-mapped AGN (27 objects). Values for the radius of the H broad-line region are from Bentz et al. (2009a), Denney et al. (2010) and Grier et al. (2012) (see also Table 1). The near-IR measures for the original sample (black filled circles) are based on our IRTF data, whereas we have measured the integrated total 1 m continuum luminosity for the additional sample (red filled circles) in the GNIRS spectra obtained at the Gemini North observatory and for Mrk 279 in the IRTF data of Riffel et al. (2006). We observed the original IRTF sample on average twice within a period of years (Landt et al., 2008, 2011b). For these sources we use the mean integrated total 1 m continuum luminosity and the error on the mean. For the Gemini sample, which has only one observation epoch available, we have adopted the average error of the IRTF sample of dex.
The excellent atmospheric seeing on Mauna Kea, Hawai’i, where both the IRTF and the Gemini North observatories are located, allowed us to use a relatively narrow slit (), which excluded most of the host galaxy starlight. We have verified that our spectra are indeed dominated by the AGN in two separate ways. First, we have estimated the host galaxy contribution in the near-IR aperture using the Hubble Space Telescope (HST) images of Bentz et al. (2006b) and Bentz et al. (2009a) and following their approach. The observed HST fluxes were transformed to a rest-frame wavelength of 5100 Å by applying a colour correction factor based on the model bulge galaxy template of Kinney et al. (1996) and were corrected for Galactic extinction using values derived from the hydrogen column densities of Dickey & Lockman (1990). The unabsorbed rest-frame 5100 Å fluxes were then used to derive rest-frame 1 m fluxes by scaling the galaxy template from Mannucci et al. (2001) of the appropriate Hubble type. Details of our host galaxy flux estimates for the original sample are listed in Landt et al. (2011b) and for the additional sample are given in Table 3. Secondly, since HST image decomposition of AGN can be problematic at the centre of the galaxy where the bright AGN is degenerate with the concentration of the compact bulge, we have checked that the shape of the observed continuum SED is dominated by the AGN, i.e. that we observe the accretion disc and the hot dust emission rising and falling towards longer frequencies (in a logarithmic versus plot), respectively, resulting in a characteristic inflection point at the location where they meet (at m).
As expected, the relatively small aperture used in the near-IR leads to relatively high AGN to host galaxy flux ratios and so we observe a continuum SED dominated by the AGN. However, four sources (NGC 3516 and NGC 4051, see Fig. 2, top panels, and Mrk 590 and NGC 3227, see Fig. 6 in Landt et al. (2011b)) were found to have a continuum SED strongly dominated by host galaxy emission. Since in these cases the observed 1 m continuum luminosity represents only an upper limit for the AGN contribution, we have excluded these from the following analysis. For two sources (PG 0052251 and Mrk 279) the decomposition of HST images gives a relatively high host galaxy flux contribution, however, their continuum SED is clearly dominated by AGN emission (see Fig. 2, bottom panels).
With the additional sample (red filled circles) we have improved the number statistics in particular at the high end of the – relationship, where we previously had only two sources. More than half of the additional AGN have radii of the H broad-emission line region of light-days and total 1 m continuum luminosities of erg s-1. At the low-luminosity end we find mainly sources with a continuum dominated by host galaxy light (green filled circles). Therefore, improving the number statistics of the – relationship in this regime and extending its dynamic range to even lower values is likely to be problematic.
We have performed linear fits of the form following the approach of Bentz et al. (2006b) and Bentz et al. (2009a). In particular, we have used the three fitting routines BCES (Akritas & Bershady, 1996), FITEXY (Press et al., 2007) and GaussFit (McArthur et al., 1994) that can incorporate errors on both variables and, except for GaussFit, allow us to account for intrinsic scatter. Note that accounting for intrinsic scatter has the effect of increasing the weight given to data points with the largest errors, which is preferred if the intrinsic dispersion is larger than the measurement errors (Tremaine et al., 2002). Roughly a quarter of our sample (6/23 sources) has multiple measurements of and, therefore, we have considered the following two cases: (i) using the average derived from all measurements for a particular source and weighted by the mean of the positive and negative errors (i.e., weighted averages) and (ii) using Monte-Carlo (MC) techniques to randomly sample from the individual values for each object. In Table 4 we compare our previous results from Landt et al. (2011a) with the results for the enlarged sample. The latter are shown for the case of the weighted averages in Fig. 3. Note that the near-IR continuum luminosities and the optical broad-emission line radii are not measured simultaneously, which may increase the scatter in their relationship.
Simple photoionisation arguments suggest that a given emission line will be produced at the same ionising flux in all AGN and therefore . We obtain with the enlarged sample in all six cases a best-fitting slope of , which is slightly steeper than our previous results but consistent with a value of 0.5. The errors on the slope and the intercept have not been significantly reduced with the enlarged sample. Similarly, the scatter stays unchanged at , indicating that it is intrinsic rather than observational. The scatter in the near-IR – relationship is slightly larger than that of the current optical – relationship. For the entire optical sample of Bentz et al. (2009a) of reverberation-mapped AGN with host galaxy-subtracted fluxes (34 sources) we found a scatter of (Landt et al., 2011a, see their Table 2).
5 The near-IR virial product
As we have shown in Landt et al. (2011b), AGN black holes masses can be estimated from the near-IR virial product based on the 1 m continuum luminosity and the width of the Pa (or Pa) broad emission line because the widths of the broad Paschen lines are well-correlated with those of the broad Balmer lines (Landt et al., 2008). The advantages of using the near-IR instead of the optical virial product are threefold. First, since Pa and Pa are observed to be unblended (Landt et al., 2008), their width can be reliably measured. By contrast, the H broad emission line is often observed to be strongly blended with both Fe II and He II and often shows a “red shelf” most likely formed by weak Fe II multiplets and He I. Secondly, the AGN continuum around 1 m is free from major contaminating components and can be easily determined, unlike the optical, which can suffer from a pseudo-continuum caused by blended and broadened Fe II emission. Finally, since the near-IR is much less affected by dust extinction, it can potentially be applied to dust-obscured AGN.
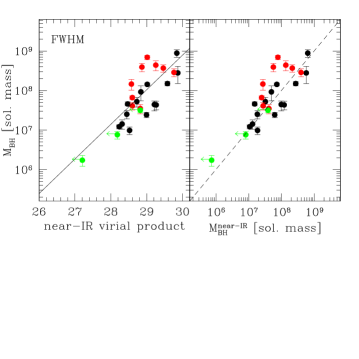
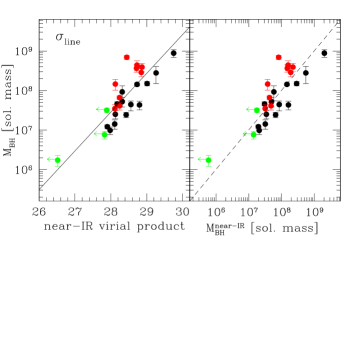
In Figs. 4 and 5 (left panels) we show the relation between the black hole mass derived from optical reverberation mapping campaigns and the near-IR virial product. We have calculated the latter using for the line width the full width at half maximum (FWHM; Fig. 4) and the line dispersion (; Fig. 5) of the Pa or Pa broad component, whichever line had the higher signal-to-noise ratio. Furthermore, we have assumed that the – relationship has a logarithmic slope of 0.5, since our results in Section 4 were consistent with this value. We have not plotted here the source Mrk 590, since it was found to have weak and noisy broad emission lines. A crucial step towards isolating the intrinsic broad-line profile is the subtraction of the narrow-line component. The narrow-line profile appears inflected, i.e., the transition point between the broad and narrow components is obvious, in roughly half of our sample (14/26 sources; see also Table 1 and Fig. 6). Four sources (PG 0844349, PG 0804761, Ark 120, and NGC 3516) clearly lack a Paschen narrow-line component, since their profiles have a broad top. However, in the remainder (8/26 sources) the transition between the broad and narrow components is not perceptible. As discussed in Landt et al. (2008), in these cases we have estimated the contribution of the narrow component to the total profile by fitting to its top part a Gaussian with FWHM equal to that of the narrow emission line [O III] . In the case of the additional sample observed with GNIRS, for which we do not have contemporaneous optical spectroscopy, we have used instead the near-IR narrow emission line [S III] . This method assumes that the FWHM of [O III] or [S III] is representative of the narrow emission line region and subtracts the largest possible flux contribution from this region.
As explained by Peterson et al. (2004), both measures of the line width have their advantages and disadvantages. Whereas the FWHM value can be measured directly in the spectrum and is less sensitive to line blending, the line dispersion is well-defined for arbitrary line profiles and is less sensitive to the presence of even strong narrow-line components. In particular for the latter reason, the black hole masses from optical reverberation campaigns are always calculated using the line dispersion, whereby this quantity is measured in the rms spectrum, i.e., in the variable part of the spectrum.
We have used the C routine MPFIT (version 1.1; Markwardt, 2009), which solves the least-squares problem with the Levenberg-Marquardt technique, to fit both correlations. The best-fit lines (solid lines in Figs. 4 and 5) are:
| (2) |
and
| (3) |
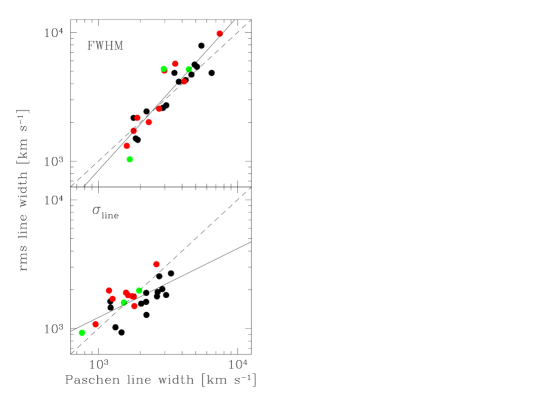
where is in solar masses, FWHM and are in km s-1 and is in erg s-1. In both cases the correlation slopes are close to one, which suggests that the line width of an unblended broad emission line in a single-epoch spectrum is a suitable proxy for the line width measured in an rms spectrum. In order to verify this claim, we have plotted in Fig. 7 the line width of the H broad emission line as measured in the rms spectrum versus that of the Pa and Pa broad components for both cases, i.e., using the FWHM (upper panel) and the line dispersion (lower panel). In the case of FWHM, we find a correlation slope consistent with unity of , however, the line dispersion in rms spectra appears to be smaller than that in single-epoch near-IR spectra (correlation slope of ). Since the line dispersion strongly depends on the total flux of the emission line, this result could be explained if the broad wings vary less than the core of the emission line since they are composed of optically thin gas (Shields et al., 1995).
In order to estimate black hole masses from single-epoch near-IR spectra one then has two options: 1. directly applying the relationship between black hole mass and near-IR virial product (eqs. (5) and (5)); and 2. applying the near-IR – relationship together with the virial theorem (eq. (1)). In Figs. 4 and 5 (right panels) we show the results for the latter option using scaling factor values of and 5.5 in the case of FWHM and line dispersion, respectively (Onken et al., 2004). Clearly, both measures of the line width give results consistent with the reverberation-based black hole masses. But we note that in the case of the line dispersion the second (but not the first) option is expected to overestimate the black hole mass (by a factor of ) given the relationship between the H rms line width and that of the Pa and Pa broad components presented in Fig. 7.

6 Low-luminosity AGN
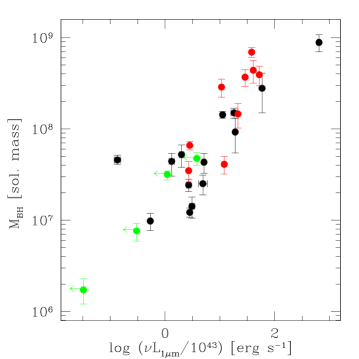
Four AGN in our sample, namely, Mrk 590, NGC 3227, NGC 3516 and NGC 4051, were found to be in a very low luminosity state with a continuum SED dominated by host galaxy emission (see Fig. 2, top panels, and Landt et al. (2011b), their Fig. 6). Therefore, in these cases the observed 1 m continuum luminosity represents only an upper limit to the AGN value. As Fig. 3 shows, these sources (shown as green filled circles) populate indeed the low end of the near-IR luminosity distribution of our sample. However, they follow not only the near-IR – relationship remarkably well, but also the so-called black hole mass-luminosity (-) relationship (Kaspi et al., 2000; Peterson et al., 2004), which we plot in Fig. 8 for the near-IR. Therefore, the AGN 1 m continuum luminosity of these sources cannot be significantly (more than a factor of ) lower than that of the host galaxy.
Can and should black hole masses be estimated for AGN with 1 m continuum luminosities dominated by host-galaxy starlight? The near-IR virial products and near-IR black hole mass values calculated for the four host-galaxy dominated sources in our sample, although only upper limits, follow well the general relationships (see Figs. 4 and 5). But we also observe that the SEDs of all these sources are dominated by the hot dust component at wavelengths m, i.e., in the near-IR H and K bands.
7 Summary and conclusions
We have presented an improved calibration of our near-IR relationship for estimating black hole masses by increasing the sample of reverberation-mapped AGN with high-quality near-IR spectroscopy from 14 to 23 sources. The additional observations were obtained at the Gemini North observatory with the Gemini Near-Infrared Spectrograph (GNIRS). Our main results can be summarized as follows.
(i) The near-IR radius – luminosity (–) relationship has in most cases a best-fitting slope of . This value is slightly steeper than our previous result but consistent with a value of 0.5, which is expected based on simple photoionization arguments. The scatter in the relationship stays unchanged at a value of , indicating that it is intrinsic rather than observational. The additional sample has improved the number statistics in particular at the high luminosity end.
(ii) The black hole mass derived from optical reverberation mapping campaigns correlates strongly with the near-IR virial product, i.e., the product between the integrated total 1 m continuum luminosity and the width of the unblended Paschen hydrogen broad emission lines Pa and Pa. The correlation slope is , which suggests that the line width of an unblended broad emission line in a single-epoch spectrum is a suitable proxy for the line width measured in an rms spectrum.
(iii) We have excluded four AGN in our sample from the calibration of the near-IR relationship, since they were found to be in a very low luminosity state and so to have a continuum emission dominated by host galaxy starlight. Nevertheless, these sources still follow the near-IR relationship remarkably well, indicating that it can be used to reliably derive upper limits on the black hole masses of low-luminosity AGN.
In the future we plan to start a near-IR reverberation mapping campaign, which will allow us to obtain time lags for the Paschen broad emission lines and thereby black hole mass relationships fully calibrated in the near-IR.
Acknowledgments
We thank an anonymous reviewer for their thoughtful comments, which improved the paper. We thank Chris Onken from the Australian Gemini Office for his excellent user support. H. L. acknowledges financial support by the European Union through the COFUND scheme. This work is based on observations obtained at the Gemini Observatory, which is operated by the Association of Universities for Research in Astronomy, Inc., under a cooperative agreement with the NSF on behalf of the Gemini partnership: the National Science Foundation (United States), the Science and Technology Facilities Council (United Kingdom), the National Research Council (Canada), CONICYT (Chile), the Australian Research Council (Australia), Ministério da Ciência, Tecnologia e Inovação (Brazil) and Ministerio de Ciencia, Tecnología e Innovación Productiva (Argentina). This research has made use of the NASA/IPAC Extragalactic Database (NED), which is operated by the Jet Propulsion Laboratory, California Institute of Technology, under contract with the National Aeronautics Space Administration.
References
- Akritas & Bershady (1996) Akritas, M. G., & Bershady, M. A. 1996, ApJ, 470, 706
- Barth et al. (2011) Barth, A. J., et al. 2011, ApJ, 743, L4
- Bentz et al. (2006a) Bentz, M. C., et al. 2006a, ApJ, 651, 775
- Bentz et al. (2009a) Bentz, M. C., Peterson, B. M., Netzer, H., Pogge, R. W., & Vestergaard, M. 2009a, ApJ, 697, 160
- Bentz et al. (2006b) Bentz, M. C., Peterson, B. M., Pogge, R. W., Vestergaard, M., & Onken, C. A. 2006b, ApJ, 644, 133
- Bentz et al. (2008) Bentz, M. C., et al. 2008, ApJ, 689, L21
- Bentz et al. (2009b) Bentz, M. C., et al. 2009b, ApJ, 705, 199
- Cooke & Rodgers (2005) Cooke, A., & Rodgers, B. 2005, in Astronomical Society of the Pacific Conference Series, Vol. 347, Astronomical Data Analysis Software and Systems XIV, ed. P. Shopbell, M. Britton, & R. Ebert, 514
- Cutri et al. (2003) Cutri, R. M., et al. 2003, The 2MASS All-Sky Catalog of Point Sources, University of Massachusetts and Infrared Processing and Analysis Center (IPAC/California Institute of Technology)
- Dasyra et al. (2008) Dasyra, K. M., et al. 2008, ApJ, 674, L9
- de Vaucouleurs et al. (1991) de Vaucouleurs, G., de Vaucouleurs, A., Corwin, H. G., Jr., Buta, R. J., Paturel, G., & Fouque, P. 1991, Third Reference Catalogue of Bright Galaxies (Springer-Verlag Berlin Heidelberg New York, Volume 1-3, XII)
- Denney et al. (2006) Denney, K. D., et al. 2006, ApJ, 653, 152
- Denney et al. (2010) Denney, K. D., et al. 2010, ApJ, 721, 715
- Dickey & Lockman (1990) Dickey, J. M., & Lockman, F. J. 1990, ARA&A, 28, 215
- Elias et al. (2006) Elias, J. H., Joyce, R. R., Liang, M., Muller, G. P., Hileman, E. A., & George, J. R. 2006, in Society of Photo-Optical Instrumentation Engineers (SPIE) Conference Series, Vol. 6269, Society of Photo-Optical Instrumentation Engineers (SPIE) Conference Series
- Ferrarese & Merritt (2000) Ferrarese, L., & Merritt, D. 2000, ApJ, 539, L9
- Gebhardt et al. (2000) Gebhardt, K., et al. 2000, ApJ, 539, L13
- Greene et al. (2010) Greene, J. E., et al. 2010, ApJ, 723, 409
- Grier et al. (2012) Grier, C. J., et al. 2012, ApJ, 755, 60
- Hamilton et al. (2002) Hamilton, T. S., Casertano, S., & Turnshek, D. A. 2002, ApJ, 576, 61
- Häring & Rix (2004) Häring, N., & Rix, H.-W. 2004, ApJ, 604, L89
- Heckman et al. (2004) Heckman, T. M., Kauffmann, G., Brinchmann, J., Charlot, S., Tremonti, C., & White, S. D. M. 2004, ApJ, 613, 109
- Kaspi et al. (2007) Kaspi, S., Brandt, W. N., Maoz, D., Netzer, H., Schneider, D. P., & Shemmer, O. 2007, ApJ, 659, 997
- Kaspi et al. (2005) Kaspi, S., Maoz, D., Netzer, H., Peterson, B. M., Vestergaard, M., & Jannuzi, B. T. 2005, ApJ, 629, 61
- Kaspi et al. (2000) Kaspi, S., Smith, P. S., Netzer, H., Maoz, D., Jannuzi, B. T., & Giveon, U. 2000, ApJ, 533, 631
- Kelly et al. (2009) Kelly, B. C., Vestergaard, M., & Fan, X. 2009, ApJ, 692, 1388
- Kennicutt (1992) Kennicutt, R. C., Jr. 1992, ApJS, 79, 255
- Kim et al. (2010) Kim, D., Im, M., & Kim, M. 2010, ApJ, 724, 386
- Kinney et al. (1996) Kinney, A. L., Calzetti, D., Bohlin, R. C., McQuade, K., Storchi-Bergmann, T., & Schmitt, H. R. 1996, ApJ, 467, 38
- Landt et al. (2011a) Landt, H., Bentz, M. C., Peterson, B. M., Elvis, M., Ward, M. J., Korista, K. T., & Karovska, M. 2011a, MNRAS, 413, L106
- Landt et al. (2008) Landt, H., Bentz, M. C., Ward, M. J., Elvis, M., Peterson, B. M., Korista, K. T., & Karovska, M. 2008, ApJS, 174, 282
- Landt et al. (2011b) Landt, H., Elvis, M., Ward, M. J., Bentz, M. C., Korista, K. T., & Karovska, M. 2011b, MNRAS, 414, 218
- Magorrian et al. (1998) Magorrian, J., et al. 1998, AJ, 115, 2285
- Mannucci et al. (2001) Mannucci, F., Basile, F., Poggianti, B. M., Cimatti, A., Daddi, E., Pozzetti, L., & Vanzi, L. 2001, MNRAS, 326, 745
- Marconi & Hunt (2003) Marconi, A., & Hunt, L. K. 2003, ApJ, 589, L21
- Markwardt (2009) Markwardt, C. B. 2009, in ASP Conference Series, Vol. 411, Astronomical Data Analysis Software and Systems XVIII, ed. D. Bohlender, P. Dowler, & D. Durand (San Francisco: Astronomical Society of the Pacific), arXiv:0902.2850v1
- McArthur et al. (1994) McArthur, B., Jefferys, W., & McCartney, J. 1994, in Bulletin of the American Astronomical Society, Vol. 26, 900
- Moustakas & Kennicutt (2006) Moustakas, J., & Kennicutt, R. C., Jr. 2006, ApJS, 164, 81
- Netzer & Peterson (1997) Netzer, H., & Peterson, B. M. 1997, in Astrophysics and Space Science Library, Vol. 218, Astronomical Time Series, ed. D. Maoz, A. Sternberg, & E. M. Leibowitz, 85
- Onken et al. (2004) Onken, C. A., Ferrarese, L., Merritt, D., Peterson, B. M., Pogge, R. W., Vestergaard, M., & Wandel, A. 2004, ApJ, 615, 645
- Peterson (1993) Peterson, B. M. 1993, PASP, 105, 247
- Peterson & Bentz (2006) Peterson, B. M., & Bentz, M. C. 2006, New AR, 50, 796
- Peterson et al. (2004) Peterson, B. M., et al. 2004, ApJ, 613, 682
- Petrosian et al. (2007) Petrosian, A., McLean, B., Allen, R. J., & MacKenty, J. W. 2007, ApJS, 170, 33
- Press et al. (2007) Press, W. H., Teukolsky, S. A., Vetterling, W. T., & Flannery, B. P. 2007, Numerical Recipes 3rd Edition: The Art of Scientific Computing (Cambridge University Press)
- Rayner et al. (2003) Rayner, J. T., Toomey, D. W., Onaka, P. M., Denault, A. J., Stahlberger, W. E., Vacca, W. D., Cushing, M. C., & Wang, S. 2003, PASP, 115, 362
- Riffel et al. (2006) Riffel, R., Rodríguez-Ardila, A., & Pastoriza, M. G. 2006, A&A, 457, 61
- Shields et al. (1995) Shields, J. C., Ferland, G. J., & Peterson, B. M. 1995, ApJ, 441, 507
- Tremaine et al. (2002) Tremaine, S., et al. 2002, ApJ, 574, 740
- Wandel et al. (1999) Wandel, A., Peterson, B. M., & Malkan, M. A. 1999, ApJ, 526, 579
- Yu & Tremaine (2002) Yu, Q., & Tremaine, S. 2002, MNRAS, 335, 965
Appendix A Gemini Near-IR spectra