Econophysics of adaptive power markets:
When a market does not dampen fluctuations but amplifies them
Abstract
The average economic agent is often used to model the dynamics of simple markets, based on the assumption that the dynamics of many agents can be averaged over in time and space. A popular idea that is based on this seemingly intuitive notion is to dampen electric power fluctuations from fluctuating sources (as e.g. wind or solar) via a market mechanism, namely by variable power prices that adapt demand to supply. The standard model of an average economic agent predicts that fluctuations are reduced by such an adaptive pricing mechanism.
However, the underlying assumption that the actions of all agents average out on the time axis is not always true in a market of many agents. We numerically study an econophysics agent model of an adaptive power market that does not assume averaging a priori. We find that when agents are exposed to source noise via correlated price fluctuations (as adaptive pricing schemes suggest), the market may amplify those fluctuations. In particular, small price changes may translate to large load fluctuations through catastrophic consumer synchronization. As a result, an adaptive power market may cause the opposite effect than intended: Power fluctuations are not dampened but amplified instead.
I Introduction
Modern power markets face the challenge to satisfy a continuous demand for electricity, despite fluctuating energy sources as, e.g. solar or wind pepermanns2005 ; carrasco2006 ; blaabjerg2006 ; kundur1994 ; butler2007 ; marris2008 . It has been proposed to reduce fluctuations in power markets via time-varying pricing schemes, in order to stimulate the shift of energy consuming activities with flexible execution times as, e.g. washing or heating, to times with excess supply luh1982 ; allcott2011 ; agarwal2012 ; roozbehani2012 . From the perspective of a standard economic theory this is a simple picture: A specific value of the price leads to a predictable total demand. Consequently, there is an equilibrium price, where demand and supply are balanced. As a result, one would expect that part of the demand thereby is shifted to times with lower prices luh1982 . Thus the market would act as a low pass filter for power fluctuations, an elegant idea at first sight, indeed.
However, real markets often behave differently than the single representative agent of standard economic theory, most prominently illustrated by crashes of stock markets and similar phenomena resulting from interactions among many agents kirman1989 ; kirman1993 ; challet1997 ; lux1999 ; sornette2004 . Even in markets where agents do not interact directly, they may exhibit coordinated behavior. For example, the actions of consumers may self-organize on the time axis, with catastrophic synchronization as a possible result. In that case, averaging over the dynamics of many agents over time is not appropriate because the central limit theorem does not hold anymore. The market, instead of acting like a low pass filter that dampens fluctuations, turns into a generator for catastrophic time series.
In fact, problems with the central limit theorem in dynamical systems with many degrees of freedom are well known from different fields, and often are related to time series that exhibit large fluctuations. Such phenomena have been discussed, for example, in the contexts of earthquakes, rice piles, stock markets, solar flares, and mass extinctions newman1996 ; newman1996_2 ; sneppen1997 . These systems have in common that fluctuations with broad or power law size distributions occur that do not need a full mechanism of self-organized criticality (SOC) at work. Instead, coherent stochastic noise acting on a system with many agents may suffice to explain such power law distributed fluctuations newman1996 . Agents can react to the coherent noise in a way that causes their actions to synchronize at rare events. As a result, power law distributed event sizes appear even for narrow (and even Gaussian) distributions of the coherent noise sneppen1997 .
In this paper we study whether this mechanism may be at work in markets, or more specifically, in power markets. Collective behavior of agents in a market can be treated with agent based models allowing for individual behavior of agents. Agent based models constructed on simple rules of individual behavior in markets have been shown to exhibit many features of real markets kirman1993 ; challet1997 ; lux1999 ; sornette2004 ; samanidou2007 . We here study one of the simplest possible agent based models for an adaptive power market.
Our toy model consists of independent agents reacting to a predefined global price time series. Their rare consumption events set in, once the actual price is below an individual highest acceptable price. The highest acceptable prices of each agent are updated with a stochastic process to account for saturation after consumption and growing need for electricity in times without consumption. This is to model rare consumption events with flexible execution time, while the base demand connected to time-fixed activities is ignored in this study. We analyze the effect of demand synchronization at low prices. As a result, the total demand can exceed the average demand by several orders of magnitude. To prove the robustness of this behavior, we analyze the demand distribution and the demand curve (demand over price) for different price time series with and without correlation. We find the behavior of our artificial market to be in sharp contrast to standard economic theory. A sensitive demand curve and saturation effects question the application of equilibrium prices.
II Model description
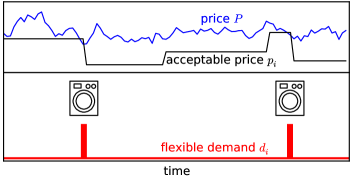
Let us now define the power market agent model. We analyze an artificial market consisting of one power provider and power consumers. In every (integer) time step the power provider sets a price (with time average ) visible to all consumers. The individual demand of an agent is defined as
| (1) |
with its individual highest acceptable price , as illustrated in Fig. 1. It is initialized with and evolves according to
| (2) |
The term denotes a random number uniformly drawn from the half open interval . The first case () corresponds to power consumption at time . As a consequence, the acceptable price will then also be lowered to represent saturation. The second case, rare increases of the highest acceptable price with probability , is to model the increasing need for power-consumption with time. This stochastic evolution of is inspired by the coherent noise model by Newman and Sneppen newman1996 where a resilience threshold towards catastrophic events is evolved in time.
The total demand is satisfied by the power provider. We avoid including an additional contribution of time-fixed activities into this model, since this part is not the focus of the present study and would not change the overall dynamics. To analyze the capabilities of the power provider to shape demand time series , we use different types of noisy time series . We take independent identically distributed prices out of a Gaussian distribution with mean and different standard deviations . Additionally, to consider correlations over time (as they are known for common price time series and for weather phenomenons), we use a Langevin-equation
| (3) |
with an independent normally distributed random variable (the green line in Fig. 3 shows the Gaussian density for such a time series).
III Synchronization at low prices
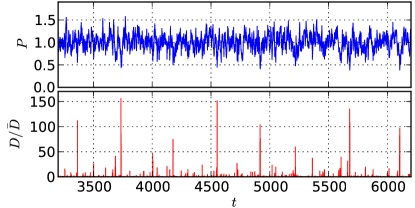
Fig. 2 on top shows a section of a price time series according to Eq. (3) with and . In the bottom panel, we see the according demand divided by the average demand. The average demand for the system with , agents and a simulation time of (plus initial time steps for reaching a stationary state) was calculated to be . Therefore, a single agent demands on average . The time series of shows demand peaks more than two orders of magnitude above the average demand dominating the whole time series. This is due to synchronization: At low prices, many agents demand at the same time. As a result, the prices, fluctuating in a narrow range, cause a broadly distributed demand time series with extreme events.
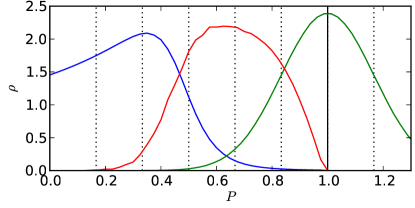
In Fig. 3 we see the density of highest acceptable prices averaged over time and agents (blue line),
| (4) |
the density of total loads consumed at certain prices (red line),
| (5) |
and the price distribution (green line). With for and lying in the same interval and else, a binning of values is realized. The average price is indicated with a black vertical line, and multiples of one standard deviation of the price distribution are indicated with dotted vertical lines. We observe that only a small fraction of the demands are executed within one standard deviation of the price, 35% of the price events only lead to 18% of the demand. This part is due to agents who need to consume power very soon. The average price for consumers is much lower. Due to synchronization effects, rare events below constituting only 0.14% of the time series lead to a part of 16% of the total demand. In conclusion the agents indeed consume at low costs and their strategy is beneficial. Additionally, the strategy represents individual needs, implemented by random moves of the individual highest acceptable prices.
IV Robust occurrence of high demand
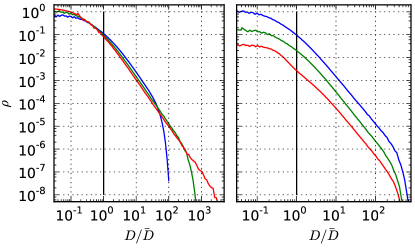
In Fig. 4 on the left, the distribution of demand is shown for independent Gaussian distributed prices with and different scarcity of consumption (, and ). All simulations in this study are done with and . Even in the case , where consumers buy on average in one of hundred time steps, maximum demands are almost two orders of magnitude larger than the average demand. For rarer consumption (smaller values of ), the distribution of loads clearly gets the shape of a truncated power law with increasing cutoff for , as expected from newman1996 .
The results for different price time series shown on the right of the figure emphasize the robustness of synchronization in our artificial market. The results are shifted for better visibility. On top the result for Gaussian distributed prices with is shown again. Below the same type of price time series with is used with very similar results. Changing the standard deviation of the prices leads to the same dynamics, only with buying events at different typical prices. It is known from sneppen1997 , that using other distributions for the prices does not change the results considerably. The graph below shows the result for the correlated time series of Sec. III (Eq. (3) with and ). The same type of broadly distributed demand emerges. We also tested a real price-like time series by using daily closure values of the Dow Jones (1900-2007, detrended data) with similar results (not shown). In conclusion this means that for our artificial market the synchronization of consumers occurs for very different price time series and can hardly be avoided.
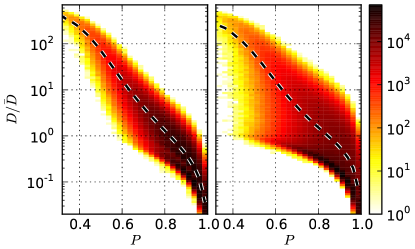
Finally let us discuss the demand curve of the power provider. In Fig. 5 we see a binning of events according to the rescaled demand and price . The counts of events are shown with color values in logarithmic scale. On the left we see the results for uncorrelated prices and . Due to the distribution of prices , events with low prices are generally rare, but if they occur, they lead to high demand.
The average demand for a certain price interval according to this binning is indicated with a dashed line. This is the so-called demand curve frequently used in standard economics to calculate equilibrium prices. The demand spans more than three orders of magnitude within about four standard deviations of the price (we checked that the same holds for the smaller value ). Smooth changes of the price lead to drastic changes of the demand. This is in sharp contrast to standard economics and limits the feasibility of equilibrium prices. Additionally, the demand values span more than an order of magnitude for many price values. This is due to saturation effects (only few agents buy at a low price, if a lower price recently occurred).
In the right panel of Fig. 5, results for the correlated price time series are shown. The demand curve is not changed considerably, while the distribution of demands for certain prices is broadened. Due to saturation effects, consecutive low prices lead to shrinking loads.
V Summary and Outlook
We studied a simple agent based model of an electricity market with variable prices and studied collective effects when consumers aim for lowest prices. In particular we consider consumption with time-flexible execution as, e.g. washing or heating. Time-variable consumption is modeled with a stochastic process for individual highest acceptable prices. As a central quantity, the total demand emerging in our artificial market has been analyzed.
Our main observation is that the rare consumption events of the consumers in the market tend to strongly synchronize at low prices. This leads to peak demands exceeding the average demand by several orders of magnitude. These frequent extreme events account for a considerable part of the average demand over time. We find that high demands occur robustly for different types of price time series, as long as the pricing noise hits the consumers coherently. We find power law distributed demands with large extreme events, both, for uncorrelated price time series as well as for correlated time series. The catastrophic behavior of the system appears to be hardly to prevent.
Finally we question the concept of equilibrium prices in the context of our artificial market. As the system shows an exponential growth of demand when prices drop, equilibrium prices can hardly establish. Demands take on a wide range of values, even at the same price.
While these are results from a statistical physics inspired toy model for an electricity power market with fluctuating energy sources and an adaptive pricing scheme, they may provide a lesson for real markets as well. In particular, they seem to indicate that the, at first sight, brilliant idea to use market mechanisms as a low pass filter for fluctuating electricity sources may not only break down under certain conditions. More importantly they also can lead to catastrophic consequences when a basic prerequisite fails: Breakdown of the central limit theorem when consumers do not act statistically independently.
References
- (1) G. Pepermans, J. Driesen, D. Haeseldonck, R. Belmans, and W. D’haeseleer, Energy Policy 33, 787 (2005).
- (2) J.M. Carrasco, L.G. Franquelo, and J.T. Bialasiewicz, IEEE Trans. Ind. Electron. 53, 1002 (2006).
- (3) F. Blaabjerg, R. Toedorescu, and M. Liserre, IEEE Trans. Ind. Electron. 53, 1398 (2006).
- (4) P. Kundur, Power System Stability and Control (McGraw-Hill, New York, 1994).
- (5) D. Butler, Nature (London) 445, 586 (2007).
- (6) E. Marris, Nature (London) 454, 570 (2008).
- (7) P.B. Luh, Y.-C. Ho, and R. Muralidharan, IEEE Trans. Aut. Control 27, 320-329 (1982).
- (8) H. Allcott, Res. and En. Econom. 33, 820-842 (2011).
- (9) T. Agarwal and S. Cui, in: V. Krishnamurthy, Q. Zhao, M. Huang, Y. Wen (Eds.): Game Theory for Networks - Third International ICST Conference, GameNets 2012: 163-175 Springer (2012).
- (10) M. Roozbehani, M.A. Dahleh, and S.K. Mitter, IEEE Transactions on Power Syst. 27, 1926-1940 (2012).
- (11) A. Kirman, The Economic Journal 99, 126 (1989).
- (12) A.P. Kirman, Quarterly J. Econ. 108 (1993) 137-156.
- (13) D. Challet and Y.-C. Zhang, Physica A 246, 407-418 (1997).
- (14) T. Lux, M. Marchesi, Nature 397 (1999) 498-500.
- (15) D. Sornette, Why Stock Markets Crash: Critical Events in Complex Financial Systems, (Princeton University Press, Princeton, 2004).
- (16) M.E.J. Newman and K. Sneppen, Phys. Rev. E 54, 6226-6231 (1996).
- (17) M.E.J. Newman, Proc. R. Soc. Lond. B 263, 1605 (1996).
- (18) K. Sneppen and M.E.J. Newman, Physica D 110, 209-222 (1997).
- (19) E. Samanidou, E. Zschischang, D. Stauffer, T. Lux, Rep. Prog. Phys. 70 (2007) 409-450.