Cygnus X-1: shedding light on the spectral variability of a black hole
Abstract:
The knowledge of the spectral state of a black hole is essential for the interpretation of data from black holes in terms of their emission models. Based on pointed observations of Cyg X-1 with the Rossi X-ray timing Explorer (RXTE) that are used to classify simultaneous RXTE-ASM observations, we develop a scheme based on RXTE-ASM colors and count rates that can be used to classify all observations of this canonical black hole that were performed between 1996 and 2011. We show that a simple count rate criterion, as used previously, leads to a significantly higher fraction of misclassified observations. This scheme enables us to classify single INTEGRAL-IBIS science windows and to obtain summed spectra for the soft, intermediate and hard state with low contamination by other states.
1 The States of Black Hole Binaries
erlangen.de/proaccretion/
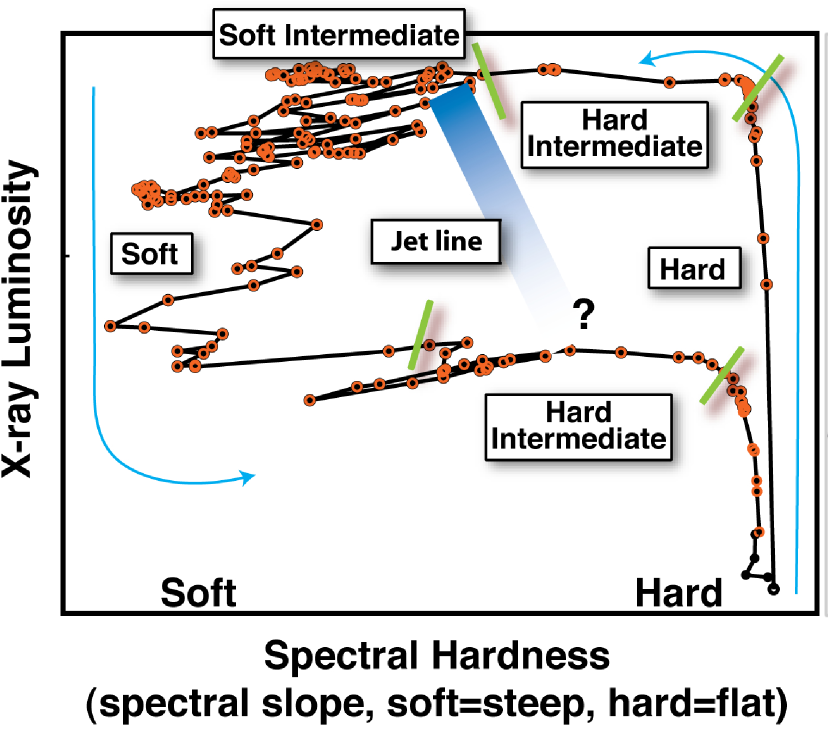
Transient black hole binaries (BHBs) in outburst move on characteristic q-shaped tracks through the hardness-intensity-diagram (HID, Fig. 1): coming from quiescence a source enters the hard state, which is followed by an intermediate state (subdivided into hard intermediate (HIMS) and soft intermediate (SIMS)) and finally the soft state. Then the source returns into a hard state, albeit usually at lower luminosities than previously and finally into quiescence (for a detailed discussion of states see [3, 4, 1]). The individual states are also clearly different in their timing and radio properties. The fact that the soft states show, as opposed to the hard states, no or only quenched radio emission, implies the absence or weakness of the jet. The HIMS to SIMS transition happens close to or at the jet line, where the properties of the jet and therefore the geometry of the source change [4].
2 Cygnus X-1
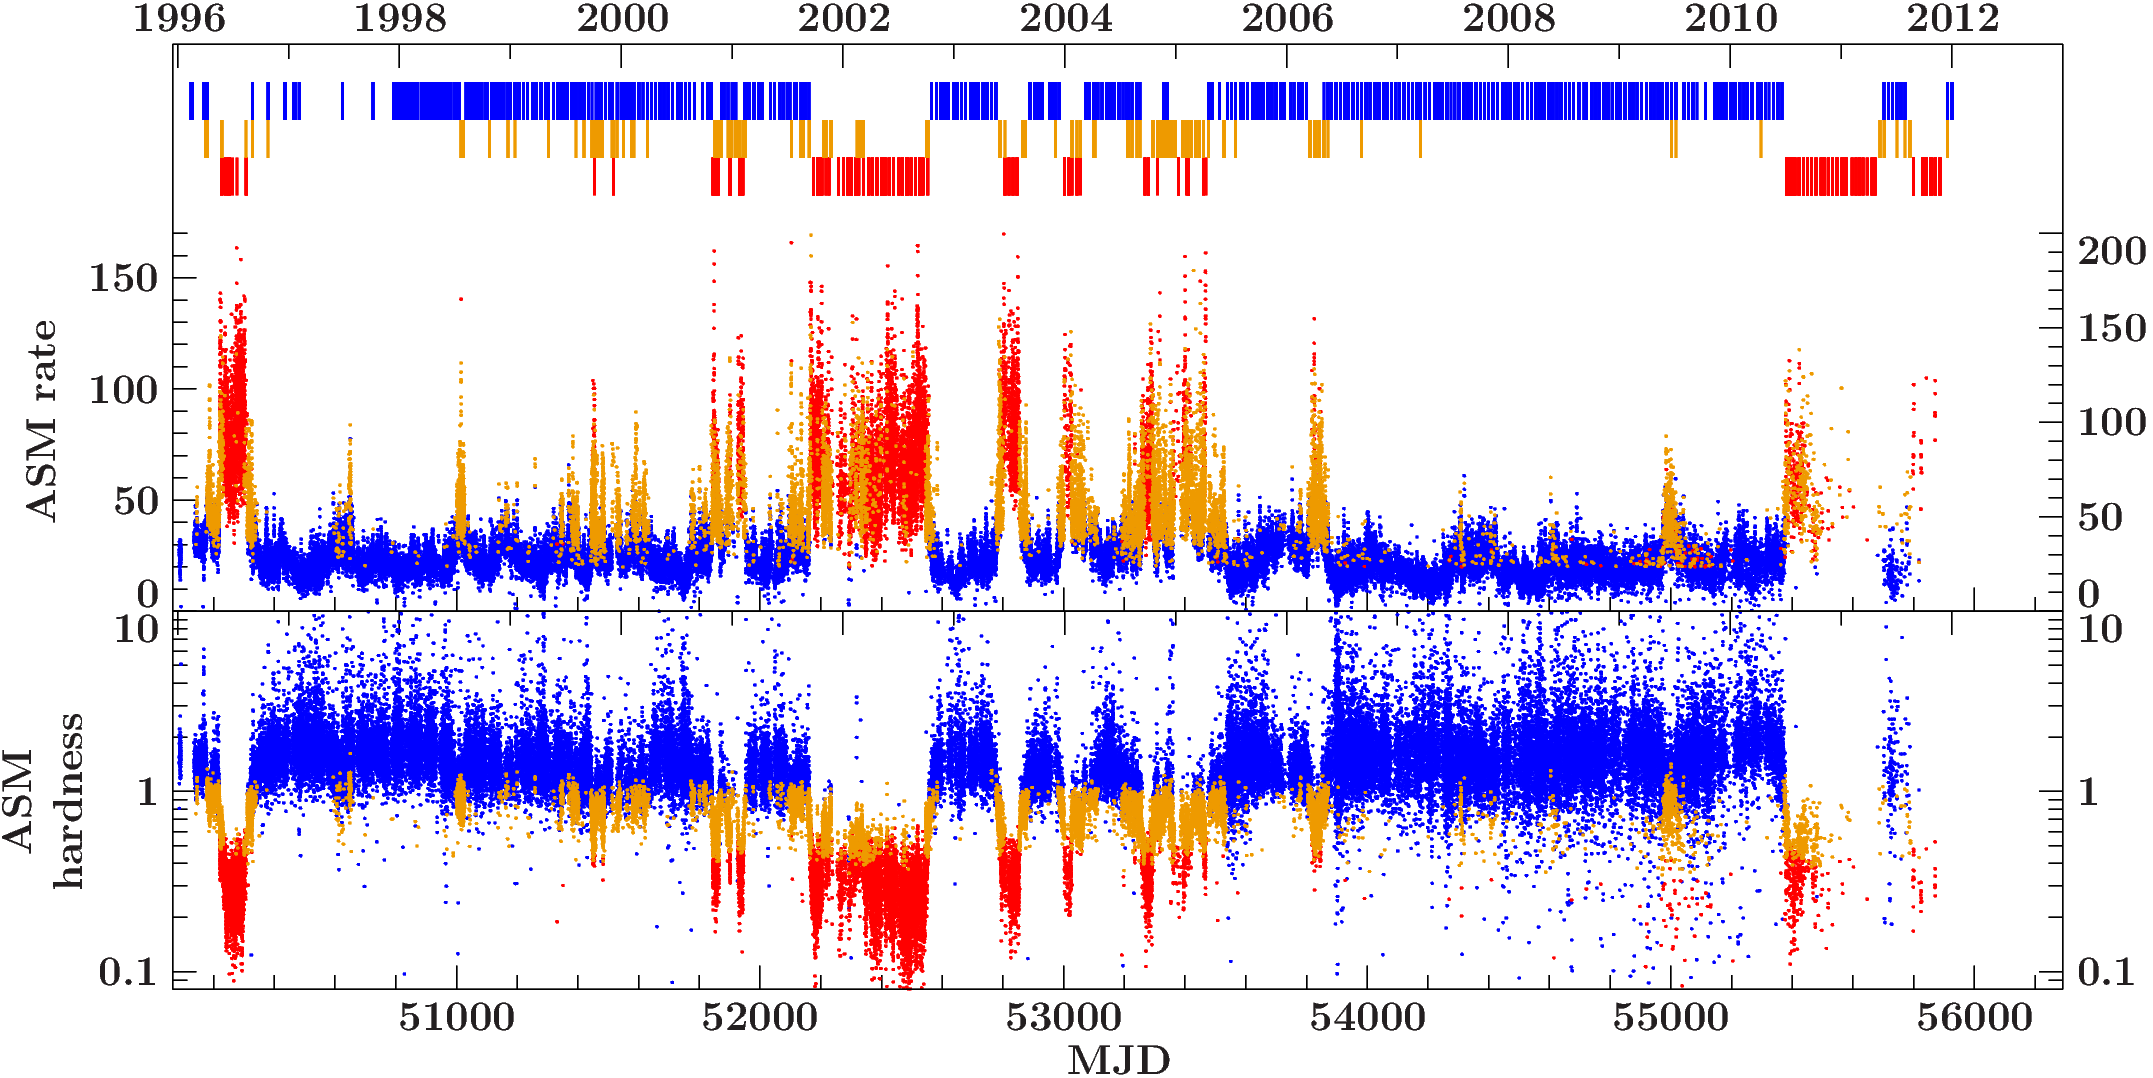
Cyg X-1 is a bright persistent black hole binary that often undergoes (failed) state transitions [9]. That makes it a prime target for both long-term monitoring (e.g., with RXTE, INTEGRAL or Ryle/AMI) and snapshot observations (e.g., with XMM, Chandra or Spitzer). RXTE has observed Cyg X-1 from 1996 to the end of mission in late 2011, largely as a part of our bi-weekly campaign [9, 10]. During this time the source has undergone periods with different source activity patterns, e.g., the long very hard state from mid-2006 to mid-2010 (Fig. 2). State transitions are self-similar on different timescales and can happen as quickly as within a few hours [2].
We extract all available PCA and HEXTE data of the source for every RXTE orbit and obtain 2741 individual spectra which we model with a combination of a broken power law (with a soft photon index , hard photon index , and a break energy keV), an high energy cut off, an iron line and, where required, a thermal disk component. [10] have shown that such a model offers a good description of pointed RXTE observations of Cyg X-1 in all states.
3 ASM-defined states
As a persistent source Cyg X-1 does not follow the usual q-track on the HID, see e.g. [8] and Fig. 4 in this work. The state of the source can best be determined from the slope of the broad X-ray continuum, by modeling, e.g., an RXTE spectrum. A strictly simultaneous RXTE spectrum is, however, not available for an arbitrary observation with a different instrument, such as INTEGRAL, so that state determinations for such observations are challenging and so far often inconclusive.
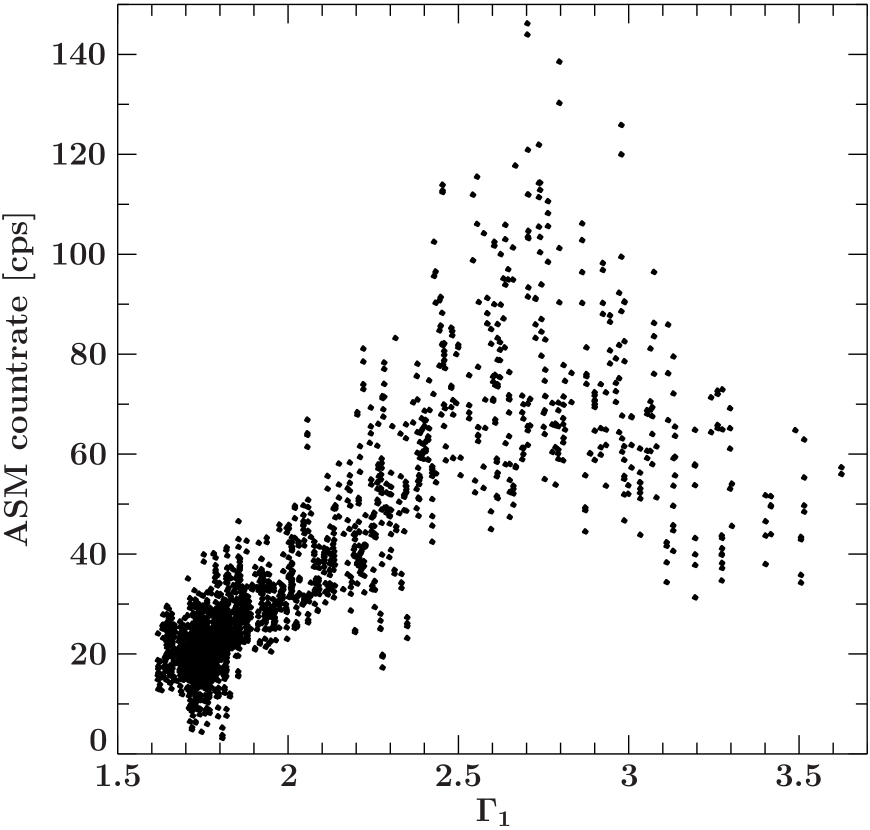
Usual simple state definitions use the RXTE-ASM data by setting thresholds in either ASM rate or hardness. For example, [10] obtain state estimates by defining the ASM count rate below 45 cps as a hard state and above 80 cps as soft state. We analyze the 2400 (good, i.e., filtered for negative count rates and times of instrumental problems) ASM measurements which are strictly simultaneous to RXTE observations and show that this approach, while good as a rough guide, fails to account for the decrease in ASM rate for the softest observations (Fig. 3, left panel).
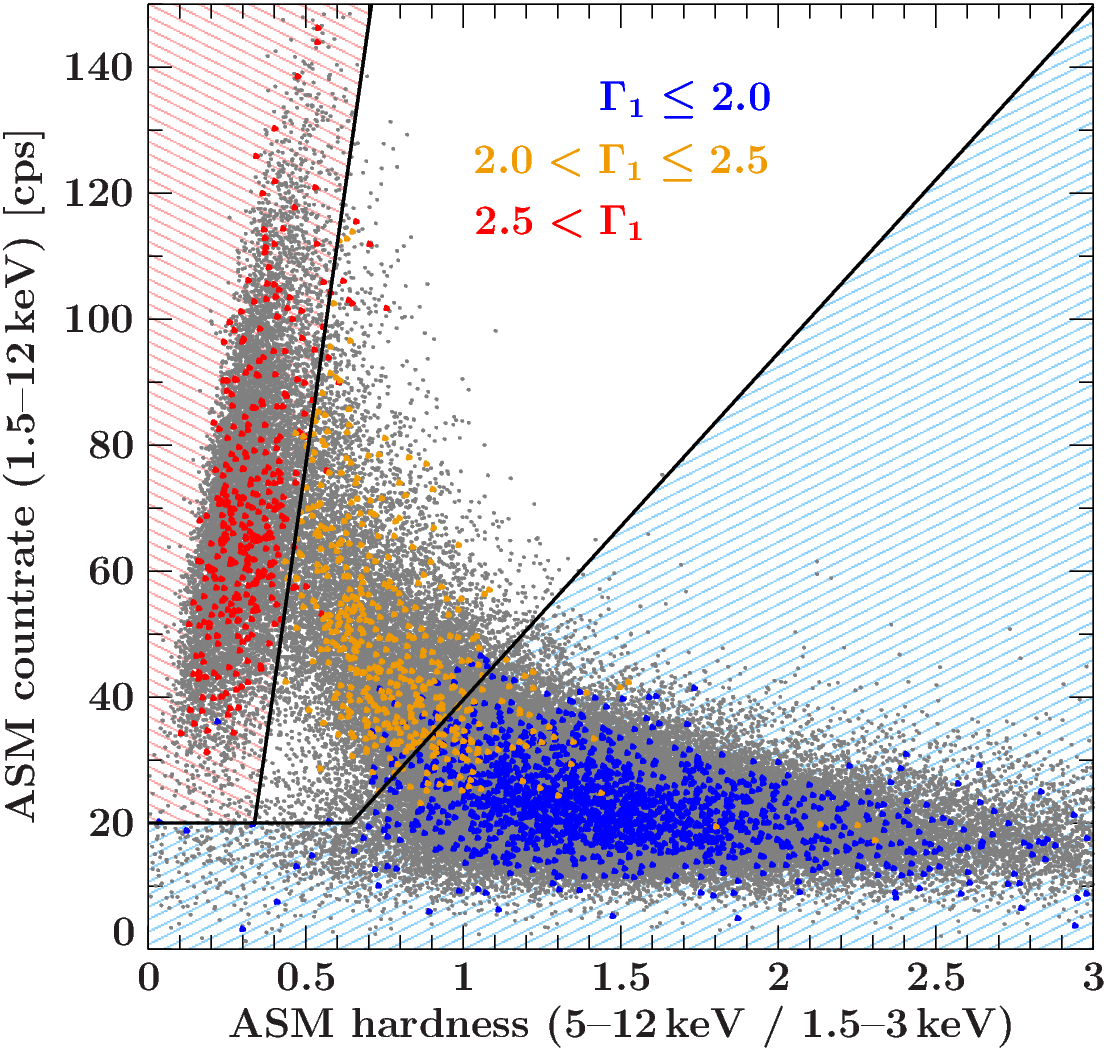
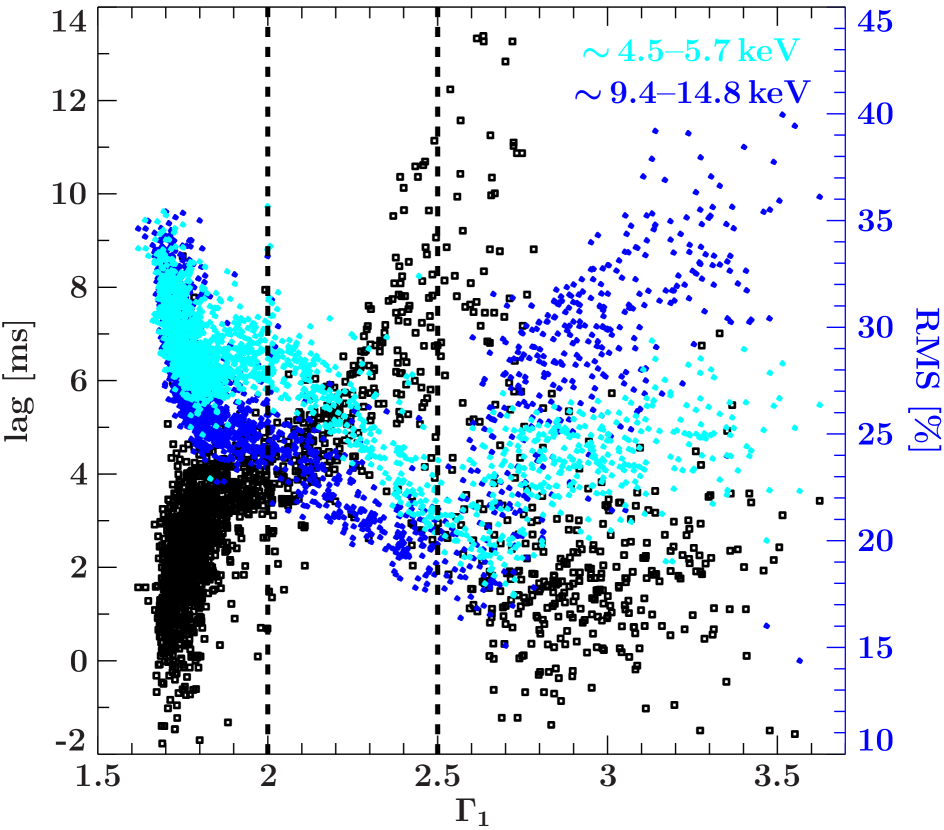
To define RXTE states based on , we consider the existence of the disk component, which is preferentially required for modeling those spectra where , and dependence of the timing properties of the individual RXTE observations on . X-ray time lag and fractional rms (Fig. 3, right panel) are calculated following [7] using the same energy and frequency bands as [2]. We define that Cyg X-1 is in hard state if , in the intermediate state if and in the soft state if . The corresponding measurements are shown in color on the HID in Fig. 4 over the total ASM measurements shown in gray. The three -defined states populate different regions of the total Cyg X-1 ASM HID.
Finally we define ASM states by introducing cuts in the hardness-rate space that minimize the contamination of the ASM defined states by non-corresponding RXTE states. Every measurement with a count rate cps is defined as hard independent of the hardness . Otherwise the cuts are defined by , with , , . The probability of obtaining a misclassification is below 5% for the hard, 10% for the intermediate and 3% for the soft state for strictly simultaneous data. A graphical representation of the cuts is given in Fig. 4.
4 INTEGRAL/IBIS spectra
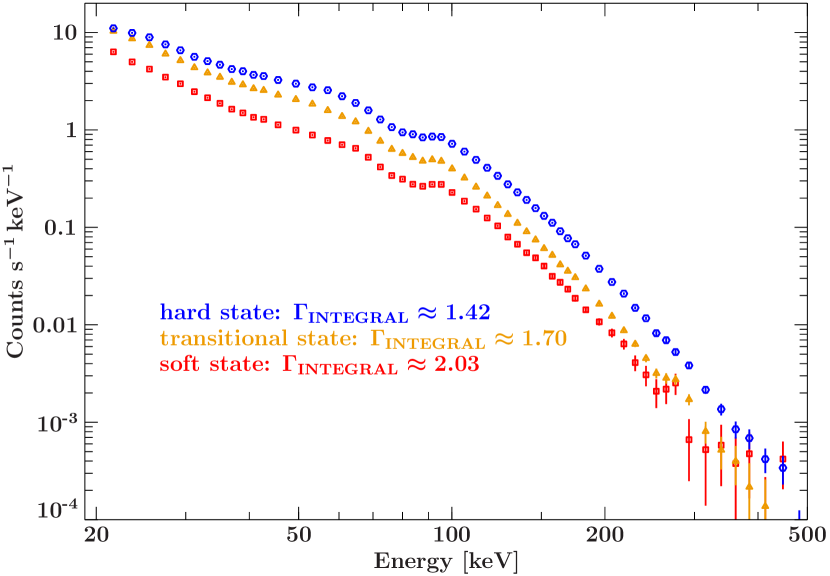
As a proof of concept, we apply a earlier version of the developed ASM classification on all INTEGRAL-IBIS data of Cyg X-1 up to and including 2010. Each individual INTEGRAL science window is classified by the closest ASM measurement. We add same state science windows and obtain state resolved spectra with an exposure of 1.8 Ms for the hard state, 1.3 Ms for the intermediate state and 0.5 Ms for the soft state, which we model with a simple exponentially cut off power law model with photon index , since INTEGRAL-IBIS data start well above the spectral break seen in the pointed RXTE observations at 10 keV. Figure 5 shows that we can clearly distinguish the different spectral shapes of the three states with this approach.
5 Summary and Outlook
We have developed a novel ASM based classification scheme for the states of Cyg X-1 which can be used both for campaigns (e.g., with INTEGRAL) and for individual observations (e.g., with XMM, Chandra or Spitzer). A detailed discussion of the ASM classification will be presented in an upcoming paper (Grinberg et al., A&A submitted), where the feasibility to use Swift-BAT, MAXI and Femi-GBM data to classify observations made after the demise of RXTE is also discussed. We will apply the classification to INTEGRAL data to perform, e.g., state-dependent polarization analysis (see [6] for the first detection of polarization in Cyg X-1).
Acknowledgments.
This work has been partially funded by the Bundesministerium für Wirtschaft und Technologie under Deutsches Zentrum für Luft- und Raumfahrt Grants 50 OR 1007 and 50 OR 1113 and by the European Commission through ITN 215212 “Black Hole Universe”, was partially completed by LLNL under Contract DE-AC52-07NA27344. K.P. and D.M.M. acknowledge support from NASA grant NNX09AT28G for INTEGRAL’s Cycle 7 Guest Observer Programme. The data analysis presented in this work was performed with ISIS 1.6.2 [5]. We thank John E. Davis for the development of the slxfig module used to prepare all figures in this work.References
- [1] Belloni T.M., 2010, In: T. Belloni (ed.) Lecture Notes in Physics, Berlin Springer Verlag, Vol. 794. Lecture Notes in Physics, Berlin Springer Verlag, p. 53
- [2] Böck M., Grinberg V., Pottschmidt K., et al., 2011, A&A 533, A8
- [3] Fender R.P., Belloni T.M., Gallo E., 2004, MNRAS 355, 1105
- [4] Fender R.P., Homan J., Belloni T.M., 2009, MNRAS 396, 1370
- [5] Houck J.C., Denicola L.A., 2000, In: N. Manset, C. Veillet, & D. Crabtree (ed.) Astronomical Data Analysis Software and Systems IX. ASP Conf. Ser. 216, p. 591
- [6] Laurent P., Rodriguez J., Wilms J., 2011, Science 332, 438
- [7] Nowak M.A., Vaughan B.A., Wilms J., et al., 1999, ApJ 510, 874
- [8] Nowak M.A., Wilms J., Hanke M., et al., 2012, Mem. S.A.It. 83, 202
- [9] Pottschmidt K., Wilms J., Nowak M.A., et al., 2003, A&A 407, 1039
- [10] Wilms J., Nowak M.A., Pottschmidt K., et al., 2006, A&A 447, 245