UV/Optical/IR Color Sequences Along the Tidal Ring/Arm of Arp 107
Abstract
We construct UV/optical/IR spectral energy distributions for 29 star forming regions in the interacting galaxy Arp 107, using GALEX UV, Sloan Digitized Sky Survey optical, and Spitzer infrared images. In an earlier study utilizing only the Spitzer data, we found a sequence in the mid-infrared colors of star-forming knots along the strong tidal arm in this system. In the current study, we find sequences in the UV/optical colors along the tidal arm that mirror those in the mid-infrared, with blue UV/optical colors found for regions that are red in the mid-infrared, and vice versa. With single-burst stellar population synthesis models, we find a sequence in the average stellar age along this arm, with younger stars preferentially located further out in the arm. Models that allow two populations of different ages and dust attenuations suggest that there may be both a young component and an older population present in these regions. Thus the observed color sequences may be better interpreted as a sequence in the relative proportion of young and old stars along the arm, with a larger fraction of young stars near the end. Comparison with star forming regions in other interacting galaxies shows that the Arp 107 regions are relatively quiescent, with less intense star formation than in many other systems.
1 Introduction
Close encounters and collisions between galaxies can dramatically alter their morphologies. Depending upon the parameters of the interaction, such encounters can produce a wide variety of structures including long tails, bridges, and collisional rings (see Struck, 1999 and Duc & Renaud, 2011 for reviews). Interactions can also trigger the formation of new stars, enhancing the overall rates of star formation (Bushouse, 1987; Kennicutt et al., 1987; Bushouse, Lamb, & Werner, 1988; Barton, Geller, & Kenyon, 2000; Barton Gillespie, Geller, & Kenyon, 2003; Smith et al., 2007). The star formation in interacting galaxies is often quite centrally-concentrated (e.g., Lonsdale, Persson, & Matthews, 1984; Keel et al., 1985; Smith et al., 2007), however, tidal features frequently have on-going star formation as well (e.g., Schweizer, 1978; Schombert, Wallin, & Struck-Marcell, 1990; Smith et al., 2010). In some systems, massive concentrations of stars and gas (‘tidal dwarf galaxies’) are present near the ends of tails (Duc et al., 1997, 2000; Smith et al., 2010). Along tidal features regularly-spaced knots of star formation (‘beads on a string’) are sometimes seen (Hancock et al., 2007; Smith et al., 2010), likely caused by local gravitational instabilities (Elmegreen & Efremov, 1996). Very luminous star forming regions are also sometimes found at the base of tidal features, the so-called ‘hinge clumps’ (Hancock et al., 2009; Smith et al., 2010). These may be produced by intersecting caustics, where a caustic is a narrow pile-up zone caused by orbit-crossing in interacting systems (Struck & Smith, 2012). Gas flows between galaxies in interacting pairs can also sometimes trigger star formation in polar rings or unusual tail-like structures (Bournaud & Combes, 2003; Struck & Smith, 2003; Smith et al., 2008).
In the current paper, we investigate star formation processes within the interacting galaxy pair Arp 107. Arp 107 is one of about three dozen nearby pre-merger interacting galaxies in the ‘Spirals, Bridges, and Tails’ (SB&T) sample, for which we have acquired Spitzer IR and Galaxy Evolution Explorer (GALEX) ultraviolet images. We have conducted statistical analyses of the complete sample of SB&T galaxies, comparing with optical data and with control samples of normal galaxies (Smith et al. 2007, 2010; Smith & Struck 2010). We have also conducted detailed spatially-resolved studies of several individual galaxies in the sample, comparing with numerical simulations of the interactions (Smith et al. 2005, 2008; Hancock et al. 2007, 2009; Peterson et al. 2009). The current paper is a followup to an earlier study, in which we used Spitzer mid-infrared images (3.6 m, 4.5 m, 5.8 m, 8.0 m, and 24 m) and a ground-based H image to investigate star formation in Arp 107 (Smith et al. 2005, hereafter Paper I).
In the Arp (1966) Atlas optical photograph, Arp 107 is characterized by a strong spiral arm in the southern part of the larger galaxy, a tidal tail to the northwest, and a bridge towards a small elliptical companion in the northeast. The larger galaxy in the pair has a Seyfert 2 nucleus (Keel et al., 1985). In the Spitzer images, prominent knots of star formation are visible to the north and northwest; in combination with the spiral arm to the south this produces a ring-like appearance in the mid-infrared (Paper I). In Paper I, we presented a numerical simulation of the Arp 107 interaction, which demonstrated that Arp 107 is the product of an off-center collision, with parameters between those of a collisional ring and a prograde tidal encounter. In our earlier study, we found a clear azimuthal sequence in the mid-infrared [3.6 m] [8.0 m] and [4.5 m] [5.8 m] colors along the arm/ring. Assuming that the 3.6 m and 4.5 m bands are rough tracers of the older stellar population and the 5.8 m and 8.0 m emission is dominated by interstellar particles heated by young stars, these color sequences suggest a sequence in the ages of the stars along the arm/ring, or, alternatively, in the relative amounts of young and old stars. In Paper I, we suggested that the pattern of stellar ages around the spiral arm may be due to differences in the time of maximum compression in the spiral arm.
In the current paper, we further investigate star formation along the tidal arm of Arp 107, by adding UV and optical images to this analysis. The hybrid morphology of this structure, between a collisional ring and a tidal tail, strongly constrains its origin and evolution, and therefore it provides a good laboratory to study star formation triggering. Throughout this paper, we assume a distance of 138 Mpc for Arp 107, using = 75 km s-1 Mpc-1. In Section 2 of this paper, we describe the datasets, and in Section 3 we describe the photometry. In Section 4, we look at UV/optical/IR spectral energy distribution (SED) plots for star-forming regions within Arp 107. In Section 5, we plot the UV/optical/IR colors against position angle around the ring/arm. In Section 6, we use single-burst stellar population synthesis models to estimate stellar ages and attenuations in these clumps. We plot these ages against azimuthal angle around the ring in Section 7. In Section 8, we explore two-component population synthesis models, while in Section 9, we investigate the diffuse starlight in the ring. A comparison is made to numerical simulations of the encounter in Section 10. In Section 11, we compare with results for other galaxies, and summarize the results in Section 12.
2 Data and Morphology
In the current paper, we utilize GALEX111http:galexgi.gsfc.nasa.govdocsgalex far-ultraviolet (FUV) and near-ultraviolet (NUV) images and Sloan Digitized Sky Survey (SDSS222http:www.sdss.orglinks.html) ugriz optical images of Arp 107. These images were previously presented in a survey paper of the full SB&T sample (Smith et al., 2010). The GALEX images have a pixel size of 15 and a circular field of view with a diameter of 1.2 degrees. The NUV band covers 1750 2800 Å, while the FUV band covers 1350 1705 Å. The total GALEX exposure time in the NUV band was 2610 seconds, and in the FUV band it was 1094 seconds (Smith et al., 2010). The spatial resolution of the GALEX images is approximately 5′′. The SDSS images have a pixel size of 04, a field of view of 135 98, and a point spread function (PSF) full width half maximum (FWHM) of 13. The SDSS u, g, r, i, and z filters have effective wavelengths 3560, 4680, 6180, 7500, and 8870 Å, respectively. Further details on the GALEX and SDSS observations and data are available in Smith et al. (2010).
As described in Paper I, the Spitzer333http:ssc.spitzer.caltech.edu data consists of Infrared Array Camera (IRAC) images in the 3.6, 4.5, 5.8, and 8.0 m broadband filters, as well as a Multiband Imaging Photometer (MIPS) image in the 24 m broadband filter. The IRAC images have pixel sizes of 12 and a field of view of 90 148, while the MIPS image has a field of view of 74 81 and a pixel size of 245. The FWHM PSF is 17 20 for the IRAC images and 6′′ for the 24 m image. The H image was obtained with the 0.6 m Erwin Fick Telescope in Boone, Iowa. It has a field of view of 179 179, and a pixel size of 105. Further details on these data are available in Paper I.
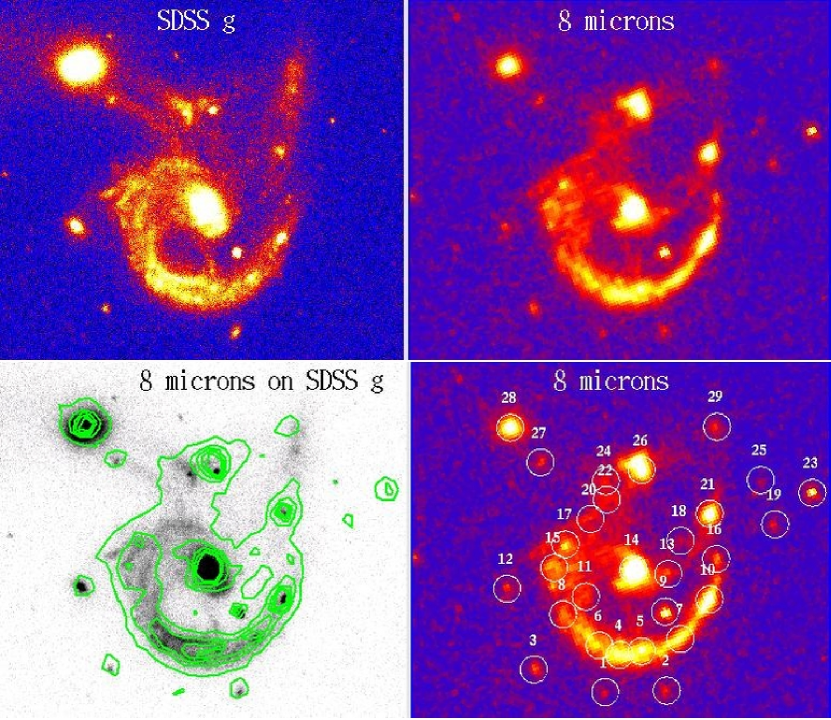
The SDSS g band optical image of Arp 107 is presented in Figure 1 (upper left panel), along with the Spitzer 8 m image (upper right panel). An overlay of the Spitzer 8 m image on the g image is also provided in Figure 1 (lower left panel). From the available images, it is unclear whether the tail to the northwest is a continuation of the southern arm, or whether it is part of another arm. In the optical images, there is a bend where the southern arm connects to the tail. The bend may be due to the tail warping out of the plane of the disk; alternatively, it may be due to the tail originating from elsewhere in the system rather than the southern arm. In the 8 m image, there is faint arm-like structure extending westward out from the nucleus towards the tail. The tail may be the extension of this second arm rather than of the southern arm. Velocity maps may provide useful information about this issue.
At the base of the strong arm in the east there are several filamentary structures extending to the east visible in the SDSS images. The bridge connecting the two galaxies appears double in the SDSS images, as does the southern portion of the ring. The ‘double’ structure of the southern ring is also visible in the lower resolution 3.6 m Spitzer image.
3 Photometry
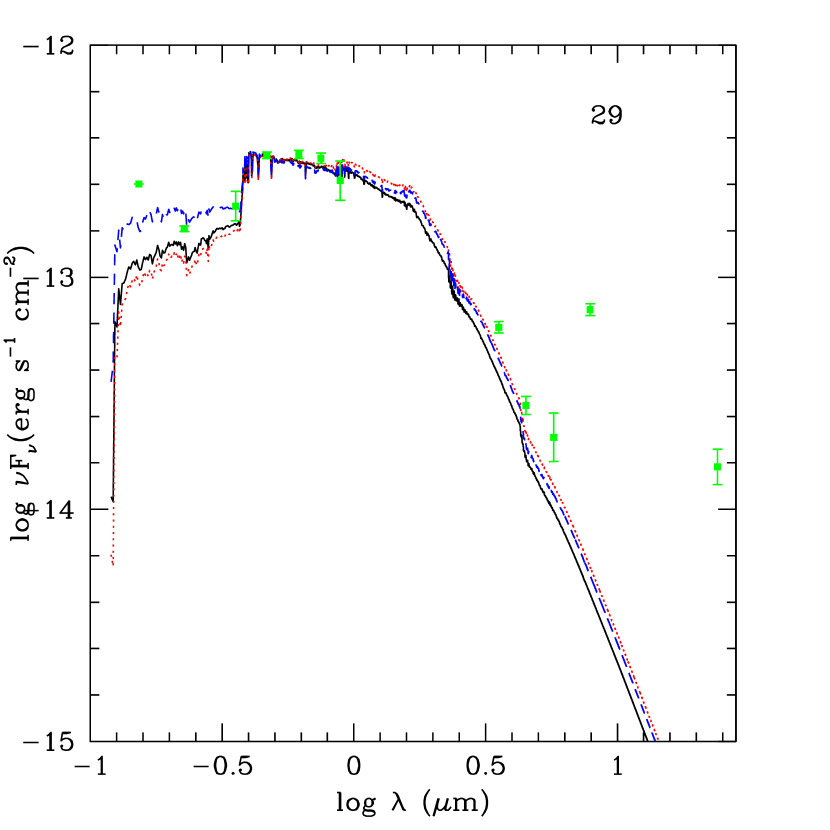
In Paper I, we identified 29 ‘clumps’ of emission in and near Arp 107 using the Spitzer 8 m image. These clumps are labeled in the lower right panel of Figure 1. Coordinates of these clumps are given in Paper I. These are mainly knots of star formation in the Arp 107 system, but also include the two galactic nuclei, some likely background objects, and a known foreground star. Some of these clumps also show up as discrete knots in the SDSS images (clumps 5, 7, 10, 17, 21, 26, and 27), while some do not (clumps 4, 6, 8, 15, and 29). Clump 24 in the north lies about 5′′ east of a bright optical source. Clump 29, near the end of the tail, does not have a discrete optical counterpart, however, an optical knot is visible about 10′′ further south in the tail that does not have an 8 m counterpart. Clump 21 lies at the ‘bend’ in the arm, where it intersects with the tail. In the H map presented in Paper I, only the brightest knots in the ring were reliably detected (clumps 4, 5, 7, 10, 16, 21, and 26), with a calibration uncertainty of 30%.
In Paper I, we presented Spitzer and H photometry of these 29 clumps. We now provide GALEX UV and SDSS optical measurements as well. The aperture photometry was done with the IRAF444Image Reduction and Analysis Facility; http:iraf.noao.edu phot command, using an aperture radius of 5′′. We used a sky annulus with the mode sky fitting algorithm, an inner radius of 6′′, and an outer radius of 18′′. Aperture corrections were done manually for the GALEX and SDSS images by taking counts of four moderately bright point sources in the field and slowly increasing the radius until the counts leveled off. For the FUV and NUV wavelengths the aperture corrections were multiplicative factors of 1.64 0.19 and 1.37 0.10, respectively. The SDSS filters were found to need no aperture corrections. The SDSS photometry was corrected for Galactic reddening as in Schlafly & Finkbeiner (2011), as provided by the NASA Extragalactic Database (NED555http://ned.ipac.caltech.edu). These corrections are very small (E(B V) = 0.025; E(g r) = 0.029). The GALEX photometry was corrected for Galactic reddening using the Cardelli, Clayton, & Mathis (1989) attenuation law, which gives E(FUV NUV) = 0.0044 and E(NUV g) = 0.096; alternative laws (Fitzpatrick, 1999; Seibert et al., 2005; Yuan, Liu, & Xiang, 2013) give values that differ by 0.1 magnitudes. The final corrected photometry is given in Table 1. Only statistical uncertainties from the IRAF phot routine are included in Table 1; the quoted values do not include errors in the background determination, in calibration, and in the aperture corrections.
As a test of this photometry, we obtained colors for a 104 257 rectangular region on the southern portion of the ring containing clumps 4, 5, and 6. For sky subtraction, we used sky values obtained from multiple rectangular regions far from the galaxies. These three clumps are relatively crowded, thus would be the most likely to have problems with the photometry. The colors for this rectangular region are consistent within the uncertainties with those of the three clumps, with the exception of the NUV g color which is 0.5 magnitudes redder. This is likely due to the inclusion of some diffuse interclump emission in the rectangular region, since the interclump light is considerably redder in this color than the clumps (see Section 9).
4 SED Plots
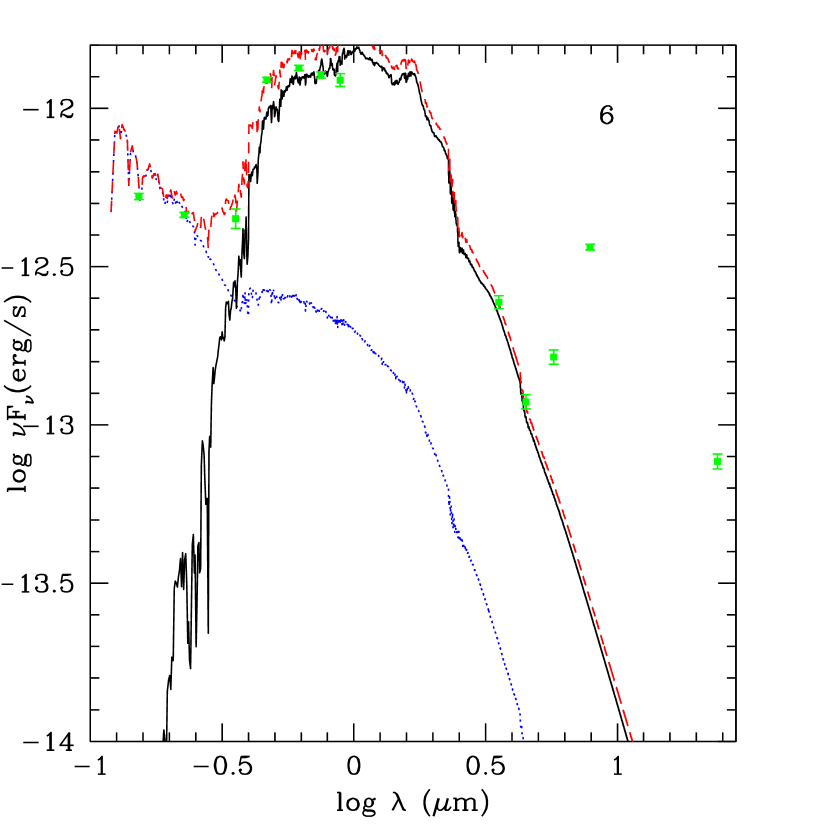
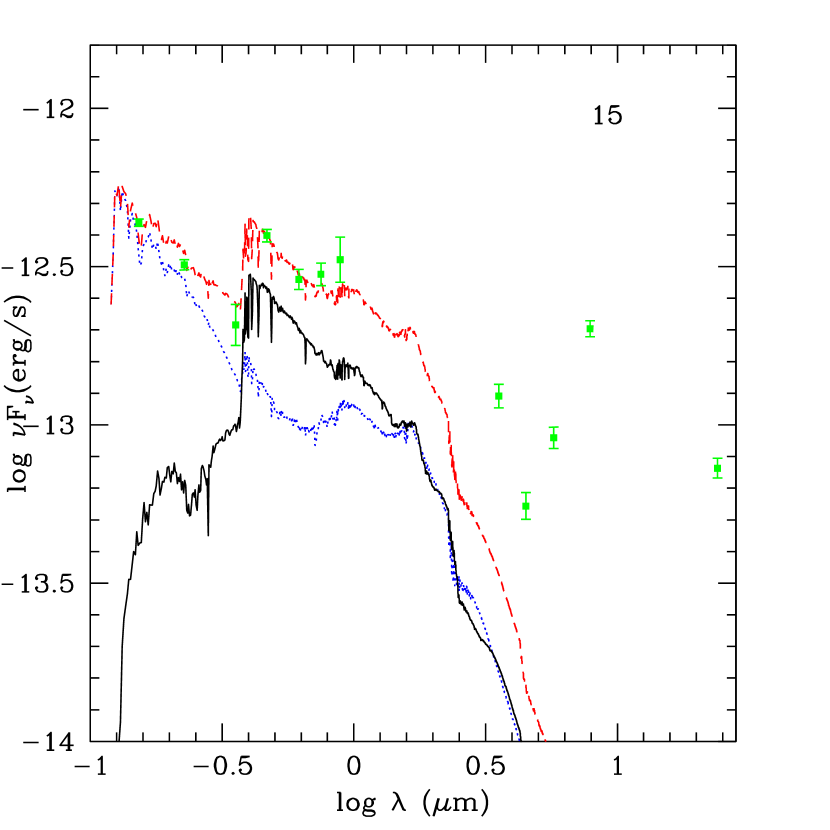
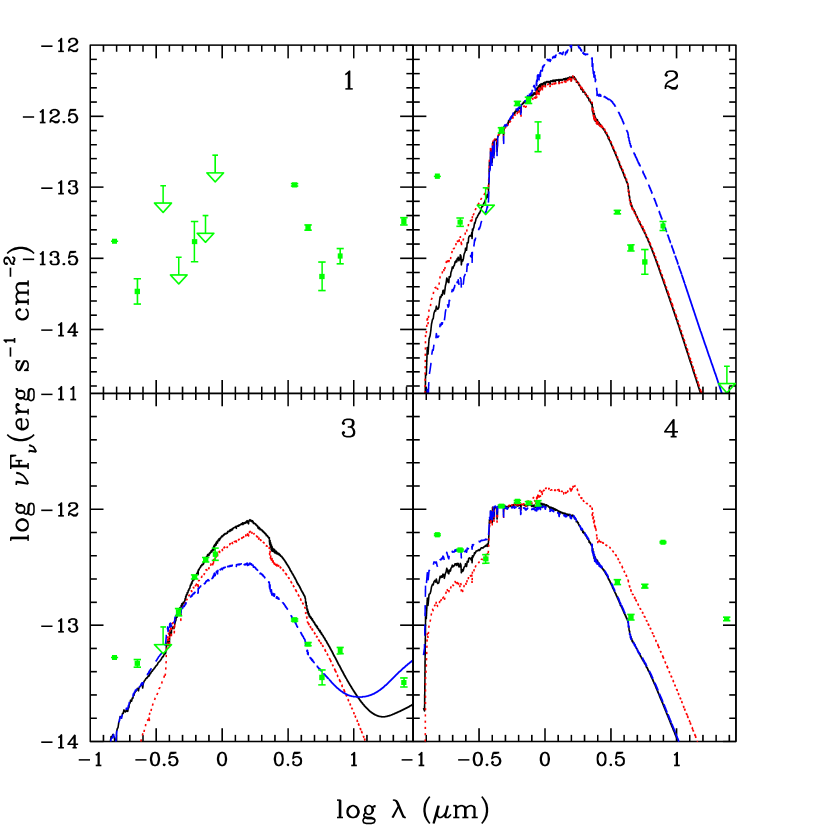
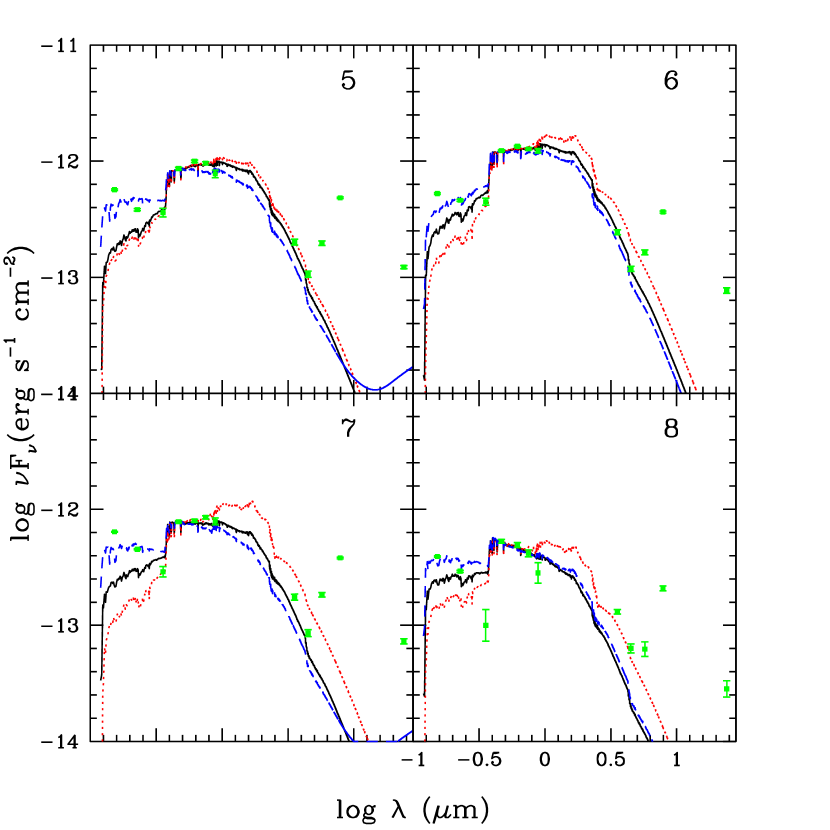
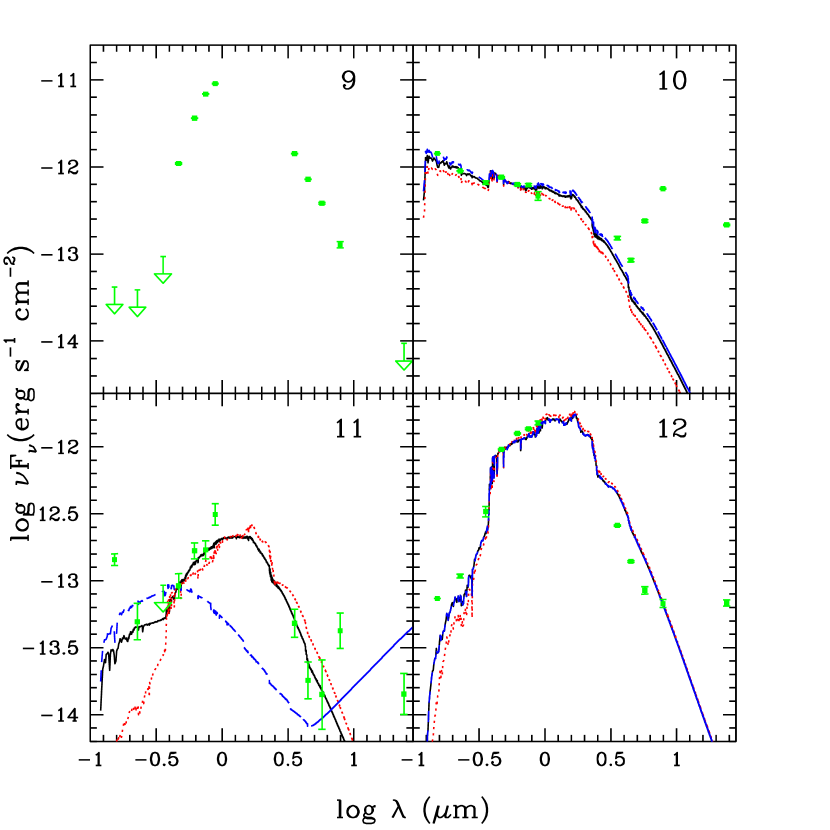
For each of the 29 clumps, we created UV/optical/IR spectral energy distribution (SED) plots, in units of erg s-1 cm-2 (Fν). These are provided in the Appendix of this paper (Figures 13 20). Such plots help to categorize the clumps into two main groups, those with evidence of recent active star formation, or starbursts, and those with a more quiescent profile indicative of an older stellar population. A quiescent distribution has an approximately blackbody curve from the combined light of the stars, smoothly sloping up from lower UV values through the optical, peaking at 1 2 m, then smoothly sloping down towards the mid-infrared. A starburst profile shows excess emission in the UV and mid-infrared above the curve for an older stellar population. The excess in the 5.8, 8.0, and 24 m filters originates from interstellar grains and molecules heated mainly by young stars. Excess emission in the UV is from recently formed hot stars.
In this paper, we focus mainly on the clumps within the ring/arm. However, for comparison, in the Appendix we provide SED plots for the other clumps as well, some of which may not be associated with Arp 107. As mentioned in Paper I, Clump 9, which lies inside of the ring, has an optical spectrum indicative of a foreground star, and its redshift shows it is not part of Arp 107 (W. Keel 2005, private communication). As discussed in Paper I, Clumps 19 and 23, to the west of the system, have mid-infrared colors similar to that of quasars, thus may be background objects. The UV/optical/IR SED of Clump 23 (Figure 18) is roughly a power law, inconsistent with that of a star formation region but supporting its identification as a background quasar. The SED of Clump 19 is inconclusive (Figure 17).
With the exception of clump 20, which is ambiguous, the SED plots of all of the ring clumps are consistent with on-going star formation. In contrast, the nucleus of the companion (Clump 28) has a SED profile indicating an older stellar population. The SED of the nucleus of the primary galaxy (Clump 14) also suggests an older stellar population, but with some UV and mid-infrared excess, perhaps powered in part by the Seyfert nucleus.
Outside of the ring, clumps 24 and 29 have star-forming SEDs. Clump 29 lies near the tip of the northwestern tail, thus is likely part of Arp 107, while Clump 24 may be either a knot associated with Arp 107 or a background galaxy. Clumps 12 and 25, also outside the ring, have relatively quiescent SEDs, suggesting that they might be faint foreground stars like Clump 9, however, clump 12 appears somewhat extended in the SDSS images, with a FWHM of 16, compared to 13 for stars in the field and Clump 9 and 25. Clumps 2, 3, and 27, also outside of the ring, have relatively quiescent UV/optical SEDs, but with possible 8 m excesses. Inside the ring, Clumps 11, 13, and 18 have star-forming SEDs. Clumps 1 and 18 were detected in too few filters to classify.
As seen in Figures 13 20, for most of the clumps the SED drops between 8 m and 24 m, implying relatively quiescent interstellar radiation fields (ISRFs). In general, the stronger the ultraviolet ISRF, the higher the 24 m emission compared to that at 8 m (Li & Draine, 2001; Peeters, Spoon, & Tielens, 2004; Lebouteiller et al., 2011). The 24 m emission arises mostly from ‘very small interstellar dust grains’ (VSGs) heated predominantly by UV light from O stars (e.g., Li & Draine, 2001). The 8 m Spitzer band contains emission from both very small dust grains and polycyclic aromatic hydrocarbons (PAHs). Since PAHs may be excited by non-ionizing photons as well, the 8 m emission may be powered in part by lower mass stars (Peeters, Spoon, & Tielens, 2004; Calzetti et al., 2007; Lebouteiller et al., 2011). The [8.0] [24] colors for the clumps in the Arp 107 ring are less than 2.5 (Paper I), implying an ISRF less than or equal to about 10 times that in the solar neighborhood (Li & Draine, 2001). As noted in Paper I, the 5 8 m surface brightness in the Arp 107 disk clumps is a relatively low value of about 10 Lpc-2, implying an ISRF approximately twice that of the solar neighborhood. In contrast, for clump 14 (the Seyfert nucleus), the SED increases strongly between 8 and 24 m, likely due to heating by the active nucleus.
The SEDs and their best-fit population synthesis models are discussed further in Sections 6 and 8.
5 Position Angle vs. Color Along the Arm
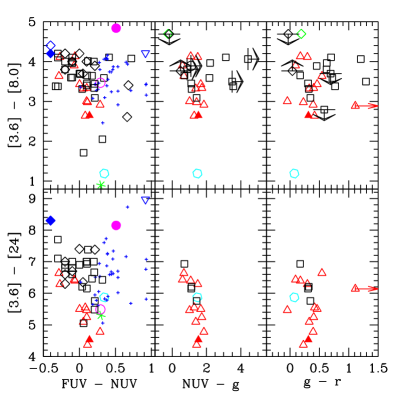
In this section, we focus on the UV/optical/IR colors for the clumps along the arm/ring. In Figures 2 and 3, we plot various UV/optical/IR colors as a function of position angle along the arm. Note that these plots include clump 26 in the north near the bridge, which may not be part of the primary arm. As shown previously in Paper I, there is a sequence in [3.6] [8.0] around the ring (see top panel left in Figure 2). The [3.6] [8.0] color is lowest (bluest) in the east (PA = 20∘ 160∘), increases towards the south (PA = 180∘ 200∘; clumps 4, 5, and 7), and is highest (reddest) in the west and northwest (PA = 240∘ 340∘; clumps 10, 16, 21, and 26). In Paper I, we interpreted this sequence as a sequence in the proportion of young stars (as traced by the 8 m band) relative to the older stellar population (as measured by 3.6 m). A similar trend is seen in the [3.6] [24] color (top panel on right in Figure 2), except that the clumps to the northeast (PA = 20∘ 80∘; clumps 15, 17, and 22) are redder than those in the south (PA = 120∘ 220∘).
In Figure 2, we also provide the apparent 3.6 m magnitude around the ring (bottom right panel). Assuming that the 3.6 m emission is a rough estimate of stellar mass, the clumps have relatively constant stellar mass, with the exception of the fainter clumps 16, 20, and 22, and the slightly brighter clumps 4, 5, and 6 to the south. The apparent 24 m magnitude is also plotted in Figure 2 (second panel from the bottom on the right). This gives an approximate measure of the star formation rate in each clump. There is a very rough correlation of 24 m luminosity (i.e., apparent magnitude) with azimuthal angle, but with a lot of scatter. Clumps 10, 21, and 26 in the west and north have the highest star formation rates in the ring.
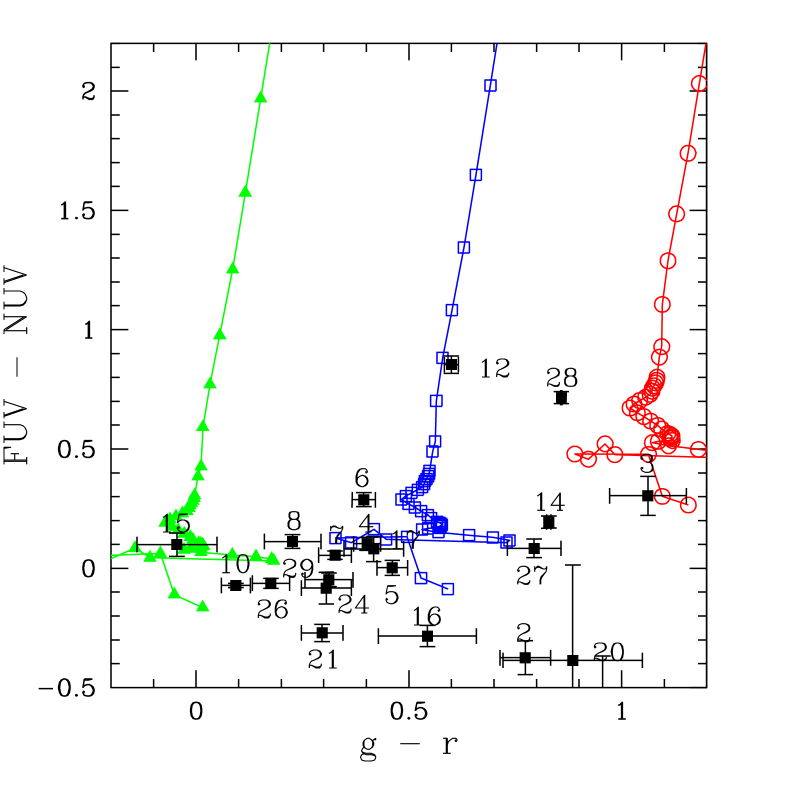
In FUV NUV and u g (Figure 2, bottom panel left and second panel right), the trend seen in the mid-infrared colors is reversed, with bluer optical colors for the clumps with redder [3.6] [8.0] colors, and vice versa. In NUV g and g r (Figure 2, second and third panels on left), the southern clumps are again somewhat redder than the clumps in the west and northwest, but there is more scatter. As with the IR colors, the UV/optical colors suggest either a sequence in age around the ring, or, alternatively, a sequence in the relative proportion of young and old stars.
The UV/optical colors, however, are affected by dust attenuation as well as age. To get an estimate of how the dust attenuation varies around the ring, in Figure 3 we plot various tracers of dust attenuation against position angle around the ring. In the top panel we have plotted the H to 8 m luminosity ratio, while the second panel gives LHα/L24μm against position angle. We have used the definition luminosity L = Fν for the Spitzer bands. The lower two panels in Figure 3 show FUV [8.0] and FUV [24] against position angle. The luminosities in the FUV, H, 8 m, and 24 m bands are all approximate tracers of young stars, with caveats. The FUV and H fluxes are also affected by dust attenuation. These tracers are also sensitive to the age of the stars. The FUV is sensitive to both young and intermediate age stars (100 Myrs), while H traces younger stars (10 Myrs). As noted earlier, the 8 m band may be powered in part by older stars as well.
All four tracers of dust attenuation indicate that the knots in the northwest (clumps 21 and 26, PA = 300∘ 360∘) have higher dust attenuations than the clumps in the west (clumps 10 and 16). The clumps in the south (clumps, 4, 5, and 6 near PA 180∘), are also more extincted than those in the west (clumps 10 and 16). In comparing the southern clumps (clumps 4, 5, and 6) with the northwest clumps (clumps 21 and 26), there are inconsistencies between the different tracers of dust attenuation. The southern clumps have lower H to mid-infrared ratios than those in the northwest, indicating more dust attenuation, but bluer FUV mid-infrared colors. This suggests some contributions from intermediate age stars to the observed UV light of the southern clumps, causing them to be blue in FUV mid-infrared in spite of their relatively low H to mid-infrared ratios. We return to this point in Sections 6 and 8.
6 Population Synthesis: Single-Burst Instantaneous Models
We next compared the UV/optical colors of these clumps with population synthesis models to determine the ages of the stellar populations within the clumps and their dust attenuations. In this initial analysis we assume a single instantaneous burst; in a later section (Section 8), we investigate more complex scenarios. As in our earlier studies (Smith et al., 2008; Hancock et al., 2009), we use Starburst99 version 5.1 (Leitherer et al., 1999) and include the Padova asymptotic giant branch stellar models (Vazquez & Leitherer, 2005), assuming solar metallicity. We assume a Kroupa initial mass function, and integrate the model spectra over the GALEX and SDSS bandpasses. In the model spectra, we include the H line from Starburst99 as well as other optical emission lines, derived using the prescription given by Anders & Fritz-v. Alvensleben (2003) for solar metallicity star forming regions. We used the Calzetti, Kinney, & Storchi-Bergmann (1994) starburst dust attenuation law. As an example, in Figure 4 we compare model FUV NUV vs. g r colors with the observed colors of our clumps.
We computed ages, dust attenuations, and uncertainties on the ages and attenuations using a chi squared (2) minimization calculation as in Smith et al. (2008) and Hancock et al. (2009):
In this equation, N is the number of colors used in the analysis, obsi is the observed color, modeli is the corresponding model color, and is the uncertainty in the obsi color. For these fits, we used the FUV NUV, NUV g, u g, g r, r i, and i z colors, when available. Only filters with reliable detections were used to calculate the ages; upper limits (3 detections) were ignored. In calculating the 2 values, in addition to the statistical errors, we included additional uncertainties in the colors due to background subtraction and the aperture corrections. As an estimate of the uncertainty in the colors of the clumps due to background subtraction, we compared the colors obtained with the above sky annuli with those obtained using sky annuli with an inner radius of 12′′ and an outer radius of 18′′. The median values of these additional uncertainties are 0.03, 0.03, 0.05, 0.03, 0.01, and 0.02 magnitudes for FUV NUV, NUV g, u g, g r, r i, and i z, respectively. In addition, we included uncertainties in the GALEX aperture corrections to the FUV NUV and NUV g colors. To estimate the uncertainties in the best-fit parameters, we used the method (Press et al., 1992) to determine 68.3% confidence levels for the parameters. The best-fit parameters are provided in Table 2 along with the reduced chi-squared, /(N2), where N 2 is the degrees of freedom. Table 2 also lists the colors used in the fits. We excluded the two galactic nuclei, the two likely quasars, and the foreground star from Table 2, as well as clumps with less than three colors available.
In the SED plots in the Appendix, we include the best-fit single-burst model results (solid black curves) for these clumps. To give an indication of the uncertainty in the models, we also plot models with the best-fit dust attenuations but an age 1 less than the best fit age (blue dashed curve), or 1 more than the best fit age (red dotted curve). These three models are all scaled to the SDSS g band flux of the clump. These plots and the 2/(N2) values in Table 2 give an indication of how well the models fit the data. In general, for a good fit 2 should be approximately equal to N 2. As seen in Table 2, for most clumps 2/(N2) 1 to 3, thus in most cases the model is a reasonably good fit to the data. One factor that may contribute to increasing the 2 values is variations in the dust attenuation law from location to location, depending upon the geometry and the nature of the dust (e.g., Witt & Gordon, 2000; Boquien et al., 2009; Pancoast et al., 2010). In addition, if the clumps are resolved in the GALEX images (FWHM 5′′ 3 kpc) and there are color gradients in the clumps, the uncertainties in the aperture corrections may be under-estimated. We also ignore stochastic effects in estimating the ages, which may increase the 2, particularly for the lower mass clumps (e.g., Cerviño et al., 2002; Popescu & Hanson, 2010). Most importantly, for some clumps it is possible that more than one generation of stars contributes to the observed light. This point is discussed further in Section 8.
Generally, it is assumed that the Spitzer 3.6 m and 4.5 m bands are dominated by starlight with little attenuation, but this may not always be the case. Some starbursting low metallicity dwarf galaxies show strong excesses in these bands above the stellar continuum inferred from optical data; this is likely the result of highly extincted young stars, and/or emission from hot dust grains, nebular emission lines, and/or the nebular continuum (Smith & Hancock, 2009). The young star forming region in the northern tidal tail of Arp 285 shows an apparent excess in these bands above the inferred starlight (Smith et al., 2008), as does the overlap region between the two disks of the Antennae galaxy (Zhang, Gao, & Kong, 2010) and some of the tidal star forming regions studied by Boquien et al. (2010). In contrast, for most of the Arp 107 clumps, the 3.6 m and 4.5 m fluxes agree with the best-fit population synthesis models within the uncertainties of the models (see Figures 13 20). For most of the clumps there is no strong evidence for excesses in these bands in Arp 107 above the stellar continuum inferred from the optical/UV light, though with the available data we cannot rule this out. The Arp 107 clumps are older and less ‘starbursty’ than those in many other interacting galaxies (see Section 11), thus they are less likely to have excesses in these bands.
7 Trends Along the Arm
7.1 Age vs. Position Angle Along the Arm
For the clumps along the arm, in the left panel of Figure 5 we plot the best-fit age from Table 2 vs. position angle. A sequence in age is visible along the arm, with the younger clumps in the west/northwest (about 20 Myrs for clumps 10 and 16, at PA = 240∘ 280∘) and older clumps in the southeast/east (about 80 Myrs for clumps 4, 6, and 8, at PA = 140∘ 180∘). This relative sequence of ages is similar to that inferred from the [3.6] [8.0] color (Figure 2).
We obtained a second estimate of the ages of these clumps from the H equivalent width assuming an instantaneous burst. These also show a trend in the ages along the arm, but the ages are generally younger than those derived from the broadband colors, with ages between 8 13 Myrs ( Myrs) in the south (clumps 4, 5, and 6), and 6 1 Myrs in the west (clumps 10, 16, and 21). A similar difference between H-derived ages and ages from broadband photometry was found for some star-forming knots in Arp 284 (Peterson et al., 2009). Such differences suggest that more than one generation of stars are present in these clumps, either due to multiple bursts, sustained star formation, or an underlying older stellar population. This issue is discussed further in Section 8.
7.2 Attenuation vs. Position Angle Along the Arm
In the right panel of Figure 5, we display the derived reddening E(BV) from SB99 against position angle for the clumps along the arm (filled squares). The inferred reddening is highest for clumps in the southern and northern portion of the ring, and lower in the eastern and western parts of the galaxy. The pattern of reddening around the ring roughly matches that implied by the dust attenuation tracers in Figure 3, but with a lot of scatter.
We obtained a second estimate of the reddening from the LHα/L24μm ratios of these clumps, using the Kennicutt et al. (2009) relation between LHα/L24μm and dust attenuation, along with the Calzetti, Kinney, & Storchi-Bergmann (1994) starburst attenuation law. The derived E(B V) values are higher in the south (between 0.21 0.28 for clumps 4, 5, and 6) than in the west and north (0.10 0.13 for clumps 10, 16, 21, and 26), with only upper limits in the east (0.29 for clumps 15 and 17). These E(B V) values are plotted in the right panel of Figure 5 (open circles). Note that the E(B V) values determined from LHα/L24μm are lower limits for position angles between 0∘ 160∘. These values are consistent with the values determined using SB99 within the SB99 uncertainties, with the exception of clumps 5 and 6 in the south, where they are 1.5 2 lower. We note that the H and probably most of the 24 m emission arises from interstellar matter associated with a younger stellar population, which may be more attenuated than the starlight that dominates the broadband UV and optical light (e.g., Calzetti, 2001).
We obtain a third estimate of dust attenuation by extrapolating from the 8 and 24 m flux densities to the far-infrared flux as in Calzetti et al. (2005), and then using the FIR/FUV ratio along with the FUV i color to estimate the FUV dust attenuation as in Cortese et al. (2008), assuming the Cardelli, Clayton, & Mathis (1989) AFUV/E(BV) ratio. The Cortese et al. (2008) model FIR/FUV ratios and FUV i colors were derived using the Bruzual & Charlot (2003) population synthesis models, including energy balance between the dust emission in the infrared and dust absorption in the UV/optical. As noted by Cortese et al. (2008) and references therein, the FIR/FUV method for estimating dust attenuation is almost independent of dust geometry and dust attenuation law, however, it is dependent upon the age of the stellar population. This is partially corrected for by Cortese et al. (2008) by including a UV/optical color in the fitting as a constraint on the stellar age. However, they note that their models are not applicable for systems with obscured star formation embedded within a older less obscured population.
The E(B V) values from the FIR/FUV method are plotted in Figure 5 (right) as a dotted line. The attenuations obtained with the FIR/FUV method are generally less than those determined from the population synthesis models, but for most clumps they agree within the uncertainties of the population synthesis, with the exception of the clumps in the southern portion of the ring (clumps 4, 5, 6, and 7) (see Figure 5 right). This difference may be caused by contributions from a second less obscured intermediate age component contributing to the UV light, which would lower the attenuation derived from the FIR/FUV method relative to that determined from fitting the UV/optical SED.
We also experimented with single-burst models in which we fixed the attenuation to the values obtained by the FIR/FUV method, and fitted for the best-fit age assuming a single-burst population. As expected, the derived ages are older (200 Myrs for clumps 4, 5, 6 and 7), due to the lower assumed attenuations. Also as expected, the 2 values are significantly worse, particularly in the southern portion of the ring. This supports the idea that two stellar populations are present.
8 Population Synthesis: Models With Two Populations
8.1 Overview
Next, we investigated population synthesis models using two populations of stars with different ages and dust attenuations. In these models, we varied the age of both components, the attenuation of the younger component, and the burst strength (the ratio of the mass of young stars relative to older stars). We limited the younger population to ages less than 50 Myrs, and the older population to between 50 Myrs and 10 Gyrs (i.e., intermediate to old stars). This adds additional parameters to the fitting process, and therefore makes finding a unique solution with well-constrained parameters difficult. Given the limited number of colors available for fitting and the uncertainties on these colors, it is possible to find more than one distinctly different decomposition of the SED that provides a reasonable fit to the data. In the decompositions given below, for simplicity we assumed instantaneous bursts for both populations, or an instantaneous burst superimposed on continuous star formation. It is possible that the true star formation history of these clumps may be better represented by one or more sustained bursts or an exponential decay with time, however, with the currently available data we cannot differentiate between these possibilities. For the attenuation of the older stellar population, we investigated two different scenarios. First, we explored models in which the attenuation to the older population is negligible. Second, we explored models in which the dust reddening of the older stellar population E(B V)(old) = 0.44 E(B V)(young). This latter scenario is suggested by the fact that, for starburst galaxies, the reddening to the stellar continuum has been found to be 0.44 times that of the ionized gas (e.g., Calzetti, 2001). The ratio of the attenuation of the young stars to that of the old depends upon the geometry of the clumps, including the locations of the young stars, the old stars, and the dust.
In the following sections, we provide three possible two-component SED decompositions for two of the Arp 107 clumps. These demonstrate the diversity of possible solutions, and illustrates the uncertainty in SED modeling when additional parameters are added.
8.2 Young + Old Populations
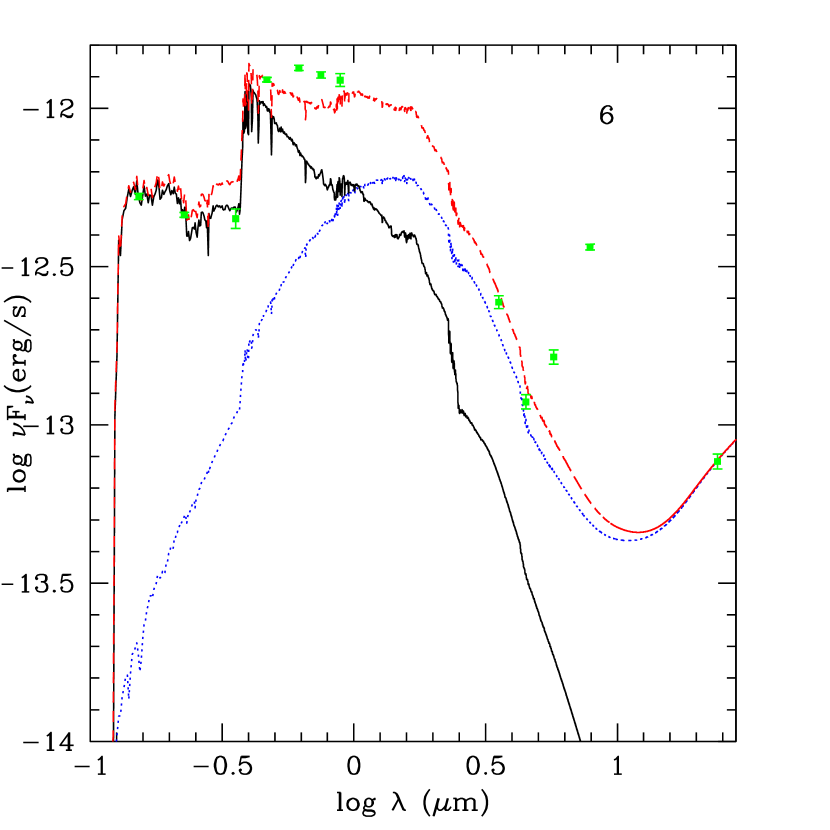
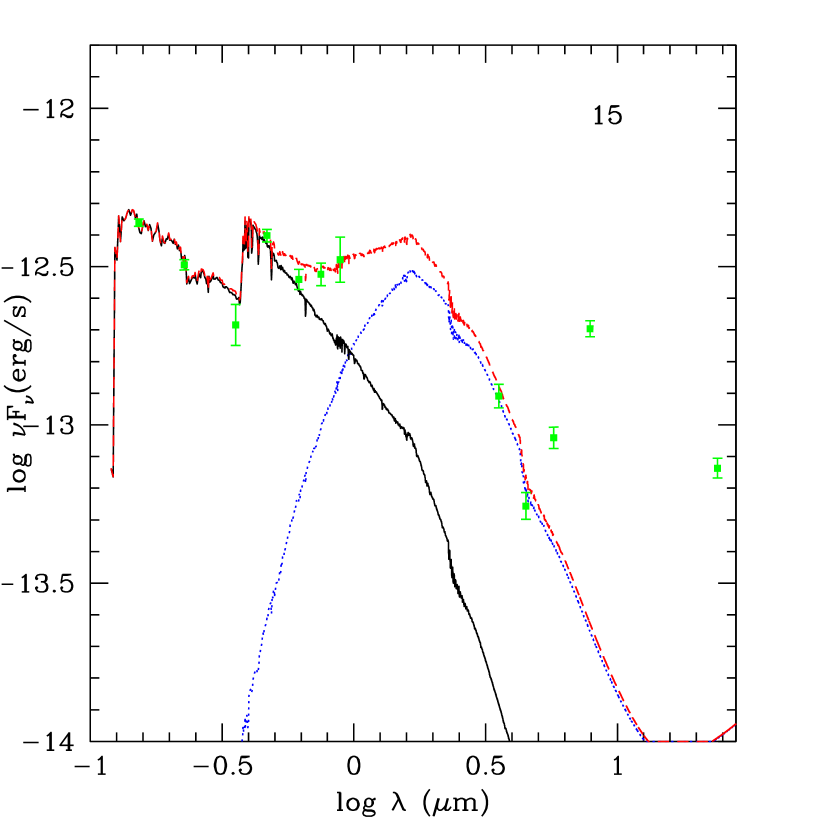
In Figure 6, we provide decompositions of the SEDs of clumps 6 and 15 assuming two instantaneous bursts of star formation, one young and one old. In these plots, the solid black curve is the older unextincted component, the blue dotted curve is the younger more extincted component, while the red dashed curve is the sum of the two components. In these decompositions, the younger population dominates the observed light in the UV, while the older population accounts for the majority of the optical light. For clumps 6, the young population is 8 Myrs old, the older population 1500 Myrs, the reddening of the younger population is E(BV) = 0.08, and the reddening of the older population is assumed to be zero. For clumps 15, the young population is 15 Myrs old, the older population 350 Myrs, the reddening of the younger population is E(BV) = 0.04, and the reddening of the older population is assumed to be zero. The burst strengths are relatively weak, with the young/old stellar mass ratios being 0.0061 and 0.079 for clumps 6 and 15, respectively. These two-component decompositions provide better matches to the shape of the UV/optical SEDs than the single-component models plotted in Figures 14 and 16. Note that for clump 6 the older stellar component can account for the 3.6 and 4.5 m fluxes, while for clump 15 it cannot, suggesting either interstellar contributions in these bands, a more complex star formation history, and/or a range in attenuations.
If the reddening of the older stellar population is instead required to be 0.44 E(B V)(young)), then the age of the older population decreases slightly to 1000 Myrs while the young/old mass ratio decreases only very slightly (0.0058). The age and reddening of the young population remained the same. When E(B V)(old) is required to be 0.44 E(B V)(young) for clump 15, the parameters are unchanged.
The attenuations in these models are consistent with the values determined from the FIR/FUV ratios (see Figure 5). However, the derived E(B V) values are lower than those obtained from the LHα/L24μm ratios (E(B) 0.30 for clump 6 and E(B) 0.29 for clump 15).
8.3 Young + Intermediate Age Stars
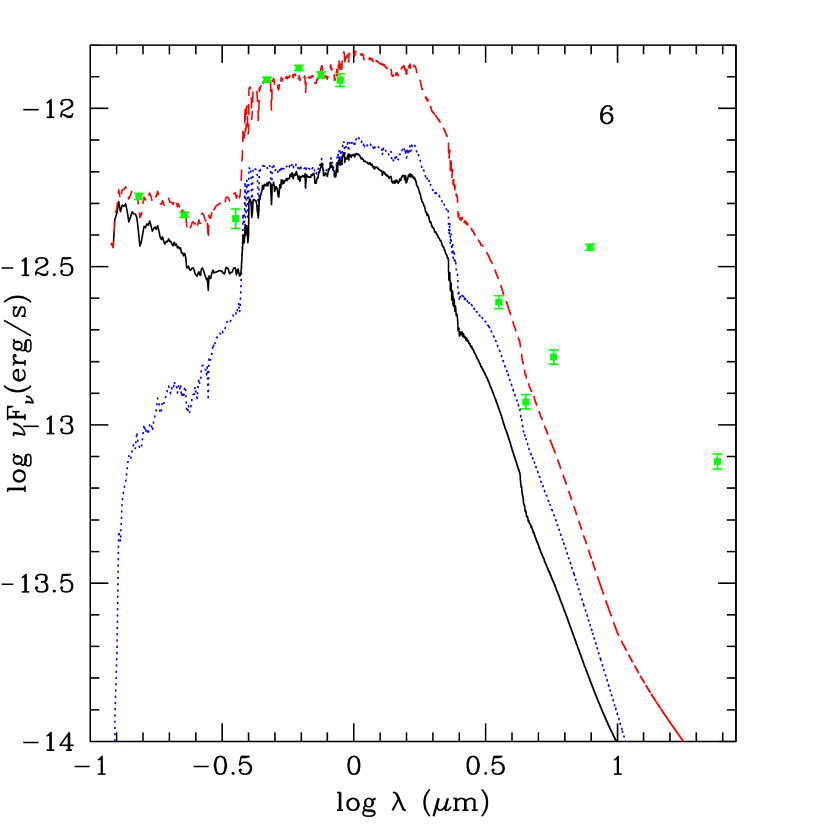
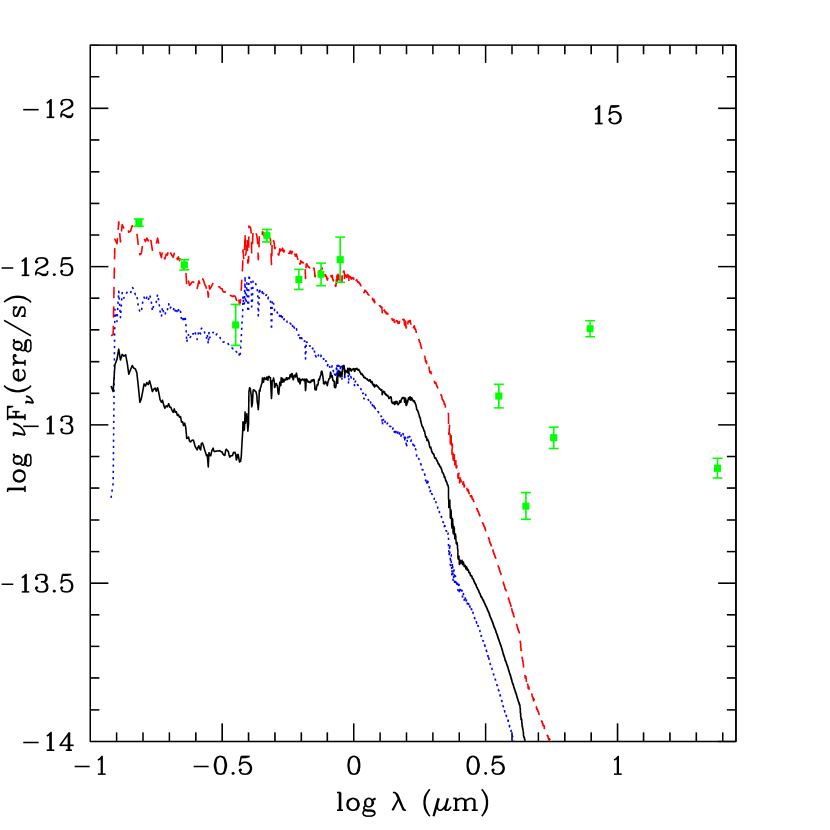
Alternative decompositions of the SEDs of clumps 6 and 15 are presented in Figure 7. In these models, a highly obscured young stellar population is added to an unobscured intermediate age population. The obscured young population contributes significantly to the longer wavelength light, accounting for most of the short wavelength Spitzer light, while the intermediate age stars contribute significantly at shorter wavelengths. Such a situation might arise when successive generations of stars have formed in close proximity, and stellar winds/supernovae have partially cleared out the dust from around the intermediate aged stars and/or these stars have escaped from their natal molecular clouds, while the young stars are still deeply embedded (e.g., Charlot & Fall, 2000; Calzetti, 2001; Conroy, White, and Gunn, 2010).
In the decompositions in Figure 7, the young populations are 6 and 8 Myrs old for clumps 6 and 15, respectively, the intermediate-age populations are 200 Myrs and 75 Myrs old, and the reddening of the younger population is E(BV) = 0.8 and 1.0. In the decomposition of clump 6 in Figure 7, most of the light in the optical and short wavelength Spitzer bands comes from the obscured younger population, while the UV light is dominated by the intermediate age less obscured stars. In the decomposition shown in Figure 7 for clump 15, the majority of the observed light in the UV and shorter wavelength optical (FUV r) comes from an unobscured intermediate-age stellar population. The obscured younger population contributes in the longer wavelength optical, and dominates the emission in the 3.6 m and 4.5 m Spitzer bands. For both clump 6 and clump 15, the decompositions in Figure 7 can account for the observed 3.6 m and 4.5 m emission, without needing to include interstellar emission in those bands.
Note that the models presented in Figure 7 are very different from those in Figure 6. In Figure 6, the UV mainly comes from young stars and the optical from older stars. In contrast, in Figure 7, the UV is from intermediate age stars and the optical from very obscured younger stars (clump 6) or from young plus intermediate age stars (clump 15). The young/old stellar mass ratios in these second sets of models are much higher than those shown in Figure 6, being 0.79 for clump 6 and 2.4 for clump 15. As can be seen in Figure 7, for both clumps the alternative decompositions also give good matches to the photometric data.
Note, however, that the decompositions in Figure 7 are inconsistent with the assumption that the reddening to the older stars is half that to younger stars; there is a much larger difference in the attentuations to the two populations. Further, the attenuations are larger than those derived from either the FUV/FIR method or the LHα/L24μm ratios.
We also experimented with decompositions in which we required that E(B V)(old) = 0.44 E(B V)(young), searching for scenarios in which the UV is dominated by light from an intermediate aged population and the longer-wavelength optical light from a younger population. With such assumptions, a reasonable match to the SED of clump 15 can be made with E(B V)(young) = 0.27, E(B V)(intermediate) = 0.12, age(young) = 8 Myrs, and age(intermediate) = 50 Myrs, with a young/intermediate mass ratio of 2.0. This is consistent with the reddening to the younger population inferred from the LHα/L24μm ratio. It is higher than that derived from the FIR/FUV ratio, however, if the FUV arises from intermediate-aged stars, and the mid-infrared fluxes (from which we infer the FIR flux) arises from dust associated with young stars, then the FIR/FUV ratio is not necessarily a good indicator of the attenuation to the young stellar population.
For clump 6 we were not able to get a good match to the SED with the standard differential attenuation assumption and an intermediate plus young stellar population (intermediate age 500 Myrs and E(B V) 1.1). Instead, the models tend to converge to a single in-between age for both components. This argues against the decompositions shown in Figure 7, if the assumption of E(B V)(intermediate) = 0.44 E(B V)(young) is correct.
8.4 Continuous Star Formation + An Instantaneous Burst
The observed SEDs are not well-matched by continuous star formation models. However, we were able to get good matches to the SEDs by combining continuous star formation with an instantaneous burst and fixing the attenuation ratio to the Calzetti (2001) value. Examples are shown in Figure 8. The model for clump 6 combines continuous star formation starting 10 Gyrs ago with an instantaneous burst 100 Myrs old. The reddening to the intermediate-age starburst is E(B V) = 0.22, and E(B V) = 0.10 to the other stars. For clump 15, the decomposition in Figure 8 consists of continuous star formation starting 10 Gyrs ago with an instantaneous burst 50 Myrs old. The reddening to the intermediate-age starburst is E(B V) = 0.10, and E(B V) = 0.04 to the other stars. In these scenarios, the age of the burst is not well-constrained, and it does not dominate the UV light.
The different SED decompositions shown in Figures 6, 7, and 8 illustrate the range of possible models for these clumps. Likely the true decomposition is in-between these examples, with a range of stellar ages and attenuations, perhaps with exponentially declining starbursts or extended starbursts, rather than instantaneous or continuous star formation. It is also possible that three distinct populations may exist in these clumps: a young burst, an intermediate-age burst, and an older underlying stellar population. In this case, the third population may be hard to hard to discern observationally. In any case, the SEDs suggest that two or more stellar populations are present, though they are not well constrained.
To better determine the star formation histories of these clumps, UV, optical, and/or near-IR spectra would be valuable, to search for direct evidence for an intermediate age stellar population, and to obtain alternative measures of the dust attenuation to the younger stars. Near-infrared photometry in the 1 3 m range would also be useful, since it which would provide additional constraints on the models. For example, in Figure 6b the model SED of clump 15 drops with increasing wavelength between the SDSS bands and 2 m, while in Figure 7b the model SED rises, with both decompositions providing a good match to the SDSS fluxes. Higher spatial resolution observations would be also useful in determining the spatial distribution of the young stars compared to the older stars.
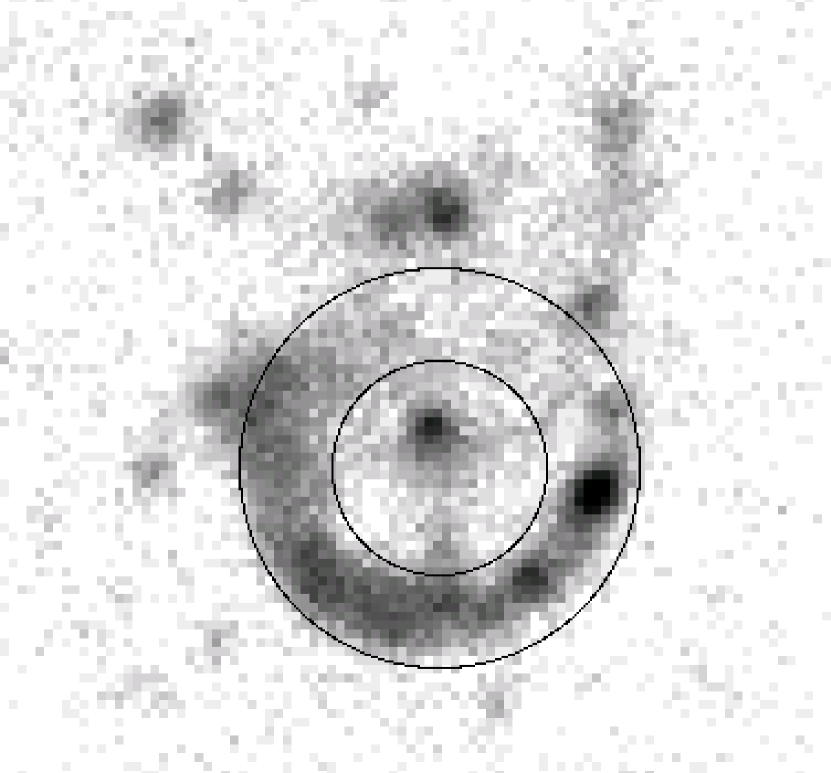
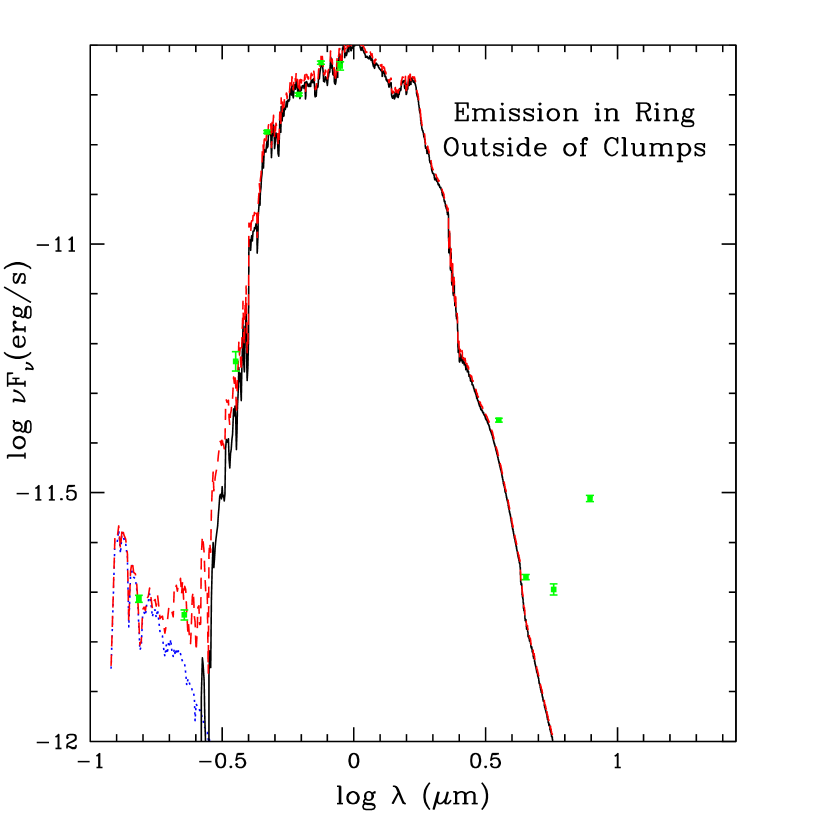
9 The Interclump Starlight
Another way to determine the properties of the older stellar population is to obtain the SED of the light arising from between the 8 m clumps. To this end, we extracted fluxes in an annulus aligned along the ring, as shown in Figure 9 (left panel). This annulus has an inner radius of 18′′ and an outer radius of 34′′, and excludes the Seyfert nucleus and the foreground star (clump 9), as well the clumps in the north (21, 22, 24, and 26) and those outside the ring. For sky subtraction we used the mode sky-fitting algorithm and a sky annulus with an inner radius of 34′′ and an outer radius of 44′′. The SED of the extracted light, minus the light from the clumps located in the annulus, is provided in Figure 9 (right panel). This SED is relatively quiescent, with some excess in the UV and mid-infrared. It is much more quiescent than that of the clumps in the ring, indicating that these knots of star formation are embedded in a more diffuse older stellar population. The NUV g color for the interclump light (NUV g = 3.1) is considerably redder than that of the clumps (NUV g from 0.5 to 1.8), thus the interclump stars are generally older than the stars in the clumps. The UV/optical colors of this interclump light is in the middle of the range found for normal spiral galaxies (Smith & Struck, 2010), except that the FUV NUV and i z colors are somewhat bluer than average. The SED of this interclump light resembles that of the two galactic nuclei (clumps 14 and 28), and, like those regions, does not fit a single-population instantaneous burst model well, but instead indicates more than one age stars.
An example two-component SED decomposition is over-plotted in Figure 9b, which matches the shape of the UV/optical SED well. This decomposition includes an 8 Myrs old burst reddened by E(B-V) = 0.08, combined with an older population of age 1500 Myrs. The young/old stellar mass ratio in this decomposition is a relatively low value of 0.0011. Thus the arm/ring appears to have an older stellar population which is more extended than the young stars. The star formation is clumpier than the older stars, but is not completely confined to the circular apertures used in this study.
10 Comparison with Numerical Simulations of the Interaction
In Paper I, we presented a numerical simulation of the Arp 107 encounter, which reproduced the observed structure with an off-center collision between a low mass early-type galaxy and a disk. The assumed mass ratio was set to 0.16, and the impact occurred near the outer edge of the primary disk, with the orbit of the companion being inclined to the rotational plane of the primary. In the early stages of this encounter, the primary had the characteristic two-armed structure of a prograde encounter, with one arm evolving into the observed bridge. This simulation is in-between that of a classical ring galaxy, a head-on collision with an orbit perpendicular to the primary’s disk, and a prograde planar encounter with a large impact parameter. The impact parameter of the Arp 107 model is larger than that used in simulations of the ‘Sacred Mushroom’ system (Wallin & Struck-Marcell, 1994), which shows a closed ring-like structure rather than a tidal arm/tail. Their Mushroom model had an impact parameter of about half of the disk radius. Toomre (1978) presented a series of simulations of ring galaxies with increasing impact parameters; closed ring-like structures are produced in systems with smaller impact parameters, while tail-like structures are produced with larger values.
In Paper I, we suggested that the sequence in Spitzer colors along the arm was caused by a progression in the time of maximum compression along this feature. One way to test this idea, and to test whether the ages derived from the single-burst model are reasonable, is to compare the apparent rate of migration of the star formation along the tidal arm with theoretical expectations. We can estimate this rate by comparing the ages of clumps at the base/middle of the tail (southeast/east) to those near the end of the tail (west). These areas are separated by about 35 kpc. If we use the single-burst ages, and associate an age of around 80 Myrs to the base/middle (clumps 4, 6, and 8), and 20 Myrs at the end (clumps 10 and 16), we get a star formation migration rate of 0.58 kpc/Myr (567 km/s).
In the simulation presented in Paper I, which uses a local density-dependent star formation algorithm, star formation does not travel smoothly along the arm, but occurs stochastically throughout the arm. However, there is a rough trend of the main locations of star formation moving outward along the arm. If we isolate a few frames in the model where star formation seems to be most active in the base, middle, and tail of the arc, and calculate a model star formation migration rate, it is much lower (more than a factor of 10) than the rates calculated above.
A comparison can also be made to the models of prograde planar encounters presented by Wallin (1990), who investigates density compression along tidal features. In his Figure 3, he provides density vs. time for various locations along a tidal feature in a prograde planar interaction. The density enhancement moves from the base of the tail to near the end in about 0.85 model time units, a distance of about 1 model unit. In his scale, this converts to roughly 0.21 kpc/Myr (205 km/s), about 3 times smaller than the rate we infer for the Arp 107 tail from the instantaneous burst models.
These inconsistencies suggest that the situation is more complex than the simple picture of a compression wave traveling along a tidal arm. This is supported by our two-component decompositions of the SEDs, which suggest that the clumps may have both young and old stars. The observed azimuthal UV/optical/IR color sequences may be due to increasing proportions of young to old stars along the arm, rather than a sequence in the true ages of the stars along the arm. Star formation may have occurred at about the same time at all locations along the arm, likely triggered by the encounter. In this sense, the system may have more in common with classical ring galaxies than with classical prograde planar encounters. Unlike the rings in many classical ring galaxies, which appear to be mainly young stars (Higdon, 1995; Marston & Appleton, 1995; Boquien et al., 2007), the Arp 107 arm/ring has a substantial underlying intermediate age or older population.
11 Comparison to Other Galaxies
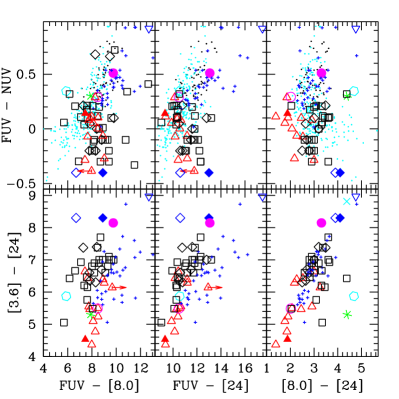
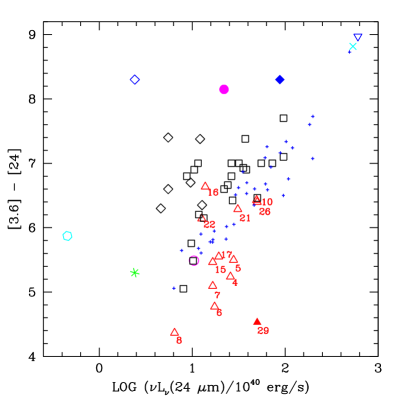
We next compared the properties of the Arp 107 clumps with those in other nearby pre-merger interacting galaxies from the literature. In Figures 10 and 11, we provide two sets of UV/optical/IR color-color plots. In these plots, for clarity we only included the clumps in Arp 107 that lie along the strong arm/ring, and the clump at the end of the tidal tail (clump 29). These plots also include clump photometry from Arp 82 (Hancock et al., 2009), Arp 285 (Smith et al., 2008), Arp 284 (Peterson et al., 2009), Arp 24 (Cao & Wu, 2007), Arp 244 (Zhang, Gao, & Kong, 2010), and Arp 143 (Beirão et al., 2009), along with clump i from NGC 2207 (Elmegreen et al., 2006). In Figure 11, we also included photometry from Boquien et al. (2010) for extra-disk star forming regions in the interacting galaxies Arp 105, Arp 245, NGC 5291, NGC 7252, and VCC 2062. Some of the more unusual clumps are identified in the figure captions. We excluded galactic nuclei from these plots, along with the likely background quasar near Arp 82 (see Hancock et al., 2007) and the Arp 143 clump for which the light was affected by a foreground star (Beirão et al., 2009). We also included photometry from Boquien et al. (2009) for H II regions in five nearby normal spirals and the interacting system M51 (Arp 85). Since published photometry is not available for all of these systems in all of the bands plotted in Figures 10 and 11, the plots are incomplete, with some sources not appearing in all of the panels in these Figures.
There is considerable scatter in the UV/optical colors plotted in Figures 10 and 11. This scatter is likely caused by differences in the ages of the stars, varying amounts of dust attenuation, as well as differences in the geometry of the star forming region and in the dust properties. The FUV [24] colors correlate to some extent with [3.6] [24] (Figure 11, middle panel bottom row), with younger clumps having redder FUV [24] colors, implying more dust absorption. The Spitzer [3.6] [24] colors also correlate with [8.0] [24] (Figure 11, lower right panel). This indicates that the larger the proportion of young stars, the more emission from hot VSGs compared to PAH emission. Arp 107 clumps 4, 5, 6, 7, and 8, along with the tail-end clump 29, stand out in this plot and in the FUV NUV vs. [8.0] [24] plot (Figure 11, upper right) as having low [8.0] [24] colors. This suggests that PAH emission in these clumps is important relative to the VSGs, and may be powered in part by older stars. The single-burst ages derived for these clumps of 55 100 Myrs (Table 2) are consistent with a large population of B stars but few O stars. B stars may be important in PAH heating (e.g., Peeters, Spoon, & Tielens, 2004), while O stars may dominate VSG heating.
In Figures 10 and 11, Stephan’s Quintet clump 5, the Arp 82 hinge clump, the Arp 82 end-of-tail clump, and clump i in NGC 2207 stand out as being very ‘starbursty’, that is, having large [3.6] [24] ratios, in contrast to the Arp 107 clumps. This is consistent with the population synthesis of Boquien et al. (2010), which indicates a very young population in SQ 5 (2 Myrs) with few underlying older stars. The very large [8.0] [24] colors for these sources indicate very enhanced UV fields. According to the Li & Draine (2001) dust models, such large [8.0] [24] ratios are reached with ISRFs about 10,000 times that of the local neighborhood. Even the most active star forming regions in Arp 107 (clumps 10, 16, 21, and 26) are much more quiescent than these starburst clumps. Interestingly, in Figures 10 and 11, the quiescent Arp 107 clumps lie near Stephan’s Quintet clump 2 (open magenta circle), which has a similar derived age of 85 Myrs according to the population synthesis modeling of Boquien et al. (2010).
Two other sources that stand out in these plots are VCC 2062 (cyan open hexagon) and clump 26 in the northern tail of Arp 82 (green asterisk). They are somewhat quiescent in [3.6] [24], but are quite red in [8.0] [24], not fitting the general correlation between [3.6] [24] and [8.0] [24]. They are also extremely blue in [3.6] [8.0] compared to the other clumps. This suggests that these objects are deficient in PAH emission relative to the other clumps in these plots. In Spitzer [3.6] [4.5] vs. [4.5] [8.0] and [4.5] [5.8] vs. [5.8] [8.0] color-color plots, clump 26 in the Arp 82 tail lies very close to the location expected for stars, i.e., colors approximately equal to zero (Hancock et al., 2007). It was undetected in the Hancock et al. (2007) H map, and no redshift is available, thus whether or not it is part of the Arp 82 system is uncertain. VCC 2062 is a dwarf galaxy in the Virgo cluster, lying within an HI structure that extends to a nearby spiral, suggesting it may be a tidal dwarf (Duc et al., 2007). From SED fitting, Boquien et al. (2010) estimate a burst age of about 115 Myrs for VCC 2062, similar to or somewhat older than the Arp 107 clumps.
In Figure 12, we provide another comparison of the Arp 107 clumps with the clumps in these other galaxies. In Figure 12, we plot the 24 m luminosity (Lν) against the [3.6] [24] color. There is a very weak correlation of [3.6] [24] color with 24 m luminosity, with a lot of scatter. The scatter may be due in part to the fact the physical sizes of the areas defined as ‘clumps’ varies from galaxy to galaxy in this sample. As noted in Section 5, there is a rough trend of increasing 24 m luminosity and increasing [3.6] [24] color with increasing azimuthal angle in Arp 107 (see Figure 2, second panel). Figure 12 shows that the Arp 107 clumps are relatively quiescent in [3.6] [24], and are not in the L24 range of the hot spot in Arp 244, clump i in NGC 2207, or the hinge clump in Arp 82. The Arp 244 hot spot and clump i in NGC 2207 stand out in this plot as being both very red in [3.6] [24], and as having very high 24 m luminosities. The most 24 m-luminous knots in Arp 107 are clumps 10 and 26, a factor of ten times lower in L24μm than the Arp 244 hot spot and clump i in NGC 2207, and a factor of two lower than the Arp 82 hinge clump. The end of the Arp 107 tail is moderately luminous at both 24 m and 3.6 m, so is low in [3.6] [24]. The candidate tidal dwarf galaxy VCC 2062 and Arp 82 clump 26 stand out in this plot as having particularly low L24μm.
These plots show that the Arp 107 clumps are relatively quiescent compared to these other sources, being bluer in the mid-infrared colors. In fact, the Arp 107 clumps extend the trends in several of the color-color plots considerably to the blue. This implies that either the stars are older, or there are greater contributions from an old population compared to young stars. If this is indeed the result of greater stellar ages, then the Arp 107 ring/arm may contain some of the oldest clusters discovered so far in a tidal structure.
12 Summary
In Paper I, strong azimuthal variations in the mid-infrared colors of clumps were seen in the ring/primary arm of Arp 107. In the current paper, we find corresponding trends in the UV/optical colors along this structure, with bluer colors further along the arm. Single-burst population synthesis modeling reveals a trend in average stellar age of the star-forming clumps along this arm, from around 80 Myrs old near the base of the arm, decreasing to around 20 Myrs near the end. However, two-component population synthesis models suggest that the situation is more complex. Likely all of the clumps have some young stars with ages around 10 Myrs, along with some intermediate age and/or older stars. Thus the observed sequences in the UV/optical/IR colors along this feature are likely due to variation in the proportions of young to old stars along this arm, rather than in the stellar ages themselves. The clumps in Arp 107 are somewhat quiescent compared to those in many other interacting galaxies.
Given the uncertainties in the data, it is difficult to distinguish between alternative two-component decompositions of the SEDs for the clumps along this arm. To better determine the stellar populations in this system, followup near-infrared photometry and UV/optical/IR spectroscopy would be valuable. Higher spatial resolution observations would be useful in determining the spatial distribution of the young stars compared to the older stars.
This research was supported by NASA Astrophysics Data Analysis Grant ADAP10-0005 and NASA Spitzer Grants RSA 1353814 and 1379558. This research has made use of the NASA/IPAC Extragalatic Database (NED), which is operated by the Jet Propulsion Laboratory, California Institute of Technology, under contract with NASA. We thank Mark Hancock for the use of his scripts to determine population ages, and Mark Giroux for helpful comments. We thank the anonymous referee for helpful suggestions.
13 Appendix
In this Appendix we present SED plots for all 29 clumps. These are displayed in Figures 13 20.
References
- Abazajian et al. (2003) Abazajian, K., et al. 2003, AJ, 126, 2081
- Anders & Fritz-v. Alvensleben (2003) Anders, P. & Fritze-v. Alvensleben, U. 2003, A&A, 401, 1063.
- Arp (1966) Arp, H. 1966, Atlas of Peculiar Galaxies (Pasadena: Caltech)
- Barton, Geller, & Kenyon (2000) Barton, E. J., Geller, M. J., & Kenyon, S. J. 2000, ApJ, 530, 660
- Barton Gillespie, Geller, & Kenyon (2003) Barton Gillespie, E., Geller, M. J., & Kenyon, S. J. 2003, ApJ, 582, 668
- Beirão et al. (2009) Beirão, P., Appleton, P. N., Brandl, B. R., Seibert, M., Jarrett, T., & Houck, J. R. 2009, ApJ, 693, 1650
- Boquien et al. (2009) Boquien, M., et al. 2009, ApJ, 706, 553
- Boquien et al. (2007) Boquien, M., Duc, P.-A., Braine, J., Brinks, E., Lisenfeld, U., & Charmandaris, V. 2007, A&A, 467, 93
- Boquien et al. (2010) Boquien, M., Duc, P.-A., Galliano, F., Braine, J., Lisenfeld, U., Charmandaris, V., & Appleton, P. N. 2010, AJ, 140, 2124
- Bournaud & Combes (2003) Bournaud, F. & Combes, F. 2003, A&A, 401, 817
- Bruzual & Charlot (2003) Bruzual, G. & Charlot, S. 2003, MNRAS, 344, 1000
- Bushouse (1987) Bushouse, H. A. 1987, ApJ, 320, 49
- Bushouse, Lamb, & Werner (1988) Bushouse, H. A., Lamb, S. A., & Werner, M. W. 1988, ApJ, 335, 74
- Cao & Wu (2007) Cao, C. & Wu, H. 2007, AJ, 133, 1710
- Calzetti (2001) Calzetti, D. 2001, PASP, 113, 1449
- Calzetti, Kinney, & Storchi-Bergmann (1994) Calzetti, D., Kinney, A. L., & Storchi-Bergmann, T. 1994, ApJ, 429, 582
- Calzetti et al. (2005) Calzetti, D., et al. 2005, ApJ, 633, 871
- Calzetti et al. (2007) Calzetti, D., et al. 2007, ApJ, 666, 870
- Cardelli, Clayton, & Mathis (1989) Cardelli, J. A., Clayton, G. L., & Mathis, J. S. 1989, ApJ, 345, 245
- Cerviño et al. (2002) Cerviño, M., Valls-Gabaud, D., Luridiano, V., & Mas-Hesse, J. M. 2002, A&A, 381, 51
- Charlot & Fall (2000) Charlot, S. & Fall, S. M. 2000, ApJ, 539, 718
- Conroy, White, and Gunn (2010) Conroy, C., White, M., & Gunn, J. E. 2010, AJ, 708, 58
- Cortese et al. (2008) Cortese, L., Boselli, A., Franzetti, P., Decarli, R., Gavazzi, G., Boissier, S., & Buat, V. 2008, MNRAS, 386, 1157
- Duc et al. (2000) Duc, P.-A., Brinks, E., Springel, V., Pichardo, B., Weilbacher, P., & Mirabel, I. F. 2000, AJ, 120, 1238
- Duc et al. (1997) Duc, P.-A., Brinks, E., Wink, J. E., & Mirabel, I. F. 1997, A&A, 326, 537
- Duc et al. (2007) Duc, P.-A., Braine, J., Lisenfeld, U., Brinks, E., & Boquien, M. 2007, A&A, 475, 187
- Duc & Renaud (2011) Duc, P.A. & Renaud, F. 2011, Tidal Effects in Astronomy and Astrophysics, Lecture Notes in Physics, in press (astro-ph/1112.1922)
- Elmegreen & Efremov (1996) Elmegreen, B. G. & Efremov, Y. N. 1996, ApJ, 466, 802
- Elmegreen et al. (2006) Elmegreen, D. M., Elmegreen, B. G., Kaufman, M., Sheth, K., Struck, C., Thomasson, M., & Brinks, E. 2006, ApJ, 642, 158
- Fazio et al. (2004) Fazio, G. G., et al. 2004, ApJS, 154, 10
- Fitzpatrick (1999) Fitzpatrick, E. L. 1999, PASP, 111, 63
- Hancock et al. (2009) Hancock, M., Smith, B. J., Struck, C., Giroux, M. L., & Hurlock, S. 2009, AJ, 137, 4643
- Hancock et al. (2007) Hancock, M., Smith, B. J., Struck, C., Giroux, M. L., Appleton, P. N., Charmandaris, V., & Reach, W. T. 2007, AJ, 133, 676
- Higdon (1995) Higdon, J. L. 1995, ApJ, 455, 524
- Keel et al. (1985) Keel, W. C., Kennicutt, R. C., Jr., Hummel, E., & van der Hulst, J. M. 1985, AJ, 90, 708
- Kennicutt et al. (1987) Kennicutt, R. C., Jr., Keel, W. C., van der Hulst, J. M., Hummel, E., & Roettinger, K. A. 1987, AJ, 93, 1011
- Kennicutt et al. (2009) Kennicutt, R. C., Jr. et al. 2009, ApJ, 703, 1672
- Lebouteiller et al. (2011) Lebouteiller, V., Bernard-Salas, J., Whelan, D. G., Brandl, B., Galliano, F., Charmandaris, V., Madden, S., & Kunth, D. 2011, ApJ, 728, 45
- Li & Draine (2001) Li, A. & Draine, B. T. 2001, ApJ, 554, 778
- Larson & Tinsley (1978) Larson, R. B & Tinsley, B. M. 1978, ApJ, 219, 46
- Leitherer et al. (1999) Leitherer, C., et al. 1999, ApJS, 123, 3
- Lonsdale, Persson, & Matthews (1984) Lonsdale, C. J., Persson, S. E., & Matthews, K. 1984, ApJ, 287, 95
- Marston & Appleton (1995) Marston, A. P. & Appleton, P. N. 1995, AJ, 109, 1002
- Pancoast et al. (2010) Pancoast, A., Sajini, A., Lacy, M., Noriega-Crespo, A., & Rho, J. 2010, ApJ, 723, 530
- Peeters, Spoon, & Tielens (2004) Peeters, E., Spoon, H. W. W., & Tielens, A. G. G. M. 2004, ApJ, 613, 986
- Peterson et al. (2009) Peterson, B. W., Struck, C., Smith, B. J., & Hancock, M. 2009, MNRAS, 400, 1208
- Popescu & Hanson (2010) Popescu, G. & Hanson, M. M. 2010, ApJ, 713, L21
- Press et al. (1992) Press, W. H., Teukolsky, S. A., Vetterling, W. T., & Flannery, B. P. 1992, Numerical Recipes in Fortran, Second Edition (Cambridge University Press, Cambridge), p. 692.
- Schlafly & Finkbeiner (2011) Schlafly, E. F. & Finkbeiner, D. P. 2011, ApJ, 737, 103
- Schweizer (1978) Schweizer, F. 1978, in I.A.U. Symposium #77, ‘Structure and Properties of Nearby Galaxies’, ed. Berkhuijsen, E. M., & Wielebinski, R., (Dordrecht, D. Reidel Publishing Co), p. 279
- Schombert, Wallin, & Struck-Marcell (1990) Schombert, J. M., Wallin, J. F., & Struck-Marcell, C. 1990, AJ, 99, 497
- Seibert et al. (2005) Seibert, M., et al. 2005, ApJL, 619, L55
- Smith & Hancock (2009) Smith, B. J. & Hancock, M. 2009, AJ, 138, 130
- Smith & Struck (2010) Smith, B. J. & Struck, C. 2010, AJ, 140, 1975
- Smith et al. (2005) Smith, B. J., Struck, C., Appleton, P. N., Charmandaris, V., Reach, W. & Eitter, J. J. 2005, AJ, 130, 2117 (Paper I)
- Smith et al. (2007) Smith, B. J., Struck, C., Hancock, M., Appleton, P. N., Charmandaris, V. & Reach, W. 2007, AJ, 133, 791
- Smith et al. (2008) Smith, B. J., Struck, C., Hancock, M., Giroux, M. L., Appleton, P. N., Charmandaris V., Reach, W., Hurlock, S., & Hwang, J. 2008, AJ135, 2406
- Smith et al. (2010) Smith, B. J., M. L. Giroux, C. Struck, M. Hancock, and S. Hurlock 2010, AJ, 139, 1212; Erratum 2010, AJ, 139, 2719
- Struck (1999) Struck, C. 1999, Phys. Rep., 321, 1
- Struck & Smith (2003) Struck, C. & Smith, B. J. 2003, ApJ, 589, 157
- Struck & Smith (2012) Struck, C. & Smith, B. J. 2012, MNRAS, 422, 2444
- Toomre (1978) Toomre, A. 1978, in I.A.U. Symposium #79, The Large-Scale Structure of the Universe, ed. M. S. Longair & J. Einasto (Dordrecht: Reidel), 109
- Vazquez & Leitherer (2005) Vazquez, G. A., & Leitherer, C. 2005, ApJ, 621, 695
- Wallin (1990) Wallin, J. F., 1990, AJ, 100, 1477
- Wallin & Struck-Marcell (1994) Wallin, J. F. & Struck-Marcell, C. 1994, ApJ, 433, 631
- Witt & Gordon (2000) Witt, A. N. & Gordon, K. D. 2000, ApJ, 463, 681
- Zhang, Gao, & Kong (2010) Zhang, H.-X., Gao, Y., & Kong, X. 2010, MNRAS, 401, 1839
- Yuan, Liu, & Xiang (2013) Yuan, H. B., Liu, X. W., & Xiang, M. S. 2013, MNRAS, in press


| ID | FUV | NUV | u | g | r | i | z |
|---|---|---|---|---|---|---|---|
| (mag) | (mag) | (mag) | (mag) | (mag) | (mag) | (mag) | |
| 1 | 22.89 0.01 | 23.33 0.22 | 21.06 | 22.06 | 21.51 0.35 | 20.86 | 19.62 |
| 2 | 21.74 0.01 | 22.11 0.07 | 21.10 | 19.82 0.05 | 19.07 0.04 | 18.83 0.05 | 19.30 0.26 |
| 3 | 22.63 0.01 | 22.32 0.08 | 21.13 | 20.54 0.08 | 19.51 0.05 | 18.94 0.05 | 18.65 0.13 |
| 4 | 19.98 0.02 | 19.88 0.02 | 19.66 0.09 | 18.25 0.02 | 17.88 0.02 | 17.72 0.03 | 17.56 0.06 |
| 5 | 20.05 0.02 | 20.05 0.03 | 19.70 0.10 | 18.48 0.02 | 18.05 0.03 | 17.90 0.03 | 17.96 0.08 |
| 6 | 20.13 0.02 | 19.84 0.02 | 19.46 0.08 | 18.10 0.02 | 17.73 0.02 | 17.59 0.03 | 17.46 0.05 |
| 7 | 19.92 0.01 | 19.86 0.01 | 19.94 0.11 | 18.59 0.02 | 18.29 0.03 | 18.03 0.03 | 17.95 0.08 |
| 8 | 20.45 0.02 | 20.34 0.02 | 21.09 0.34 | 19.02 0.04 | 18.82 0.05 | 18.81 0.08 | 19.06 0.22 |
| 9 | 22.88 | 22.53 | 21.16 | 18.22 0.02 | 16.65 0.01 | 15.76 0.00 | 15.29 0.01 |
| 10 | 19.05 0.01 | 19.12 0.01 | 19.04 0.05 | 18.62 0.02 | 18.56 0.03 | 18.37 0.04 | 18.52 0.13 |
| 11 | 21.54 0.11 | 22.26 0.34 | 21.18 | 20.92 0.23 | 19.99 0.15 | 19.78 0.17 | 18.95 0.20 |
| 12 | 22.27 0.01 | 21.41 0.04 | 19.80 0.10 | 18.37 0.01 | 17.80 0.01 | 17.52 0.01 | 17.24 0.04 |
| 13 | 22.89 0.24 | 23.14 | 21.13 | 20.63 0.11 | 20.07 0.11 | 19.76 0.12 | 19.42 |
| 14 | 20.23 0.02 | 20.03 0.02 | 18.33 0.03 | 16.61 0.00 | 15.81 0.00 | 15.39 0.00 | 15.04 0.01 |
| 15 | 20.34 0.03 | 20.24 0.04 | 20.30 0.16 | 19.33 0.05 | 19.40 0.08 | 19.17 0.09 | 18.88 0.18 |
| 16 | 20.67 0.02 | 20.96 0.04 | 20.36 0.17 | 20.38 0.09 | 19.86 0.08 | 19.69 0.10 | 19.71 |
| 17 | 20.53 0.03 | 20.45 0.04 | 20.38 0.17 | 19.27 0.05 | 18.88 0.05 | 18.75 0.06 | 18.52 0.13 |
| 18 | 22.86 0.22 | 23.29 | 21.20 | 21.99 | 21.51 | 21.03 | 19.63 |
| 19 | 23.22 0.01 | 24.03 | 21.24 | 22.24 | 21.74 | 21.24 | 19.74 |
| 20 | 22.57 0.19 | 22.96 0.35 | 21.20 | 20.46 0.13 | 19.60 0.09 | 19.56 0.13 | 19.63 |
| 21 | 20.56 0.02 | 20.83 0.03 | 19.82 0.10 | 19.44 0.03 | 19.18 0.04 | 18.90 0.04 | 19.17 0.22 |
| 22 | 23.26 0.33 | 23.09 | 21.19 | 21.67 | 20.58 0.21 | 20.68 0.32 | 19.69 |
| 23 | 24.02 0.01 | 24.10 | 21.21 | 22.28 | 21.05 0.18 | 20.69 0.21 | 19.47 0.28 |
| 24 | 21.16 0.03 | 21.24 0.06 | 20.75 0.24 | 19.42 0.04 | 19.14 0.05 | 18.97 0.06 | 19.10 0.21 |
| 25 | 23.00 0.01 | 23.91 | 21.23 | 21.28 0.18 | 19.94 0.08 | 19.22 0.06 | 18.83 0.16 |
| 26 | 20.02 0.01 | 20.08 0.02 | 19.47 0.07 | 19.11 0.03 | 18.96 0.04 | 18.84 0.05 | 18.87 0.17 |
| 27 | 21.43 0.01 | 21.34 0.04 | 21.18 | 19.72 0.05 | 18.95 0.04 | 18.60 0.04 | 18.95 0.20 |
| 28 | 21.54 0.01 | 20.83 0.02 | 17.62 0.01 | 15.76 0.00 | 14.94 0.00 | 14.56 0.00 | 14.24 0.01 |
| 29 | 20.93 0.01 | 20.98 0.03 | 20.33 0.16 | 19.51 0.04 | 19.23 0.04 | 19.08 0.06 | 19.15 0.21 |
| ID | Age | E(B-V) | Reduced | Colors Used |
|---|---|---|---|---|
| (Myr) | (mag) | Chi Squared | ||
| (2/(N2)) | ||||
| 2 | 85 | 0.64 | 7.1 | FUV-NUV, NUV-g, g-r, r-i, i-z |
| 3 | 8 | 0.80 | 0.5 | FUV-NUV, NUV-g, g-r, r-i, i-z |
| *4 | 85 | 0.34 | 2.2 | FUV-NUV, NUV-g, u-g, g-r, r-i, i-z |
| *5 | 75 | 0.38 | 2.4 | FUV-NUV, NUV-g, u-g, g-r, r-i, i-z |
| *6 | 100 | 0.34 | 2.9 | FUV-NUV, NUV-g, u-g, g-r, r-i, i-z |
| *7 | 55 | 0.34 | 2.1 | FUV-NUV, NUV-g, u-g, g-r, r-i, i-z |
| *8 | 80 | 0.20 | 2.2 | FUV-NUV, NUV-g, u-g, g-r, r-i, i-z |
| *10 | 30 | 0.10 | 2.2 | FUV-NUV, NUV-g, u-g, g-r, r-i, i-z |
| 11 | 8 | 0.52 | 1.7 | FUV-NUV, NUV-g, g-r, r-i, i-z |
| 12 | 300 | 0.44 | 1.4 | FUV-NUV, NUV-g, u-g, g-r, r-i, i-z |
| *15 | 7 | 0.32 | 0.9 | FUV-NUV, NUV-g, u-g, g-r, r-i, i-z |
| *16 | 8 | 0.24 | 1.2 | FUV-NUV, NUV-g, u-g, g-r, r-i |
| *17 | 7 | 0.44 | 0.1 | FUV-NUV, NUV-g, u-g, g-r, r-i, i-z |
| *20 | 5 | 0.94 | 0.0 | FUV-NUV, NUV-g, g-r, r-i |
| *21 | 40 | 0.30 | 6.3 | FUV-NUV, NUV-g, u-g, g-r, r-i, i-z |
| 24 | 150 | 0.22 | 1.8 | FUV-NUV, NUV-g, u-g, g-r, r-i, i-z |
| 25 | 2000 | 0.64 | 0.6 | g-r, r-i, i-z |
| *26 | 40 | 0.16 | 2.4 | FUV-NUV, NUV-g, u-g, g-r, r-i, i-z |
| 27 | 6 | 0.78 | 3.4 | FUV-NUV, NUV-g, g-r, r-i, i-z |
| **29 | 80 | 0.26 | 0.7 | FUV-NUV, NUV-g, u-g, g-r, r-i, i-z |