Electronic Structures and Phonon Spectra in Boronitride Superconductors LaBN (= Ni, Pt)
Abstract
We have investigated electronic structures and phonon spectra of newly discovered isostructural superconductors LaNiBN ( = 4.1 K) and LaPtBN ( = 6.7 K). We have found that their electronic structures are substantially three-dimensional, leading to metallicity both in NiB (PtB) and the intervening LaN layers. Our ab initio phonon calculations show that almost all phonon modes contribute to the electron-phonon coupling (EPC) mechanism, reflecting that both layers are involved in the superconductivity. For LaNiBN, we obtain an EPC strength of = 0.52 and a logarithmically averaged characteristic phonon frequency of = 376 K, leading to = 3.9 K. Compared with the Ni mode in LaNiBN, the Pt mode in LaPtBN is reduced by 70%, leading to a slightly enhanced = 0.56 and an 20% reduced . The estimated is 5.4 K for LaPtBN, in good agreement with the experiment. We do not find any indication of magnetic instability for either LaNiBN or LaPtBN, which implies that both systems are EPC mediated superconductors. Further, we have found an interesting trend of monotonic increase of with respect to the boron height in the NiB (PtB) layer of both borocarbide and boronitride superconductors, which suggests a possible way to enhance in these systems.
pacs:
71.20.Be, 74.70.Dd, 74.25.Kc, 71.20.Lp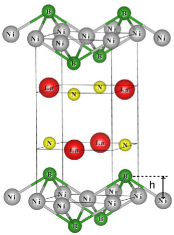
I Introduction
After the discovery of high- superconductors in cuprates and, more recently, in Fe pnictides, layered systems containing transition metals (TMs), which in particular form a square lattice, have been extensively studied. These systems are of extreme interest due to their potential for being high- superconductors induced by the interplay between superconductivity and magnetic fluctuation. In this point of view, boronitrides of (LaN)n(2B2) ( = number of layers, = TM) and borocarbides of (C)n(2B2) ( = rare-earth element), which exhibit various intriguing physical phenomena related to superconductivity and magnetism, have attracted immense attention.BC1 ; BC2 In this research, we will focus on boronitride superconductors LaNiBN and LaPtBN, recently discovered by Imamura et al.,hosono12 in order to understand the nature of their superconductivity.
About 20 years ago, Cava et al. observed superconductivity in boronitride La3Ni2B2N3 at = 13 K.cava94-1 They synthesized boronitride LaNiBN too but failed to observe the superconductivity above 4.2 K. LaNiBN showed ten times higher resistivity than the normal-state La3Ni2B2N3.cava94-1 Very recently, Imamura et al. successfully prepared a bulk superconducting LaNiBN sample with = 4.1 K, using a technique involving a high temperature of 1200 ∘C and a high pressure of 5 GPa.hosono12 Two isostructural superconducting compounds, LaPtBN and CaNiBN, were also synthesized with = 6.7 and 2.2 K, respectively.hosono12
These boronitrides show some distinctions as well as similarities in crystal structure compared to Fe pnictides. These systems commonly have inverse -PbO-type -B layers, but in the boronitrides -B layers are separated by two LaN layers with a width of 2.5 () Å, as displayed in Fig. 1. As will be addressed below, boronitrides have metallic (LaN)0 intervening layers, while a superconducting Fe pnictide, LaFeAsO, possesses insulating (LaO)1+ intervening layers.
In the Ni-based borocarbides, which are isostructural with boronitrides, the interplay between superconductivity and magnetic fluctuation has been extensively discussed.BC1 ; BC2 Pt-based superconductors often show unconventional superconductivity due to large spin-orbital coupling (SOC), incipient magnetism, and multigap nature.upt3 ; cept3si ; LP05 ; li2pt3b ; srpt3p ; cho ; anand Superconducting CePt3Si and Li2Pt3B, which do not have inversion symmetry, show significant SOC, possibly leading to the exotic superconductivity.cept3si ; LP05 ; li2pt3b On the other hand, the effects of SOC in superconducting SrPt3P are negligible.srpt3p So it is of interest to clarify whether the effects of SOC or magnetism matter in LaNiBN and LaPtBN. However, except for the observation of superconductivity, other data in the literature are still very limited.
In this paper, we will address the electronic structures, including fermiology, which indicate no magnetic instability and negligible SOC effects in both superconducting boronitrides. Then, the phonon spectra and the electron-phonon coupling (EPC) will be discussed to unveil the mechanism of the superconductivity.
II Structure and calculation method
In the tetragonal structure of LaBN(space group: , No. 129), as shown in Fig. 1, the atoms lie on the sites (,,), while the other atoms sit at the sites (,,). Our calculations were carried out with the experimental lattice constants: = 3.73 Å and = 7.64 Å for LaNiBN and = 3.8240 Å and = 7.8649 Å for LaPtBN.hosono12 ; cava94-2 These values lead to an 8% larger volume in LaPtBN, consistent with the larger atomic radius of Pt. The internal parameters were optimized using an accurate all-electron full-potential code (fplo)fplo because of the inaccuracy of the initial experimental data in LaNiBN discussed earliernat95 and the lack of available data for LaPtBN. The optimized values show tiny differences of at most 0.02 Å between the local-density approximation (LDA) and the Perdew-Burke-Ernzerhof (PBE) generalized gradient approximation (GGA),pbe indicating that these values are nearly independent of the exchange-correlation functional. In LaNiBN, the optimized values are 0.1770 for La, 0.3545 for B, and 0.1636 for N. The corresponding values of LaPtBN are 0.1666 for La, 0.3366 for B, and 0.1527 for N. The differences in between the experimental and our relaxed values are substantial, 0.65 Å for B and 0.13 Å for N,cava94-2 but they are consistent with the relaxed values by Singh and Pickett for La3Ni2B2N,wep95 showing differences of 0.45 Å for B and 0.10 Å for N. Using our optimized values, the B-N bond lengths of 1.45 () Å are obtained for both systems, which are in agreement with the optimized values in the pseudopotenial code castep by Imamura et al.,hosono12 whereas the -B bond length is 6% longer in LaPtBN. These indicate that our optimized values are well converged. In addition, by reducing the volume by 5%, the B-N bond length remains unchanged, implying strong B-N bonding and stiffness of the lattice (see below). The structural parameters were optimized until forces were smaller than 1 meV/Å.
For the full phonon calculations, we used the linear response method within the GGA implemented in the quantum espresso package,qe which produces optimized internal parameters very close to those of fplo. Our phonon calculations were carried out with the PBE ultrasoft pseudopotentials, a Gaussian smearing factor of 0.05 Ry, a wave-function cutoff of 40 Ry, and a charge cutoff of 400 Ry. We used a mesh and a mesh for the phonon calculations and a mesh for the EPC calculations, which require more careful treatment of the Fermi energy .
III Electronic Structures
III.1 Magnetic tendencies
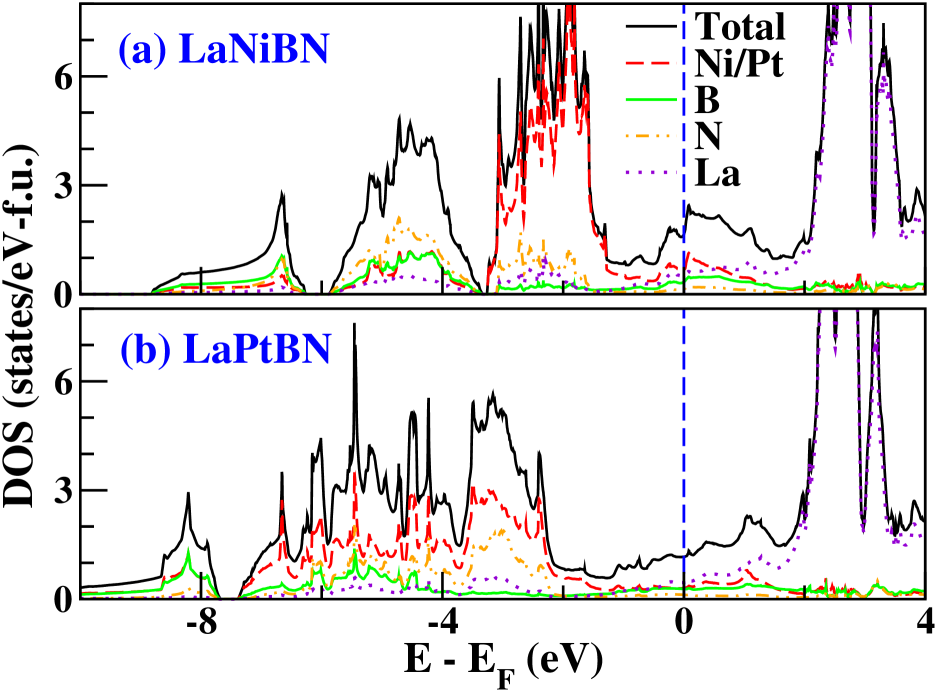
First, we address whether a magnetic instability is feasible in these boronitrides. Fig. 2 shows the total and atom-projected densities of states (DOSs) for both systems. DOSs at , , are seen to be rather low, 1.65 and 1.17 (in units of states per eV per formula unit), which is consistent with the bad metallic character observed in their normal states. These values lead to bare specific-heat coefficients of 3.9 and 2.8 mJ/mol-K2 for LaNiBN and LaPtBN, respectively, which are approximately a quarter of that of Fe pnictides in the nonmagnetic state. In contrast to the Fe pnictides, this implies less magnetic instability, or lack of magnetic instability, in these boronitrides. Additionally, the contribution of Ni to is small, 0.33 states/eV-spin-f.u. for LaNiBN. The contribution of Pt in LaPtBN is only half of this value. Using a typical intra-atomic exchange parameter of Ni 1 eV,gunn the Stoner factor is estimated to be 0.33 for LaNiBN, which is much smaller than unity. So neither metamagnetism nor a near-stable ferromagnetic state is indicated. This feature is confirmed also by our fixed spin moment calculations in both systems (not shown here). Again, no stable (anti)ferromagnetic states can be obtained from our calculations of both the local spin-density approximation and GGA for both systems.
Interestingly, considering a partial contribution of each atom at , of La3Ni2B2N3 can be exactly reproduced from that of LaNiBN. This may imply a common mechanism of the superconductivity in both systems. Note that La3Ni2B2N3 has higher by a factor of 3 and larger DOS at in the unit cell by a factor of than LaNiBN.wep95
III.2 Nonmagnetic electronic structures
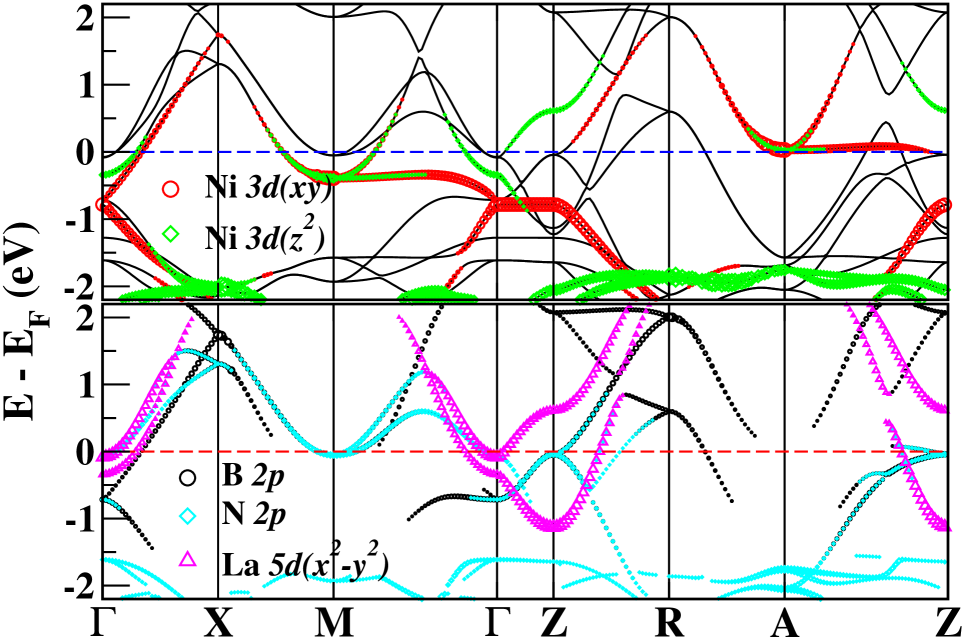
Now, we will focus on the nonmagnetic states, which represent the superconducting state. For LaNiBN, as shown in the DOS in Fig. 2(a), Ni states mainly lie in the range of –3.5 to –1 eV. Below that regime, two separated manifolds have nearly equally mixed characters of B, N, and Ni ions but relatively small La character. Near , the characters of all atoms appear, indicating metallicity in both NiB and LaN layers, as observed in La3Ni2B2N3.wep95 The Fermi energy pinpoints the midway of two small peaks, resulting from the dispersionless bands with the mixed Ni and characters along the - line at –0.5 eV and along the – line at 50 meV, as displayed in Fig. 3. In many regimes near , a mixture of these partially filled orbitals appears, reflecting strong hybridization between inter- and intra layers. The bottom panel of Fig. 3 obviously indicates the metallic La band.
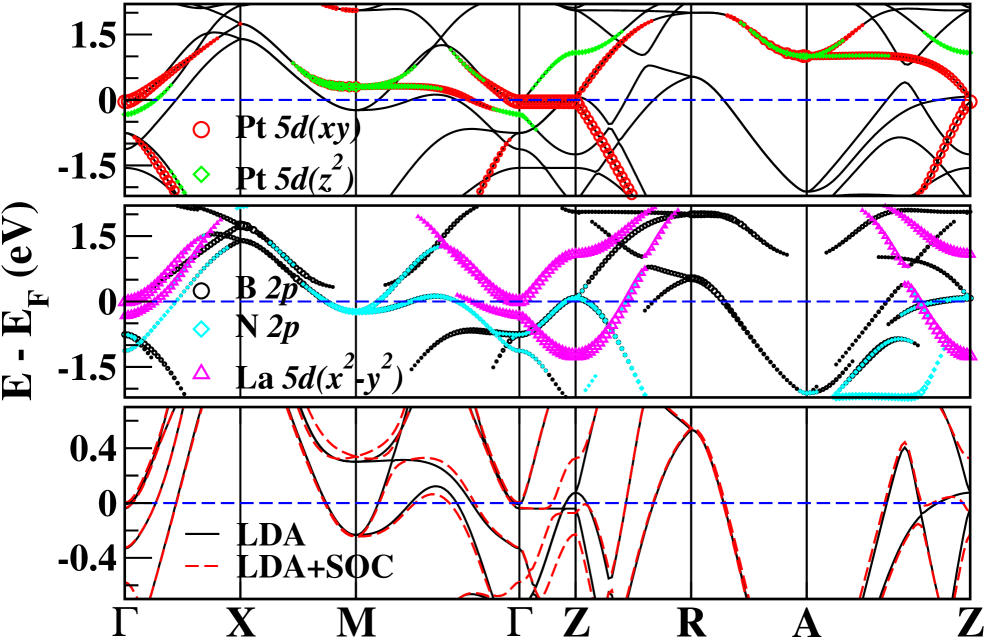
The total and atom-projected DOSs of the counterpart LaPtBN are given in Fig. 2(b). As expected, the main part of Pt orbitals is more widely spread over the range of –7.5 to –2 eV, but some tail extends to 2 eV. The total DOS smoothly increases near , except for a van Hove singularity at 80 meV, suggesting less sensitivity to carrier doping or moderate pressure. The corresponding band structure and fat bands of the partially filled orbitals are plotted together in Fig. 4. A comparison with those of LaNiBN shows some distinctions in several regimes, in particular, around the point and along the - and the - lines. At the point degenerate bands of B and N orbitals move below . To compensate for this, the two fold degenerate flat bands with Pt and orbital character shift up, being unfilled at the and points. These bands are reflected as small peaks at 0.3 and 1 eV in the DOS in Fig. 2(b). A more pronounced feature is the flat Pt band lying at –40 meV along the - line, while the corresponding Ni band exists at –1 eV in LaNiBN. This leads to some differences in the phonon spectra, which will be addressed below.
These distinctions are also analyzed through interpretation of the occupation matrix, which is useful for understanding the oxidation state.wep12 In LaNiBN, each orbital occupancy of Ni is almost identical to 0.84 per spin, resulting in a total of 8.42. B orbitals have 1.32 in total. As observed in the fat bands in Fig. 4, in LaPtBN Pt and orbitals are less filled by 0.04, while the occupancy of Pt increases a little. Compared with LaNiBN, 0.2 transfers from the Pt ion to the B ion, whereas the occupancies of N and La remain unchanged. So the Pt ions and the B ions are closer to nominal values of Pt2+ and B2- than the Ni and B ions in LaNiBN, indicating less covalent bonding between the Pt and B ions. (Of course, the formal charge concept is murky due to the metallicity and strong hybridization in these systems.) This may be consistent with the longer Pt-B bond length. According to our calculations, however, the occupancies of LaPtBN are nearly unchanged even for the same structure as in LaNiBN, indicating that these distinctions are mainly due to chemical differences between Pt and Ni ions rather than differences in structure.
Since systems often show substantial SOC effects, LDA + SOC calculations were performed for LaPtBN. As displayed in the bottom panel of Fig. 4, however, a comparison of the band structures between LDA and LDA + SOC shows negligible SOC effects near , except for a small difference at the point. This is due to the wide width of the Pt band. Additionally, our calculations substantiated that the EPC strength and ,consequently, remain nearly unchanged, when including SOC. As a result, the effects of SOC on the superconductivity of LaPtBN are insignificant. Now, we will exclude the SOC effects.
III.3 Fermi surface and Fermi velocity
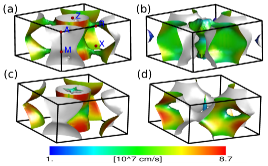
The Fermi surfaces (FSs) of LaNiBN, displayed in Fig. 5(a) and 5(b), consist of three -centered electron surfaces, two -centered electron surfaces, and a -centered hole surface. In the -centered FSs, there are cylindrical, dumbbell-like, and ellipsoidal pocket FSs. Here, a tiny -centered ellipsoid is invisible. The cylindrical pocket FS has a mixture of La and Ni orbitals, while the dumbbell-like one shows La and Ni characters with small B and N orbitals. The sandglass-like FS at the point shows substantial dispersion along the direction and has mainly Ni and characters. The -centered electron FSs have mainly B and N characters.
Fig. 5(c) and 5(d) show FSs of LaPtBN, which are similar to those of LaNiBN. However, at the -centered sandglass-like FS, which is much more dispersive along the direction, the character of Pt orbitals mostly disappears. The -centered cylindrical FS, having mostly Pt and La characters with small N character, becomes more two-dimensional. A most remarkable distinction appears in the -centered dumbbell FS. The dumbbell substantially reduces to a fishing-bob-like shape, which has mostly Pt character. The small piece at the point disappears, but a small -centered starfish-like hole pocket appears. Remarkably, although some parts of the -centered FSs are parallel to another part on the plane in both systems, the strong three-dimensionality of the FSs may substantially reduce the strength of nesting, implying no spin or charge-density-wave instability.
To understand the transport properties, we have calculated the FS velocities, as visualized in color in Fig. 5. In the dumbbell and bob FSs, in particular, the FS velocities are low around the point. The cylinders also have low FS velocity along the - direction. The root-mean-square obtained FS velocities = 3.01 and = 2.47 (in units of cm/s) for LaNiBN. Compared with the ratio : of 2:1 in La3Ni2B2N3,wep95 these values are much less anisotropic. The plasma energies are calculated from , where is the volume of the unit cell. The plasma energies obtained are = 4.80 eV and = 3.95 eV. LaPtBN is more isotropic, with = 3.50 and = 3.80 (in units of cm/s). The corresponding plasma energies are = 4.43 eV and = 4.80 eV. As observed in the electronic structures, these indicate that the transport is three-dimensional in both systems.
| LaNiBN | LaPtBN | |||||
|---|---|---|---|---|---|---|
| Symmetry | Involved atoms | Vibration | Involved atoms | Vibration | ||
| 112 | La, (B, N) | [110] | 110 | La, (B, N) | [100], [010] | |
| 133 | Ni, (La, B) | [110] | 95 | La, B, (N) | [110]∗ | |
| 134 | La, (N) | [001] | 149 | La, (B) | [001] | |
| 166 | Ni, (La, B, N) | [001] | 141 | La, Pt | [001] | |
| 194 | Ni | [001] | 50 | Pt | [001] | |
| 213 | Ni, (B, N) | [110] | 204 | Pt, B, N | [110]∗ | |
| 303 | N, (B) | [110] | 284 | N, (B) | [100], [010] | |
| 311 | N, (B) | [110] | 283 | N, (B) | [110]∗ | |
| 339 | B, N | [001] | 411 | B, N | [001] | |
| 366 | B, N, (Ni) | [001] | 406 | B, N | [001] | |
| 398 | B, (N) | [110] | 436 | B, (N) | [110]∗ | |
| 448 | B, (N) | [110] | 465 | B, (N) | [110]∗ | |
| 938 | B, N | [001] | 992 | B, N | [001] | |
| 948 | B, N | [001] | 1037 | B, N | [001] | |
IV phonon dispersion and electron-phonon coupling
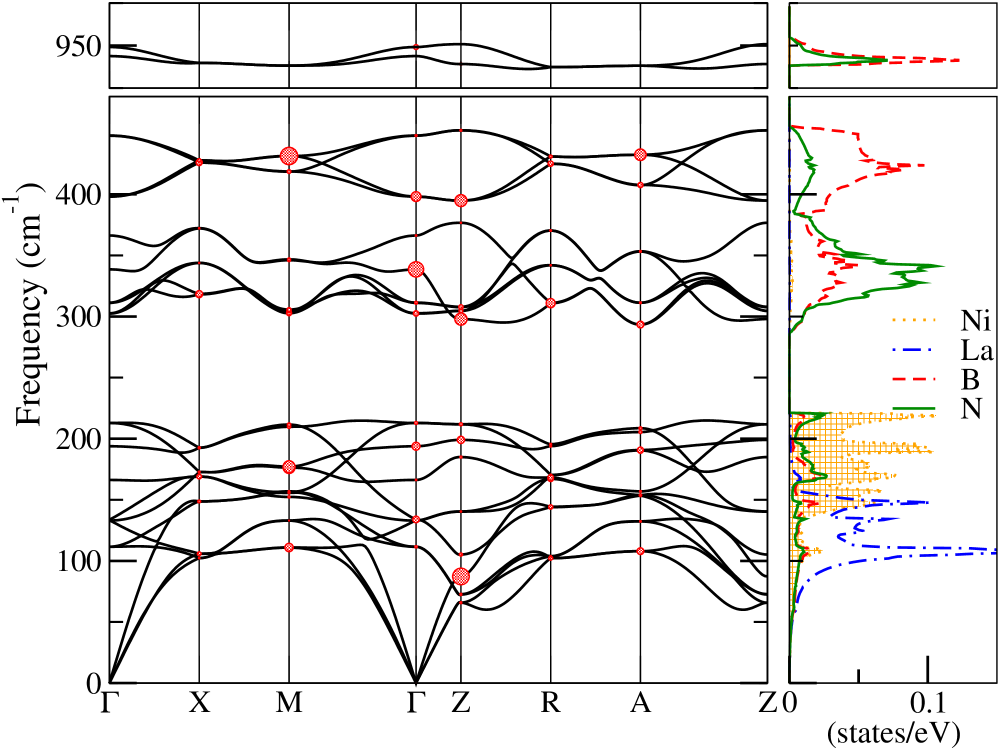
The phonon dispersion curve and the corresponding atom-projected phonon DOSs for LaNiBN are displayed in Fig. 6. The zone-centered phonon modes for both systems are analyzed in Table 1. These results are consistent with the frozen phonon calculations of La3Ni2B2N, carried out by Singh and Pickett, who obtained the Raman modes at 106, 323, and 896 (in units of cm-1).wep95 Low-energy phonon modes below 220 cm-1 come from a mixture of vibrations of all atoms, but the Ni character appears mainly in the range of 140 to 220 cm-1. The higher phonon modes originate mostly from the vibrations of B and N ions. The most unusual feature is the isolated modes at about 950 cm-1 due to only B and N ions beating against each other, indicating strong B-N bonding along the axis (see Table 1). This value is comparable to the highest B-C bonding stretching mode of 1200 cm-1 in LiBC,an though these beating modes do not contribute much to the superconductivity in LaNiBN.
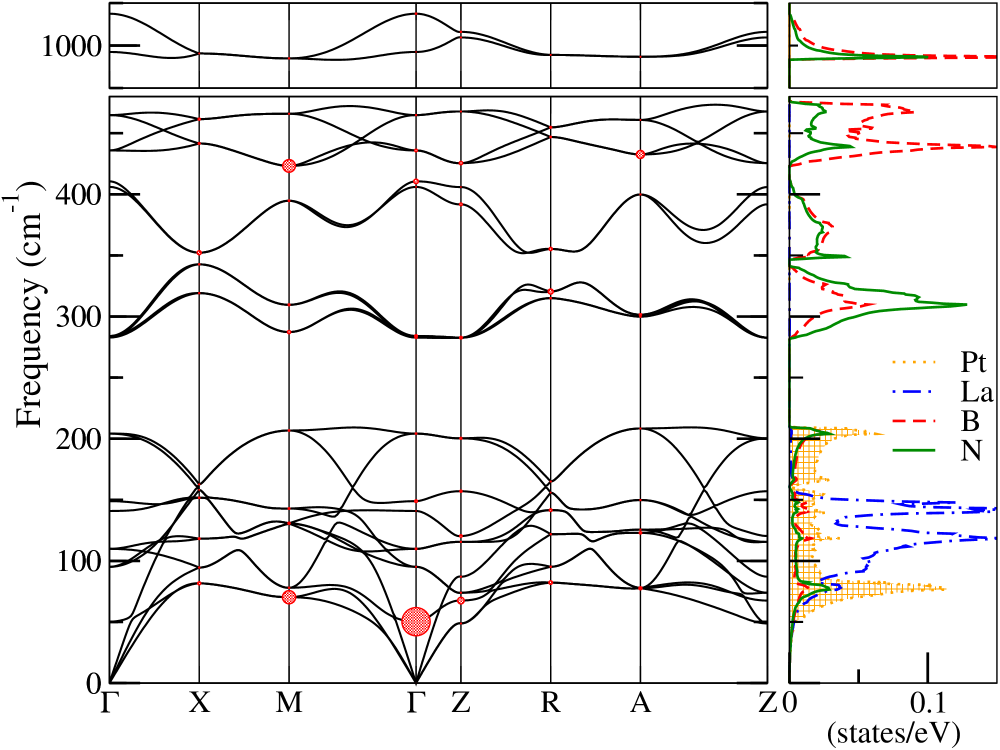
Fig. 7 shows the phonon dispersion curve and the atom-projected phonon DOSs of LaPtBN, which are very similar to those of LaNiBN. Remarkably, the main peak of the Pt ion in the phonon DOS shifts down, since a Pt ion is heavier than a Ni ion. As given in Table 1, at the zone center the Pt mode has a frequency of 50 cm-1, which is a quarter of that of the Ni mode but is very similar to the frequency of the low-lying in-plane vibrational mode of the Pt ion in SrPt3P.srpt3p ; boeri This mode leads to slightly larger EPC strength in LaPtBN (see below). Additionally, compared with LaNiBN, the frequency of the highest mode is enhanced by about 10%.
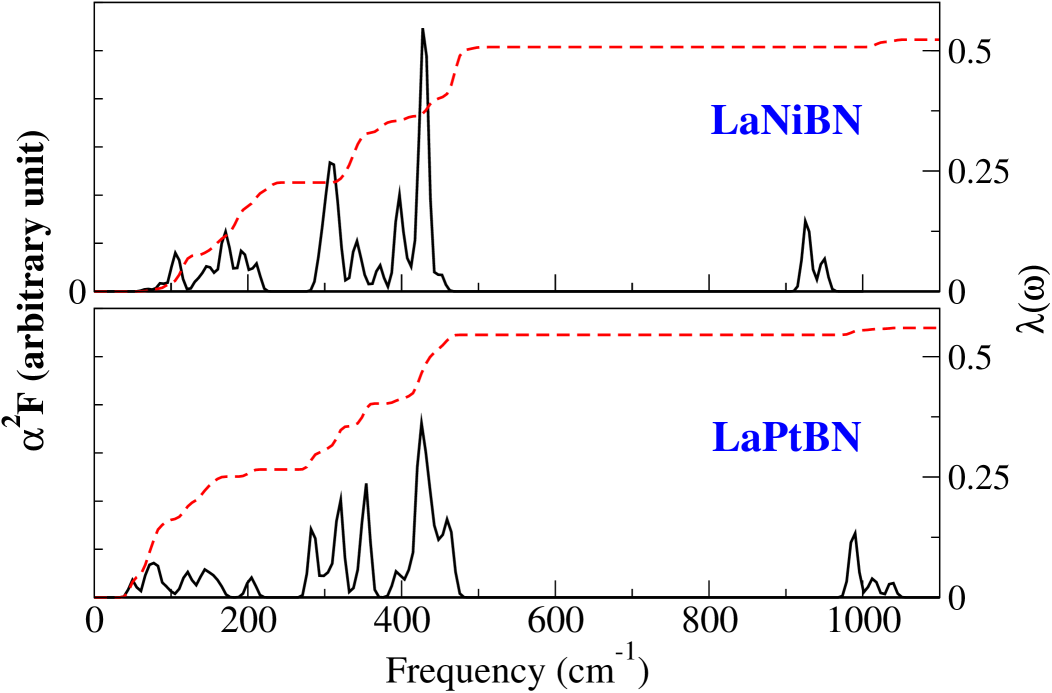
Fig. 8 shows the electron-phonon spectral function (Eliashberg function) and the EPC strength together for both systems, which are given byMcmillan
| (1) | |||
| (2) |
where is the mean-square electron-phonon matrix element averaged over FS and is the ion mass. can also be obtained as an average of over mesh and all the phonon modes, . are visualized as red circles in Fig. 6 and 7, indicating the mode EPC distributes throughout almost all phonon modes, except for the highest modes, which is consistent with the corresponding Eliashberg functions. (Note that the size of the circles in Fig. 6 is two times larger than in Fig. 7 for better visualization.) Our approach is different from previous studies, which focused on the B mode for borocarbides and boronitrides.wep95 ; matt Our result is in good agreement with the recent experiment using a time-of-flight technique.weber In LaPtBN, a few modes showing some large appear in the mode at the point, in the two fold degenerate modes around 70 and 400 at the point, and around 400 at the point, but each of these modes equally contributes only 8% to the . The two lower energy modes are involved in the Pt vibrations along the axis, but the other modes are due to the B-N out-of-phase vibrations in the plane. In spite of these distinctions, the EPC strengths of the two systems are very close, with = 0.52 and 0.56 for LaNiBN and LaPtBN, respectively. Although the main peaks in that are mostly attributed to the vibrations of B and N atoms appear in the range of 250 to 500 , their contributions to are only about 50%. The other half is contributed by low-frequency phonon modes below 250 cm-1 due to the factor of in , as shown in Eq. (2). To calculate , we used the Allen-Dynes equation,allen neglecting insignificant strong-coupling corrections in this case,
| (3) |
where is an effective Coulomb repulsion, which is uncertain for these systems but is typically in the range of 0.1 – 0.2. The logarithmically averaged characteristic phonon frequencies are 376 and 294 K for LaNiBN and LaPtBN, respectively. Thus, 3.9 K with = 0.12 for LaNiBN and 5.4 K with = 0.1 for LaPtBN, which are very close to the observed values. Considering the similar and larger bandwidth of the Pt orbital, these choices of are reasonable. As a result, the conventional EPC model effectively explains the superconductivity of both systems.
Furthermore, by changing the mass of the B atom a little, we obtained an isotope shift of for LaNiBN and 0.13 for LaPtBN, which are similar to the experimentally measured values of 0.1 – 0.25 in a few borocarbides.iso1 ; iso2 ; iso3 These values are much smaller than the BCS value of 0.5. This fact is consistent with the fact that the superconductivity is not purely mediated by B-related vibrational modes. The negative isotope shift of B in LaNiBN seems to be unusual but was also suggested through the Raman scattering measurements of the nickel borocarbides.canfield
V Discussion and Summary
As a starting point to anticipate the effects of pressure on , we reduced the volume by 3%. (During this reduction, the internal parameters were optimized with the ratio of , fixed to that of the uncompressed structure.) Although the electronic structures in both systems remain nearly unchanged in almost all regimes around , noticeable variations occur in the top of the valence (occupied) bands at the and points. In LaNiBN, at the point one of the top valence bands becomes unoccupied, so that the dumbbell FS is nearly separated into two ellipsoids. The phonon frequencies shift up in the phonon spectrum, indicating the lattice becomes stiffer, as confirmed by enhancing . This leads to decreasing and finally reducing by 18%. Changes in LaPtBN are very similar to those in LaNiBN. The flat band along the - line is shifted above , so the bob-shaped FS disappears. As expected from the small size of the bob, reduction in of LaPtBN is less significant, only 8%. This may imply less dramatic variation in the superconductivity under pressure in LaPtBN.
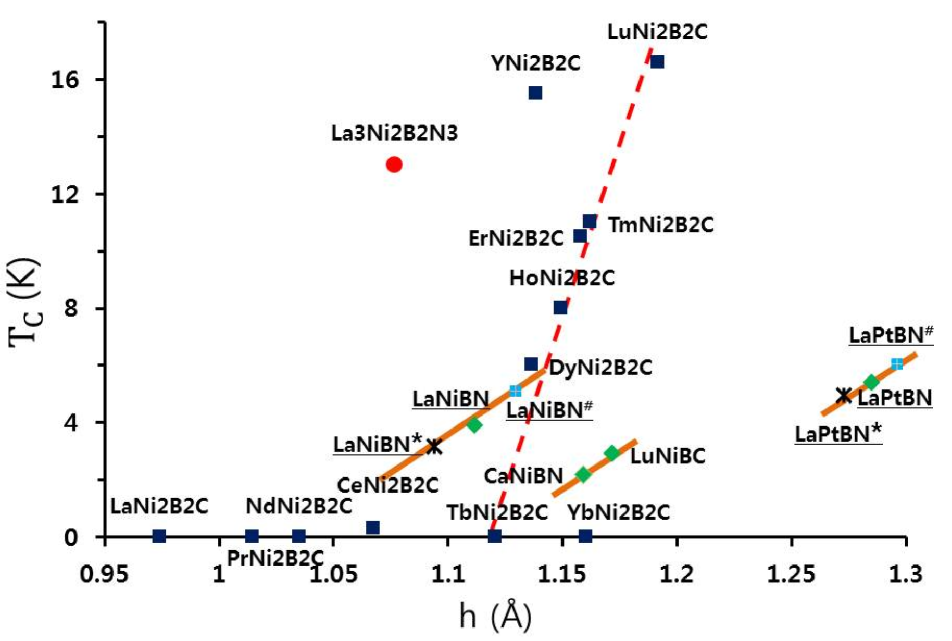
A remarkable relation between and the geometric factor has been sometimes observed, e.g., Fe pnictides showing substantial dependence of on the As-Fe-As bond angle.clee Also in the Ni-based borocarbides, a linear dependence of on the ratio of -C distance to lattice parameter was suggested, implying the EPC mediated superconductivity.BC1 Interestingly, we found another interesting trend between and the B height in the -B layer, which shows a monotonic increase of with respect to , as shown in Fig. 9. of borocarbides shows a very steep slope of = 2.27 K/pm, but no superconductivity has been observed for below 1.12 Å. One may expect similar behavior for or systems, even though the existing data are limited. Using the data for the experimental and 3% varied volumes for LaNiBN and LaPtBN, we obtained a less rapid increment of with a nearly identical slope of = 0.52 (0.02) K/pm. As addressed above in LaNiBN and LaPtBN, different topology and size of one of the -centered FSs among the compounds along each line in Fig. 9 may lead to this change in . These trends suggest that of LaNiBN and LaPtBN could be enhanced by replacing La by a bigger atom.
In summary, we have investigated the electronic structures and phonon properties of two superconductors, LaNiBN and LaPtBN, which have structures similar to those of the superconducting Fe pnictides, through first-principles approaches. Our results indicate insignificant effects of SOC, and there is no evidence of magnetic instability in either system. These systems show considerable three-dimensionality with both metallic La-N and -B layers, but relatively low DOS at . Both systems have very similar phonon spectra. One remarkable distinction is a significant reduction in the mode in LaPtBN, resulting in the enhancement of by about 8% compared to the = 0.52 value of LaNiBN. These EPC strengths lead to , consistent with the experimental values. Thus, our findings suggest that the superconductivity is mediated by conventional electron-phonon coupling.
The comparison between our calculated and the experimentally observed value in LaPtBN shows some room, which may be filled by additional interactions like spin fluctuation. However, the rather small contribution of the Pt ion to the DOS near indicates that such a magnetic interaction is improbable in LaPtBN. Further experiments would be desirable to clarify this feature in LaPtBN.
VI Acknowledgments
We acknowledge W. E. Pickett and D. J. Scalapino for fruitful discussions and K. Keopernick for providing a program to calculate the Fermi surface and Fermi velocity. This research was supported by the Basic Science Research Program through the NRF of Korea under Grant No. 2012-0002245. C.J.K. and B.I.M. were supported by the NRF under Grant No. 2009-0079947.
References
- (1) For a review, see Rare earth transition metal borocarbides (nitrides): superconducting, magnetic, and normal state properties, edited by K.-H. Müller and V. Narozhnyi (Kluwer, Dordrecht, 2001).
- (2) For a review, see I. Askerzade, Unconventional Superconductors (Springer, Berlin, 2012), p. 10.
- (3) N. Imamura, H. Mizoguchi, and H. Hosono, J. Am. Chem. Soc. 134, 2516 (2012).
- (4) R. J. Cava, H. W. Zandbergen, B. Batlogg, H. Eisaki, H. Takagi, J. J. Krajewski, W. F. Peck, Jr., E. M. Gyorgy, and S. Uchida, Nature (London) 372, 245 (1994).
- (5) R. J. Keizer, A. de Visser, A. A. Menovsky, J. J. M. Franse, A. Amato, F. N. Gygax, M. Pinkpank, and A. Schenck J. Phys. Condens. Matter 11, 8591 (1999).
- (6) E. Bauer, G. Hilscher, H. Michor, Ch. Paul, E. W. Scheidt, A. Gribanov, Yu. Seropegin, H. Noël, M. Sigrist, and P. Rogl, Phys. Rev. Lett. 92, 027003 (2004).
- (7) K.-W. Lee and W. E. Pickett, Phys. Rev. B 72, 174505 (2005).
- (8) H. Q. Yuan, D. F. Agterberg, N. Hayashi, P. Badica, D. Vandervelde, K. Togano, M. Sigrist, and M. B. Salamon, Phys. Rev. Lett. 97, 017006 (2006).
- (9) C.-J. Kang, K.-H. Ahn, K.-W. Lee, and B. I. Min, J. Phys. Soc. Jpn. 82, 053703 (2013).
- (10) N. H. Sung, C. J. Roh, K. S. Kim, and B. K. Cho, Phys. Rev. B 86, 224507 (2012).
- (11) V. K. Anand, C. Geibel, and Z. Hossain, Physica C 460-462, 636 (2007).
- (12) D. J. Singh, W. E. Pickett, H. W. Zandbergen, and R. J. Cava, Nature (London) 374, 682 (1995).
- (13) K. Koepernik and H. Eschrig, Phys. Rev. B 59, 1743 (1999).
- (14) J. P. Perdew, K. Burke, and M. Ernzerhof, Phys. Rev. Lett. 77, 3865 (1996).
- (15) H. W. Zandbergen, J. Jansen, R. J. Cava, J. J. Krajewski, and W. F. Peck, Jr., Nature (London) 372, 759 (1994).
- (16) D. J. Singh and W. E. Pickett, Phys. Rev. B 51, 8668 (1995).
- (17) P. Giannozzi et al., J. Phys. Condens. Matter 21, 395502 (2009).
- (18) O. Gunnarsson, J. Phys. F:Metal Phys. 6, 587 (1976).
- (19) Y. Quan, V. Pardo, and W. E. Pickett, Phys. Rev. Lett. 109, 216401 (2012).
- (20) H. T. Stokes, D. M. Hatch, and B. J. Campbell, (2007), isotropy, 2012, http://stokes.byu.edu/iso/isotropy.php.
- (21) E. Kroumovaa, M. I. Aroyoa, J. M. Perez-Matoa, A. Kirovb, C. Capillasa, S. Ivantcheva, and H. Wondratschekc, Phase Transitions 76, 155 (2003); http://www.cryst.ehu.es/rep/sam.html.
- (22) J. M. An, H. Rosner, S. Y. Savrasov, and W. E. Pickett, Physica B 328, 1 (2003).
- (23) A. Subedi, L. Ortenzi, and L. Boeri, Phys. Rev. B 87, 144504 (2013).
- (24) W. L. McMillan, Phys. Rev. 167, 331 (1968).
- (25) L. F. Mattheiss, T. Siegrist, and R. J. Cava, Solid State Commun. 91, 587 (1994).
- (26) F. Weber, S. Rosenkranz, L. Pintschovius, J.-P. Castellan, R. Osborn, W. Reichardt, R. Heid, K.-P. Bohnen, E. A. Goremychkin, A. Kreyssig, K. Hradil, and D. L. Abernathy, Phys. Rev. Lett. 109, 057001 (2012).
- (27) P. B. Allen and R. C. Dynes, Phys. Rev. B 12, 905 (1975).
- (28) D. D. Lawrie and J. P. Franck, Physica C 245, 159 (1995).
- (29) K. O. Cheon, I. R. Fisher, and P. C. Canfield, Physica C 312, 35 (1999).
- (30) H. Hodovanets, S. Ran, P. C. Canfield, and S. L. Bud’ko, arXiv:1203.4131v2 (2012).
- (31) I.-S. Yang, M. V. Klein, S. Bud’ko, and P. C. Canfield, J. Phys. Chem. Solids 63, 2195 (2002).
- (32) C.-H. Lee, A. Iyo, H. Eisaki, H. Kito, M. T. Fernandez-Diaz, T. Ito, K. Kihou, H. Matsuhata, M. Braden, and K. Yamada, J. Phys. Soc. Jpn. 77, 083704 (2008).
- (33) C. Godart, L.C.Gupta, R.Nagarajan, S.K. Dhar, H. Noel, M. Potel, C. Mazumdar, Z. Hossain, C. Levy-Clement, G. Schiffmacher, B.D. Padalia, and R. Vijayaraghavan, Phys. Rev. B 51, 489 (1995).
- (34) T. Siegrist, R.J. Cava, J.J. Krajewski, and W.F. Peck, Jr., J. Alloys Comp. 216, 135 (1994).
- (35) A. L. Ivanovskii, Russ. Chem. Rev. 67, 357 (1998).
- (36) J. W. Lynn, S. Skanthakumar, Q. Huang, S. K. Sinha, Z. Hossain, L. C. Gupta, R. Nagarajan, and C. Godart, Phys. Rev. B 55, 6584 (1997).