Two-dimensional magnetic interactions in LaFeAsO
Abstract
Inelastic neutron scattering measurements demonstrate that the magnetic interactions in antiferromagnetic LaFeAsO are two-dimensional. Spin wave velocities within the Fe layer and the magnitude of the spin gap are similar to the AFe2As2 based materials. However, the ratio of interlayer and intralayer exchange is found to be less than in LaFeAsO, very similar to the cuprates, and 100 times smaller than that found in AFe2As2 compounds. The results suggest that the effective dimensionality of the magnetic system is highly variable in the parent compounds of the iron arsenides and weak 3-D interactions may limit the maximum attainable superconducting .
pacs:
75.25.-j, 61.05.fgThe discovery of high-temperature superconductivity in the iron arsenide compounds Kamihara08 immediately led to comparisons to the copper oxide superconductors. Both systems possess layered crystal structures, suggesting that two-dimensional (2-D) behavior may be a shared feature amongst the high-temperature superconductors. In particular, the enhanced spin fluctuations that arise from reduced dimensionality is regarded as a critical element of high-temperature superconductivity. In the case of the copper oxide materials, the magnetism occurs within square copper oxide sheets that are weakly coupled to each other due to separation by ionic layers (such as BaO or LaO). The parent La2CuO4 compound, for example, is an insulator with a strongly anisotropic resistivity measured within () and perpendicular () to the Cu layers ( 500 at high temperatures).Preyer89 The magnetic excitations measured with inelastic neutron scattering (INS) are well-understood within a 2-D Heisenberg model as the ratio of interlayer to intralayer exchange is very small ().Endoh88 ; Keimer92
In the iron arsenides, magnetism also occurs in separated square FeAs layers, but the dimensionality of the magnetic interactions is debated. Measurements of the anisotropic properties have been mainly performed on the AFe2As2 (122) system ( Ca, Sr, Ba), where large single-crystals are available. In the 122 materials, the FeAs layers are separated by an alkali-earth metal layer (with Fe-Fe layer separation of 5.5 - 6.5 Å from Ca - Ba, respectively). Transport properties in parent 122 compounds display only a weak anisotropy (for example, Tanatar09 ) in contradiction to the strongly 2-D transport properties observed in the cuprates. Angle-resolved photoemission (ARPES) experiments on the 122 compounds indicate a significant variation of the Fermi surface geometry along the -axis that is also consistent with a 3-D system.Heimes ; Kim Finally, INS measurements with Ca,Diallo08 ; Diallo09 ; Zhao09 , Sr Zhao08 , and Ba Sato09 ; Harriger11 , indicate a fairly substantial interlayer magnetic exchange interaction () which supports three-dimensional (3-D) magnetism.
Very little is known about the magnetic interactions in the FeAsO (1111) family of superconducting materials that currently claim the largest superconducting transition temperature of 55 K (whereas 40 K for the 122 compounds).Johnston10 Based on a larger interlayer spacing ( 8.7 Å), 1111 compounds are expected to be closer to the 2-D limit than the 122 compounds. The recent availability of large single-crystals of LaFeAsO Yan09 have enabled measurements of the anisotropic resistivity ( 2-20)Jesche12 , which is similar to the 122 compounds. However, ARPES measurements of the effective dimensionality of the electronic system are inconclusive due to the presence of surface states.Liu10 In this Letter, we use INS measurements of the spin-wave spectrum in the parent LaFeAsO compound to show that magnetic exchange coupling is 2-D, despite the inference of only weak anisotropy from bulk measurements, with a ratio of exchange interactions comparable to the cuprates (). This result provides evidence that the magnetism can vary from 2-D to weakly 3-D in different iron arsenide compounds, with possible implications for the maximum achievable .Monthoux
The sample used for INS experiments consists of dozens of small single-crystals of LaFeAsO with a total mass of approximately 600 mg that are co-aligned to within 2 degrees. Details of crystal growth and characterization are described elsewhere.Yan09 Previous neutron and x-ray scattering measurements show that the crystals undergo a tetragonal-orthorhombic structural phase transition at K, followed by stripe antiferromagnetic ordering transition at K.Yan09 The wavevector of the stripe AFM ordered state is (1/2,1/2,1/2)T when indexed with reference to the high-temperature tetragonal structure. In this paper, the scattering data is presented with respect to low-tempereture orthorhombic unit cell (in other words; (1,0,1/2)O) where we define and the lattice constants are 5.68 Å and Å. INS measurements were performed on the MERLIN spectrometer at the ISIS Neutron Scattering Facility at Rutherford-Appleton Laboratory and the HB3 spectrometer at the High Flux Isotope Reactor at Oak Ridge National Laboratory. For these measurements, the samples were mounted in the scattering plane.
For subsequent discussion, both the MERLIN and HB3 data are described using a model of damped Heisenberg spin waves with nearest (,) and next-nearest () interactions within the Fe layer, and an interlayer exchange (). We also include a single-ion anisotropy energy () to account for an observed spin gap. Within linear spin-wave theory, the dispersion is given by with and . The magnetic susceptibility can be written as a damped simple harmonic oscillator (with damping parameter ),
| (1) |
and the INS intensity in arbitrary units is where is the magnetic form factor of the Fe2+ ion and is the reduced wavevector within the magnetic Brillouin zone.
MERLIN measurements were performed with the incident neutron beam oriented along and an incident energy 150 meV. The spectrum of spin fluctuations were measured deep in the stripe AFM ordered state at 5 K and are shown in Figs. 1 (a) and (b) for the longitudinal () and transverse () directions relative to (see Fig. 1(c) for reference). In these spectra, an assumed isotropic and energy-dependent non-magnetic background signal was estimated by summing data at all scattering angles after masking the INS signal near the magnetic zone centers. The spectrum below 100 meV consists of steep spin waves concentrated close to and all symmetrically equivalent wavevectors in the twinned orthorhombic structure [see Fig. 1(c)]. The signal above 100 meV becomes too weak to observe. The MERLIN data is therefore best understood in the small- limit with spin waves described by an anisotropic linear dispersion relation,
| (2) |
The spin gap and spin wave velocities are given by , , , , respectively, where and .
The anisotropy of the dispersion within the Fe layer appears as the elliptical shape of the neutron intensity in Fig. 1(c). Estimates of the longitudinal and transverse spin wave velocities (based on fits discussed below) are 555 100 meV Å and 420 55meV Å respectively. The in-plane spin wave velocities in LaFeAsO are comparable, though slightly larger, than the 122 materials, in agreement with first-principles electronic band structure calculations.Han09 The longitudinal velocity exceeds the transverse velocity () and the anisotropy of the spin excitations within the Fe layer is defined as .Tucker12 The value of 0.25 for LaFeAsO is similar to the values found in the parent 122 compounds where 0.2-0.4.Tucker12
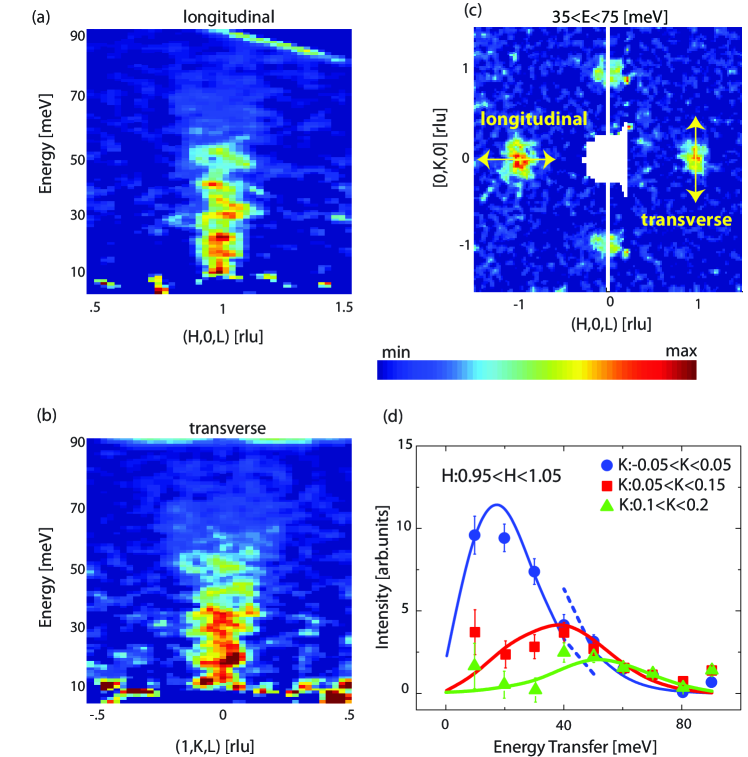
MERLIN measurements cannot ascertain any substantial interlayer exchange interactions, which should appear as -dependent oscillations in the intensity. In time-of-flight INS experiments with the -axis fixed along the incident beam, is a function of the energy transfer . So, the absence of substantial -dependent intensity oscillations in Figs. 1(a), (c), and (d) indicates 2-D magnetism.
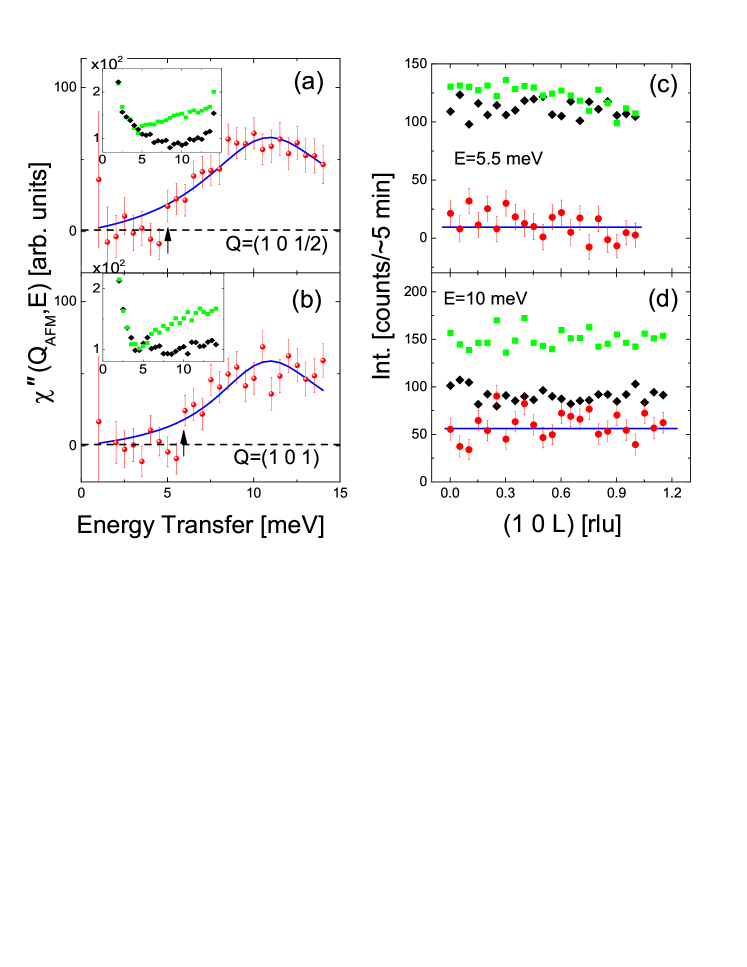
In order to verify this 2-D behavior, we performed measurements of the low-energy spin excitations at 5 K on the same sample using the HB3 spectrometer. Figure 2(a) shows that a substantial spin gap is observed at . The gap shows an onset of 5 meV and a peak at 11 meV and is comparable to the spin gaps observed in Fe2As2 Diallo08 ; Zhao08 ; Sato09 ; Park12 and NaFeAs Park12 compounds. Low-energy INS measurements on polycrystalline LaFeAsO observe a similar sized spin gap and report a 2D-like response.Ishikado09
The difference between the spin gaps at the magnetic zone center () and the magnetic zone boundary point at () provides a direct measurement of . Using the Heisenberg model, the difference in spin gaps is
| (3) |
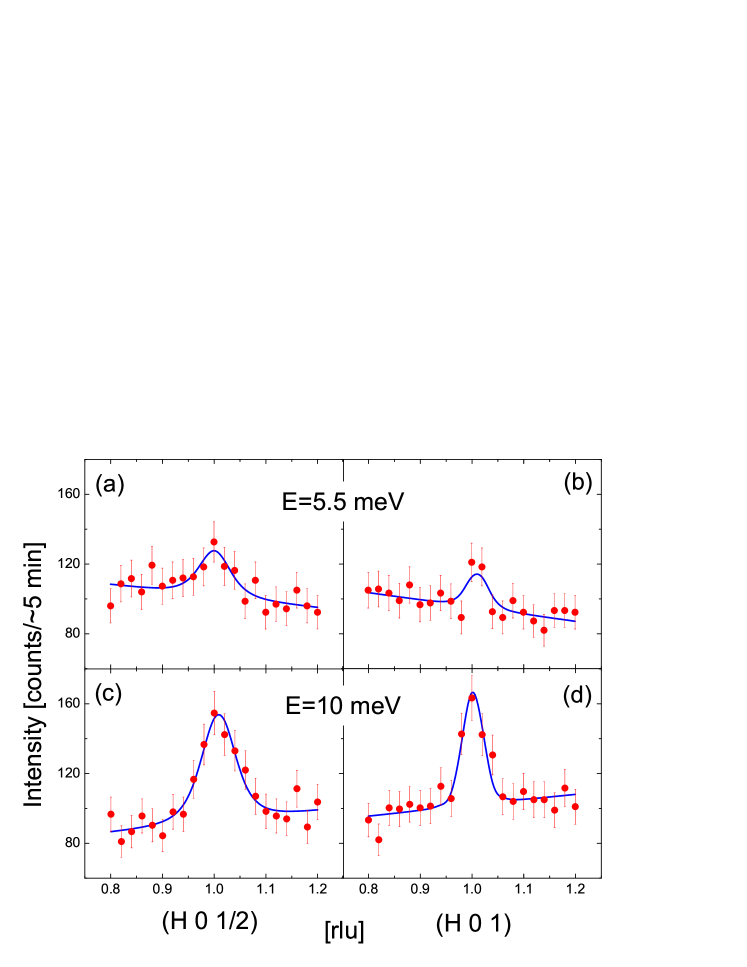
A comparison of Figs. 2(a) and 2(b) shows that the magnitude of the spin gap is similar at , thereby providing very strong confirmation that must be weak. Figs. 2(c) and (d) show an absence of any dependent sinusoidal modulations of the intensity along both at the gap onset at 5.5 meV and the peak at 10 meV. Finally, we show in Fig.3 that a longitudinal cut at the gap onset of 5.5 meV reveals weak intensity at both and , which again confirms that the two spin gaps are the same. The HB3 data shown in Figs.2 and 3 was fit using Eqns. (1) and (2) after convolution with the instrumental resolution using the RESLIB programReslib . These data were used to obtain values for the low energy damping and the spin gaps at and , yielding meV, meV, and meV, respectively. All of these data and subsequent fits give substantive proof that no observable dispersion exists along and, therefore, magnetic interactions in LaFeAsO are 2-D in nature.
For the MERLIN data, the TOBYFIT program Tobyfit was used to fit the corrected data to the 2-D Heisenberg model after convolution with the instrumental resolution and accounting for orthorhombic twinning. The values of and used in the MERLIN fits are fixed to the values determined by the HB3 data. The corrected data has been symmetrized by averaging all four equivalent quadrants of reciprocal space and subtracting an estimate of the non-magnetic and background scattering. The main MERLIN fitting results are displayed in Figs. 1 and 4 as a series of longitudinal and transverse cuts through at different energy transfers from 15 to 75 meV. At low energies, cuts through the steep magnetic excitations consist of a single sharp peak centered at due to resolution limitations (the resolution width is indicated by the horizontal line in Fig. 4). Above 55 meV, the peak splitting from counter propagating spin wave modes can be resolved and is more pronounced in transverse cuts where the spin wave velocity is lower. The two curves in Fig. 4 represent a global fit to all cuts shown (blue line) as well as local fits to each cut (red line) with both procedures yielding similar values for the fitting parameters. Without the ability to observe the spin wave dispersion at the magnetic zone boundary positions, such as [], the fits are not sensitive to the difference between nearest-neighbor exchange constants, . The full set of fitting parameters listed Table 1 represent both the HB3 and MERLIN data quite well.
| HB3 | MERLIN Local | MERLIN Global |
|---|---|---|
| 1 | 20 | 15 |
| .6 | 7 | 5 |
| 100 |
| 55 |

In summary, the details of the spin wave spectrum and magnetic energy scales of LaFeAsO are similar in many ways to the 122 compounds. The energy scale for exchange interactions within the Fe layer and their average in-plane anisotropy are nearly equivalent. This is in accordance with ab initio calculations of the spin excitation spectrum.Han09 The measurements must be extended up to higher energies in order to determine whether any substantial difference exists between and . At lower energies, we find that the magnitude of the spin gap is also similar to the 122 compounds. The common energy scale of the 122 and NaFeAs spin gaps was recently discussed in Park12 , as it does not follow from the expectations of simple single-ion anisotropy due to substantial differences in the magnitude of the ordered moments in the two systems. The similar spin gap observed in LaFeAsO, along with its relatively small ordered moment (0.4 ),Cruz08 would seem to add some strength to this argument.
The most important difference in the 122 and 1111 compounds is the interlayer exchange. In our measurements, the zone center and (0,0,1/2) zone boundary spin gaps in LaFeAsO are equal within error. Considering the error bars may allow a 1 meV difference in spin gaps, we can estimate an upper limit for the exchange anisotropy (based on Eq. 3) of which is similar to the cuprates and places LaFeAsO strongly in the 2-D limit. In comparison, is 100 times larger for the parent 122 compounds.Diallo08 ; Diallo09 ; Zhao09 ; Zhao08 ; Sato09 ; Harriger11 The 2-D antiferromagnetism found in the 1111 compounds may be responsible for some enhancement of ( 55 K) and weak 3-D magnetic interactions present in the 122 family compounds may present a limitation to higher superconducting transition temperatures ( 40 K).
RJM would like to thank D. C. Johnston and V. Antropov for useful discussions. The work at Ames Laboratory was supported by the U.S. Department of Energy, Office of Basic Energy Science, Division of Materials Sciences and Engineering under Contract No. DE-AC02-07CH11358. Work at Oak Ridge National Laboratory is supported by U.S. Department of Energy, Office of Basic Energy Sciences, Scientific User Facilities Division.
References
- (1) Y. Kamihara, T. Watanabe, M. Hirano, and H. Hosono, J. Am. Chem. Soc. 130, 3296 (2008).
- (2) N. W. Preyer, R. J. Birgeneau, C. Y. Chen, D. R. Gabbe, H. P. Jenssen, M. A. Kastner, P. J. Picone, and Tineke Thio, Phys. Rev. B 39, 11563 (1989)
- (3) Y. Endoh, K. Yamada, R. J. Birgeneau, D. R. Gabbe, H. P. Jenssen, M. A. Kastner, C. J. Peters, P. J. Picone, T. R. Thurston, J. M. Tranquada, G. Shirane, Y. Hidaka, M. Oda, Y. Enomoto, M. Suzuki, and T. Murakami, Phys. Rev. B 37, 7443 (1988).
- (4) B. Keimer, N. Belk, R. J. Birgeneau, A. Cassanho, C. Y. Chen, M. Greven, M. A. Kastner, A. Aharony, Y. Endoh, R. W. Erwin, and G. Shirane, Phys. Rev. B 46, 14034 (1992).
- (5) M. A. Kastner, R. J. Birgeneau, G. Shirane, and Y. Endoh, Rev. Mod. Phys. 70, 897 (1998).
- (6) M. A. Tanatar, N. Ni, G. D. Samolyuk, S. L. BudÕko, P. C. Canfield, and R. Prozorov, Phys. Rev. B 79, 134528 (2009).
- (7) A. Heimes, R. Grein and M. Eschrig, Phys. Rev. B 86, 064528 (2012).
- (8) T.K. Kim, A.N. Yaresko, V.B. Zabolotnyy, A.A. Kordyuk, D.V. Evtushinsky, N.H. Sung, B.K. Cho, T. Samuely, P. Szabo, J.G. Rorigo, J.T. Park, D.S. Inosov, P. Samuely, B. Buchner and S.V. Borisenko, Phys. Rev. B 85, 014520 (2012)
- (9) R. J. McQueeney, S. O. Diallo, V. P. Antropov, G. D. Samolyuk, C. Broholm, N. Ni, S. Nandi, M. Yethiraj, J. L. Zarestky, J. J. Pulikkotil, A. Kreyssig, M. D. Lumsden, B. N. Harmon, P. C. Canfield, and A. I. Goldman, Phys. Rev. Lett. 101, 227205 (2008).
- (10) S. O. Diallo, V. P. Antropov, T. G. Perring, C. Broholm, J. J. Pulikkotil, N. Ni, S. L. Bud’ko, P. C. Canfield, A. Kreyssig, A. I. Goldman, and R. J. McQueeney, Phys. Rev. Lett. 102, 187206 (2009).
- (11) Jun Zhao, D. T. Adroja, Dao-Xin Yao, R. Bewley, Shiliang Li, X. F. Wang, G. Wu, X. H. Chen, Jiangping Hu, and Pengcheng Dai, Nat. Phys. 5, 555 (2009).
- (12) Jun Zhao, Dao-Xin Yao, Shiliang Li, Tao Hong, Y. Chen, S. Chang, W. Ratcliff Ii, J. W. Lynn, H. A. Mook, G. F. Chen, J. L. Luo, N. L. Wang, E. W. Carlson, Jiangping Hu, and Pengcheng Dai, Phys. Rev. Lett. 101, 167203 (2008).
- (13) K. Matan, R. Morinaga, K. Iida, and T. J. Sato, Phys. Rev. B 79, 054526 (2009).
- (14) P. Monthoux and G. G. Lonzarich, Phys. Rev. B 63, 054529 (2001).
- (15) L. W. Harriger, H. Q. Luo, M. S. Liu, C. Frost, J. P. Hu, M. R. Norman, and Pengcheng Dai, Phys. Rev. B 84, 054544 (2011).
- (16) D. C. Johnston, Adv. Phys. 59, 803 (2010).
- (17) J. Q. Yan, S. Nandi, J. L. Zarestky, W. Tian, A. Kreyssig, B. Jensen, A. Kracher, K. W. Dennis, R. J. McQueeney, A. I. Goldman, R. W. McCallum, and T. A. Lograsso, Appl. Phys. Lett. 95, 222504 (2009).
- (18) A. Jesche, F. Nitsche, S. Probst, Th Doert, P. Muller, and M. Ruck, Phys. Rev. B 86, 134511 (2012).
- (19) C. Liu et al., Phys. Rev. B 82, 075135 (2010).
- (20) Myung Joon Han, Quan Yin, Warren E. Pickett, and Sergey Y. Savrasov, Phys. Rev. Lett. 102, 107003 (2009).
- (21) G. S. Tucker, R. M. Fernandes, H. F. Li, V. Thampy, N. Ni, D. L. Abernathy, S. L. Bud’ko, P. C. Canfield, D. Vaknin, J. Schmalian, and R. J. McQueeney, Phys. Rev. B 86, 024505 (2012).
- (22) J. T. Park, G. Friemel, T. Loew, V. Hinkov, Yuan Li, B. H. Min, D. L. Sun, A. Ivanov, A. Piovano, C. T. Lin, B. Keimer, Y. S. Kwon, and D. S. Inosov, Phys. Rev. B 86, 024437 (2012).
- (23) A. Zheludev [http://www.neutron.ethz.ch/research/resources/reslib]
- (24) T.G. Perring [http://tobyfit.isis.rl.ac.uk]
- (25) M. Ishikado et al., J. Phys. Soc. Jpn. 78, 043705 (2009).
- (26) Clarina de la Cruz, Q. Huang, J. W. Lynn, Jiying Li, W. Ratcliff Ii, J. L. Zarestky, H. A. Mook, G. F. Chen, J. L. Luo, N. L. Wang, and Pengcheng Dai, Nature (London) 453, 899 (2008).