The SUMO project I. A survey of multiple populations in globular clusters ††thanks: Based on observations made with the INT telescope operated on the island of La Palma by the Isaac Newton Group in the Spanish Observatorio del Roque de los Muchachos of the Instituto de Astrofísica de Canarias. Based on observations made with MPG/ESO 2.2m telescope in La Silla, Chile, proposal 088.A-9012.
Abstract
We present a general overview and the first results of the
SUMO project (a SUrvey of Multiple pOpulations in
Globular Clusters). The objective of this survey is the study of multiple
stellar populations in the largest sample of globular clusters
homogeneously analysed to date. To this aim we obtained high signal-to-noise
(S/N50) photometry for main sequence stars with mass down to 0.5
in a large sample of clusters using both archival
and proprietary , , , and data from ground-based telescopes.
In this paper, we focus on the occurrence of multiple stellar populations in
twenty three clusters. We have defined a new photometric index
= , that turns out to be very effective for
identifying multiple sequences along the red giant branch (RGB). We found
that in the - diagram all clusters presented in this paper show
broadened or multimodal RGBs, with the presence of two or more components.
We found a direct connection with the chemical properties of different
sequences, that display different abundances of light elements (O, Na, C, N,
and Al). The index is also a powerful tool to identify distinct
sequences of stars along the horizontal branch and, for the first time in
the case of NGC 104 (47 Tuc), along the asymptotic giant branch. Our
results demonstrate that i) the presence of more than two stellar
populations is a common feature amongst globular clusters, as already
highlighted in previous work; ii) multiple sequences with different
chemical contents can be easily identified by using standard Johnson
photometry obtained with ground-based facilities; iii) in the study of
GC multiple stellar populations the index is alternative to
spectroscopy, and has the advantage of larger statistics.
keywords:
globular clusters: general – techniques: photometric1 Introduction
There is an increasing body of evidence suggesting that both Galactic and Magellanic Cloud globular clusters host multiple populations, a byproduct of the cluster internal chemical evolution. The majority of GCs appear to have at least two approximately coeval sub-populations, or rather two generations of stars. The recognition of this fact came with the increasing observational evidence for what was denoted as ‘star-to-star abundance variations’ or ‘abundance anomalies’, that manifest themselves as variations of nitrogen, carbon, oxygen and sodium – in some clusters also magnesium and aluminum – abundances amongst stars in individual clusters. These abundance differences are found in stars of all evolutionary stages (see, e.g. Kraft et al., 1992; Cannon et al., 1998; Gratton et al., 2001).
This phenomenon has been known for a few decades (see, e.g. Osborn, 1971; Kraft, 1978; Cohen, 1978; Norris & Freeman, 1979), but was limited to a small number of stars in each cluster. The striking, additional evidence that GCs host multiple populations came from both high-quality photometry for thousands of cluster stars, as well as from systematic spectroscopic investigation thanks to modern multi-object spectroscopy. As it turned out, multiple cluster sequences in the colour-magnitude diagrams (CMDs) show up in all the clusters studied with appropriate filters. The occurrence of multiple populations can be related to the evidence of main sequence (MS) splittings like in Centauri (Anderson, 1997; Bedin et al., 2004), NGC 2808 (D’Antona et al., 2005; Piotto et al., 2007), or NGC 6752 (Milone et al., 2010). but it is also associated to the photometric detection of multimodal RGBs (e.g. Grundahl et al., 1999; Marino et al., 2008; Yong & Grundahl, 2008; Lee et al., 2009), and in some cases of a sub-giant branch (SGB) splittings (e.g. Milone et al., 2008; Marino et al., 2009; Piotto et al., 2012).
The most recent photometric analyses have shown that the CMDs of GCs consist of intertwined sequences of the two or more populations, whose separate identities can be followed continuously from the MS up to the red giant branch (RGB), and thence to the horizontal branch (HB, NGC 104, Milone et al., 2012e).
Photometric analyses have clearly shown that the use of photometric filters sampling the ultra-violet (UV) portion of the stellar spectra, is a very powerful tool for detecting and tracing multiple populations in the CMDs of GCs (e.g. Grundahl et al., 1999; Marino et al., 2008).
Computations of suitable model atmospheres (Sbordone et al., 2011) accounting for the peculiar chemical patterns of second generation stars have explained the pivotal role played by UV photometric filters in studying sub-populations in GCs. The UV portion of stellar spectra is hugely affected by the change in the abundance of CN and NH molecules, due to the light-element anticorrelations observed in the stars belonging to the second stellar generation; using suitable combinations of photometric filters, including UV filters, allows one to emphasize the difference in the radiative flux between primordial cluster stars and those enriched by the high-temperature H-burning products.
Obviously, (high-resolution) spectroscopy allows a more detailed analysis of the specific chemical patterns associated to second generation stars; but for the majority of GCs this kind of analysis is limited to the brightest RGB stars, and in any case to a limited number of objects.
Tracing the multiple population phenomenon in a large fraction of cluster stars (if not in the whole cluster) is mandatory to establish the actual fraction of second generation stars in individual GCs. In addition, the comparison between photometry and theoretical stellar evolutionary models (e. g. Pietrinferni et al., 2009) and colour - transformations, that account for the specific chemical patterns of the distinct sub-populations (see Sbordone et al., 2011), allows to investigate how stellar structural and evolutionary properties are affected by the chemical abundance distribution of each distinct sub-population.
In this work we present an overview of the SUMO project, – a SUrvey of Multiple pOpulations –, together with its first results. The paper is organized as follows: §2 introduces the main objectives of the survey, while the data and the derived CMDs are presented in §3 and §4. §5 introduces a new photometric index, based on the combination of three bands, that is effective to highlight different sequences along the RGB. The connection with the chemical content of sub-populations identified in this way is discussed in §6. Our conclusions in §7 close the paper.
2 The SUMO project
The basic idea of the SUMO project is to create a database of homogeneous, wide-field, multiwavelength, photometric data
of GCs. The main aim is to study the multiple population phenomenon, and in particular
the primary objectives of the survey are:
investigate the occurrence of multiple populations in a large sample of GCs.
Is this a property common to all GCs?
Identify multiple populations along different evolutionary phases, from the MS to
the RGB and HB;
verify the connection between photometric and spectroscopic properties of
different stellar populations;
study the radial gradients over a large fraction of the body of each cluster.
,,, photometry for a large number of clusters will also be used to study a number of
different topics, to be presented in forthcoming papers:
i) the effect of differential reddening, if present, following the
procedure described in Milone et al. (2009, see also Sect. 4.1);
ii) the population of blue stragglers, and their radial gradients;
iii) the binary fraction, which will complement similar works on the same
GCs based on Hubble Space Telescope (HST) data and limited to the cluster
centres (e. g. Sollima et al., 2007; Milone et al., 2008).
iv) the properties of the RGB bump over a large metallicity range;
v) a self-consistent study of the HB morphology;
vi) identification of spectroscopic targets for future follow-ups;
vii) new theoretical models will have to be developed, with ad-hoc chemical mixtures
and the proper model atmospheres, following the pioneering work of Sbordone et al. (2011).

This survey has been designed to complement the HST data available in the literature, that have been successfully used to disentangle multiple sequences in the CMD of the inner, most crowded regions of a large number of GCs (Piotto et al., 2007; Milone et al., 2008; Bellini et al., 2010; Milone et al., 2012e; Piotto et al., 2012). The large field-of-view of ground based data is mandatory to extend this result over the main body of each cluster, tracing the presence and the relative contribution of distinct components. This is crucial to shed light on the formation mechanism of the multiple populations. In fact, theoretical models (D’Ercole et al., 2008) predict that a large fraction (up to 90% or more) of first-generation stars should be lost early on during the GC evolution, because of the expansion and stripping of the cluster outer layers resulting from the mass loss consequent to massive SNe explosions. The fact that first-generation stars were much more numerous at the time of the cluster formation can also account for the polluting material needed to explain the following stellar generation. Signatures of these dynamical evolution are expected to be observable in the present-day stellar radial distribution, at least in clusters with long relaxation times; a systematic study of the radial gradients would therefore provide solid constraints to understand the nature of the polluters and the processes that have caused the formation of successive stellar generations.
Finally, following previous works (Marino et al., 2008; Milone et al., 2012e), we emphasize the use of the -band as an efficient diagnostic to identify multiple stellar populations. For this reason, from the observational point of view (see §3), we devoted a significant fraction of our observing runs collecting data in this filter. The colour combination presented in this paper (see §. 5) turned out to be very effective to show the presence of multiple populations along the RGB, correlating with the chemical properties of stars. In the following section, we summarize the properties of the target clusters.
2.1 Public products
One of the objectives of this project is to disseminate the results to the greatest extent possible, releasing to the general community a large number of products. With this aim, we set a web page, http://www.iac.es/project/sumo which will be regularly updated with: plots (CMDs, colour-colour), reddening maps, fiducial lines.
| Cluster | R.A. | Dec. | U | B | V | I |
|---|---|---|---|---|---|---|
| NGC 104 [47 Tuc] | 00 24 05.67 | -72 04 52.6 | 21 | 106 | 115 | 103 |
| NGC 288 | 00 52 45.24 | -26 34 57.4 | 9 | 63 | 100 | 68 |
| NGC 362 | 01 03 14.26 | -70 50 55.6 | 11 | 140 | 162 | 151 |
| NGC 2808 | 09 12 03.10 | -64 51 48.6 | 48 | 652 | 545 | 203 |
| NGC 3201 | 10 17 36.82 | -46 24 44.9 | 13 | 4 | 4 | 4 |
| NGC 4590 [M 68] | 12 39 27.98 | -26 44 38.6 | 14 | 48 | 48 | 35 |
| NGC 5904 [M 5] | 15 18 33.22 | +02 04 51.7 | 28 | 75 | 132 | 127 |
| NGC 6093 [M 80] | 16 17 02.41 | -22 58 33.9 | 21 | 25 | 45 | 22 |
| NGC 6121 [M 4] | 16 23 35.22 | -26 31 32.7 | 12 | 1026 | 1425 | 41 |
| NGC 6205 [M 13] | 16 41 41.24 | +36 27 35.5 | 20 | 58 | 54 | 67 |
| NGC 6218 [M 12] | 16 47 14.18 | -01 56 54.7 | 46 | 196 | 212 | 166 |
| NGC 6254 [M 10] | 16 57 09.05 | -04 06 01.1 | 17 | 18 | 27 | 29 |
| NGC 6366 | 17 27 44.24 | -05 04 47.5 | 8 | 9 | 30 | 18 |
| NGC 6397 | 17 40 42.09 | -53 40 27.6 | 11 | 42 | 36 | 28 |
| NGC 6541 | 18 08 02.36 | -43 42 53.6 | 12 | 33 | 36 | 23 |
| NGC 6681 [M 70] | 18 43 12.76 | -32 17 31.6 | 13 | 28 | 48 | 38 |
| NGC 6712 | 18 53 04.30 | -08 42 22.0 | 35 | 38 | 49 | — |
| NGC 6752 | 19 10 52.11 | -59 59 04.4 | 35 | 84 | 1176 | 28 |
| NGC 6809 [M 55] | 19 39 59.71 | -30 57 53.1 | 12 | 40 | 40 | 36 |
| NGC 6934 | 20 34 11.37 | +07 24 16.1 | 15 | 38 | 42 | 39 |
| NGC 6981 [M 72] | 20 53 27.70 | -12 32 14.3 | 6 | 241 | 277 | 218 |
| NGC 7078 [M 15] | 21 29 58.33 | +12 10 01.2 | 31 | 277 | 271 | 196 |
| NGC 7099 [M 30] | 21 40 22.12 | -23 10 47.5 | 9 | 38 | 48 | 20 |

2.2 Properties of the target clusters
The cluster sample presented in this paper includes both objects where different generations of stars have been already discovered and widely studied, and objects with no evidence of multiple stellar populations. In this Section we summarize the observational scenario. The main properties will be used in the following to interpret the multimodal RGBs of Fig. 6-11.
The CMD of 47 Tuc-NGC 104 consists of intertwined sequences, whose separate identities can be followed continuously from the MS up to the RGB, and thence to the HB (Milone et al., 2012e). The observed colours are consistent with a pair of populations with different content of light elements (e.g. Norris & Freeman, 1979; Cannon et al., 1998; Harbeck et al., 2003; Pancino et al., 2010), and small helium differences (e.g. di Criscienzo et al., 2011; Nataf et al., 2011; Milone et al., 2012d). A third population is visible only along the SGB, and includes less than 10% of the stars (Anderson et al., 2009; Piotto et al., 2012).

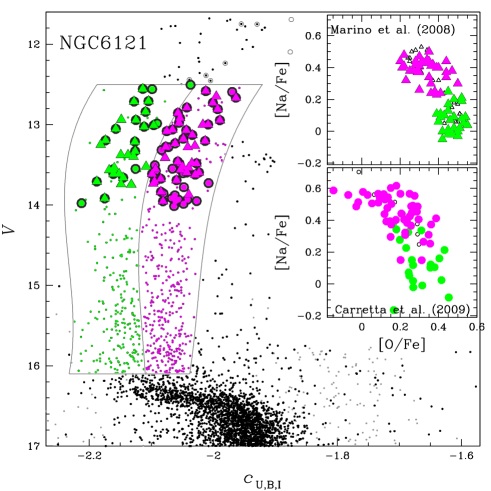
NGC 6121 is known to be a metal-intermediate GC, with [Fe/H]1.1 and [/Fe]0.4. Spectroscopy of bright RGB stars revealed a significant spread in light-element abundances (Gratton et al., 1986; Brown et al., 1990; Brown & Wallerstein, 1992; Drake et al., 1992; Smith et al., 2005; Villanova & Geisler, 2011) with a bimodal CN distribution (Norris, 1981), an O-Na anticorrelation and a Na-Al correlation (Ivans et al., 1999; Marino et al., 2008). The analysis of high-resolution VLT/UVES spectra for about one hundred RGB stars revealed a bimodality in the stellar distribution in the Na versus O plane (Marino et al., 2008). The two groups of Na-rich/O-poor, and Na-poor/O-rich stars populate two different sequences along the RGB in the versus CMD. Na-rich stars define a sequence on the red side of the RGB, while Na-poor stars populate a bluer, more spread sequence. Interestingly, NGC 6121 hosts also a bimodal HB, which is well populated both on the red and the blue side of the RR-Lyrae gap. HB stars exhibit a bimodal Na and O distribution similar to what found for RGB stars, with red-HB stars having solar Na and blue-HB stars being oxygen depleted and sodium enhanced (Marino et al. 2011, see also Norris 1981; Smith & Norris 1993).
Among clusters with multiple stellar populations, NGC 2808 is certainly one of the most intriguing objects. Its CMD shows three distinct MSs (Piotto et al., 2007), with the middle and the blue MS being highly enhanced in helium compared to the red MS – Y0.07 and Y0.13, respectively (D’Antona et al., 2005; Piotto et al., 2007; Milone et al., 2012d). It also hosts a multimodal HB greatly extended blue-ward (Sosin et al., 1997; Bedin et al., 2000), and a spread RGB Lee et al. (2009). Furthermore, spectroscopic studies of RGB, HB, and bright MS stars have revealed significant star-to-star differences in the light-element abundances and an extended Na-O anticorrelation (Norris, 1981; Carretta et al., 2006; Bragaglia et al., 2010).
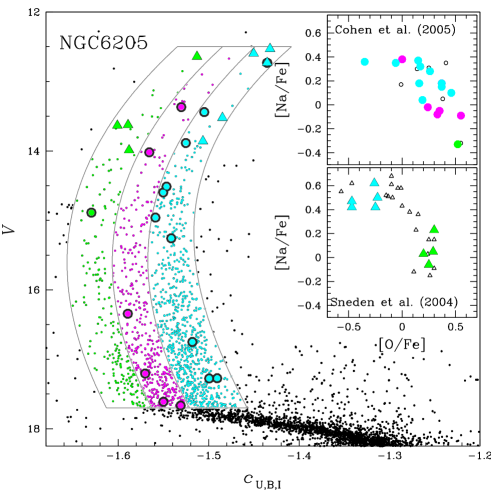
In case of NGC 6205 large ranges of light-element abundances have been found along all evolutionary phases from the RGB tip down to the MS (e. g. Shetrone, 1996; Kraft et al., 1997; Briley et al., 2002). NGC 6205 exhibits a very extended Na-O and Al-Mg anticorrelation, and a C-N correlation (see e. g. Cohen et al., 2002; Sneden et al., 2004; Smolinski et al., 2011, and references therein). The RGB is widely spread in colour in the versus CMD, with at least three components (Grundahl et al., 1998; Yong & Grundahl, 2008; Lardo et al., 2011), confirming that this cluster is made of stellar populations with different nitrogen and carbon content.
Since the seventies, spectroscopic studies of NGC 6397 giants have shown that the RGB stars exhibit a significant spread in C, N, Na, and O abundances (e.g. Bell et al., 1979; Briley et al., 1990; Pasquini et al., 2004; Carretta et al., 2009), and a bimodality in sodium and oxygen (Lind et al., 2009, 2011). Multi-band HST photometry revealed that the MS of NGC 6397 splits into two components made up of 30% and 70% of MS stars, respectively (Milone et al., 2012b), while a bimodal RGB was previously identified by Grundahl et al. (2002) and Lind et al. (2011). Multiple stellar populations along the HB have been investigated by Lovisi et al. (2012). The small colour separation of the two MSs implies that the two stellar populations differ in helium by Y0.01 (di Criscienzo et al., 2010; Milone et al., 2012b).
Multi-band HST photometry reveals that the MS, SGB, and RGB of NGC 6752 splits into three main components (Milone et al., 2013), in close analogy with the three distinct segments along its horizontal branch stars (Momany et al., 2002, 2004). These triple sequences are consistent with three stellar groups: a stellar population with a chemical composition similar to field halo stars (population a), a population (c) with enhanced sodium and nitrogen, depleted carbon and oxygen and enhanced helium abundance (0.03), and a population (b) with an intermediate (between population a and c) light-element composition, and slightly helium enhanced (0.01). These components contain 25% (population a), 45% (population b), and 30% (population c) of the cluster stars (see e.g. Norris, 1981; Grundahl et al., 2002; Yong et al., 2005; Carretta et al., 2007; Yong & Grundahl, 2008; Carretta et al., 2012, for spectroscopic studies on stellar populations in NGC 6752).
In NGC 7078 CN-CH, C-N, and Na-O anticorrelations have been observed
(Sneden et al., 1997; Cohen et al., 2005; Kayser et al., 2008; Pancino et al., 2010) and also a spread in the slow
neutron-capture elements (Sneden et al., 1997, 2000; Sobeck et al., 2011). The RGB is
broadened in the colour from SLOAN photometry (Lardo et al., 2011).
In
NGC 288, NGC 362, NGC 3201, NGC 4590, NGC 5904, NGC 6218, NGC 6254, NGC 6712, NGC 6809, NGC 7099, and NGC 6934 multiple stellar populations
are inferred by star-to-star light-element abundance variations
(Pancino et al., 2010; Cohen et al., 2005; Carretta et al., 2009; Martell et al., 2008; Lee et al., 2009; Kravtsov et al., 2009; Smith & Bell, 1986).
HST photometry revealed a multiple sequences along the SGB of NGC 362
Piotto et al. (2012). As for NGC 288 (Roh et al., 2011), and NGC 3201 the RGB
is multimodal or spread when observed in appropriate UV bands. In
NGC 6366, NGC 6093, NGC 6541, and NGC 6981
there is no evidence of multiple stellar populations to date, due to lack
of spectroscopic studies of light-element abundances.
3 Data acquisition, reduction, and standardization
To accomplish the goals listed previously, we started a long-term observing campaign using facilities in both the northern and southern hemispheres, namely the Isaac Newton Telescope (INT) operated by the ING in La Palma (Spain), and the 2.2m MPG/ESO telescope located in La Silla (Chile). Both telescopes are equipped with comparable large field of view cameras: the WFC - Wide Field Camera (3434, pixel scale 0.333/px) and the WFI - Wide Field Imager (3433, 0.238/px), respectively. Both telescopes have a set of Johnson filters, including the -band one.
The new data were used to complement the extensive data base maintained by one of us (P.B. Stetson, see Stetson, 2000), and in particular to add the images in the -band for a large number of clusters. So far, the data have been collected in four different observing runs at the INT, between August 2011 and August 2012, and one observing run at the 2.2m in February 2012 (complemented by few images collected in service time). We emphasize that this is a long-term, still ongoing project: the data reduction of the new data has been completed for a subset of the targets only, and first results are presented in the following sections.
The pre-reduction was performed with standard IRAF procedures to correct for bias, flat-field and fringing in the case of the -band images. The photometric reduction was performed using DAOPHOT/ALLFRAME (Stetson, 1987, 1994) simultaneously on all the data available for each cluster. Individual PSFs were modeled for each image, sampling the whole area of the chip with a large number stars (tens to hundreds), the exact number depending on the stellar density of each field. After the ALLFRAME run, resulting magnitudes were corrected aperture using DAOGROW (Stetson, 1990), using a constant correction. The calibration was performed following Stetson (2000). So far, artificial stars tests have not been performed. Table 1 presents a summary of the data relative to the clusters included in the present paper. For each target, we indicate R.A. and Dec. (from the compilation by Harris 2010), and the maximum number of images a given stars has been measured in.
4 Photometric selections and Colour-magnitude diagrams
In this section we describe the procedure followed to obtain the cleanest possible catalogue for each cluster. Stars have been selected according to the photometric error, , and sharpness parameters provided by ALLFRAME. In some cases we removed the stars located in the innermost, most crowded regions. The exact selections were optimized for each cluster.
In the following subsections, we describe the technique adopted to correct for differential reddening and decontaminate for the presence of foreground and background Galactic stars and background unresolved galaxies.
4.1 Differential reddening
We were careful about correcting our photometry for differential reddening effects by using the procedure described in Milone et al. (2009). Briefly, we first defined the ridge line for the cluster MS and RGB. For each star we identified the closest neighbours (typically 50), and for each of them we estimated the amount of shift to the red or the blue side of the fiducial sequence. This systematic colour offset is indicative of the local differential reddening. We applied this method using two CMDs: vs and vs , to have two estimates using independent colour combinations. The final reddening map, presented in Fig. 1 for the case of NGC 6121 (M4), was obtained as the mean of these two ones. The left panel shows the reddening map as a function of the XY coordinates, according to the colour code displayed at the top of the plot. In this case, we estimated that the extinction differences are of the order of 0.05 mag. The central and right panels of Fig. 1 show the vs CMD of the same cluster before and after applying the correction for differential reddening. Clearly, all the features of the CMD become better defined, and the colour spread significantly decreases, especially in the case of the SGB, RGB and HB. Photometry corrected for differential reddening has been used in all the diagrams presented in the following.
4.2 Removing contaminating sources
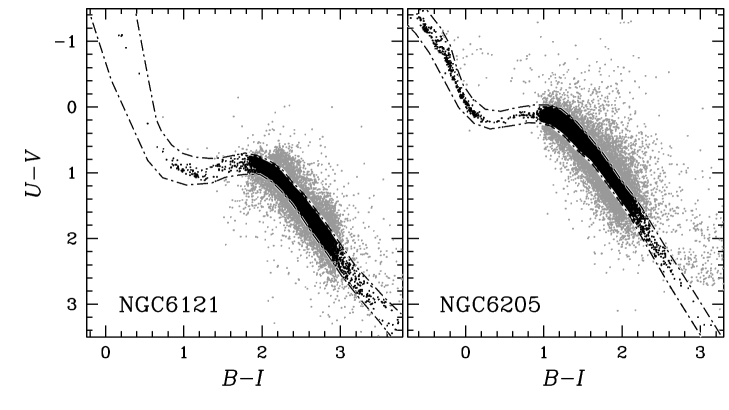
To clean the CMDs from both foreground Galactic stars and background unresolved galaxies we followed a procedure similar to Bono et al. (2010) and based on the source position in the () vs () colour-colour plane. Figure 2 shows the case of NGC 6205 and NGC 6121. The sources inside the overplotted line are considered bona-fide cluster stars, while those outside will be rejected from the following analysis. We stress that this procedure does not work equally well for every cluster. In fact, in case of more metal-rich clusters, the RGB gets redder in the colour, making more difficult to establish the separation from field stars. This is clearly seen in case of NGC 6121, where the non-negligible contamination from bulge stars cannot be completely removed, due to the superposition of the sequences in these diagrams.
4.3 Colour-Magnitude Diagrams
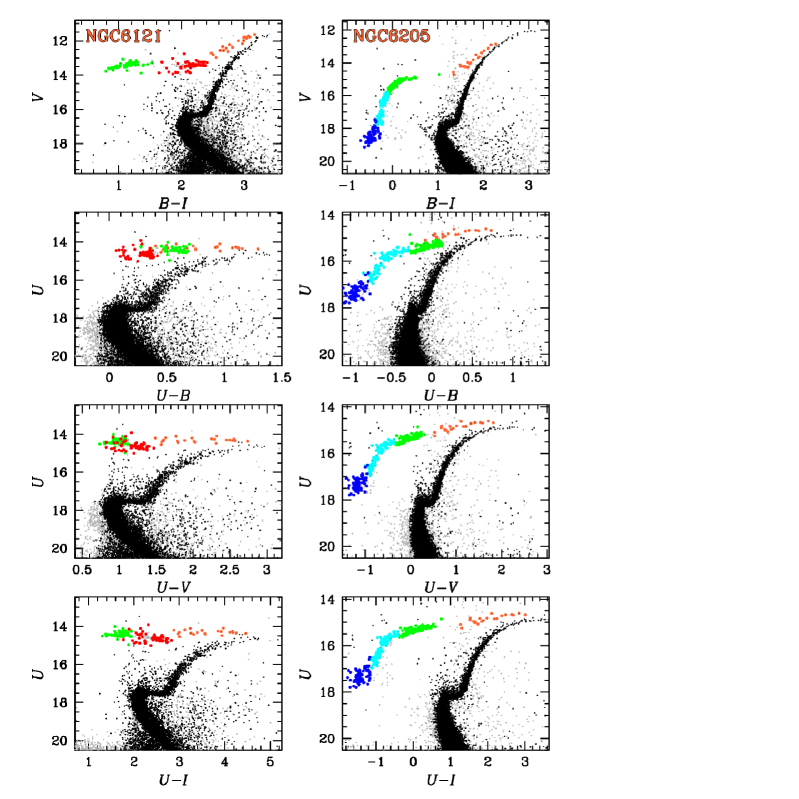
Figure 3 shows a number of different CMDs of the clusters NGC 6121 (left column) and NGC 6205 (right), adopted again as a test case, using different colour combinations. In particular, the top row presents the vs () diagrams, while the other panels display vs (), (), and (), respectively. The figure discloses that our photometry reaches 3 mag below the turn-off in the four bands. The sources rejected using the colour-colour plane are represented in light grey, while the bona-fine cluster stars are in black. We highlighted the AGB stars in orange, while HB stars are coloured according to the position relative to the ”Momany jump” (Momany et al., 2002) and the ”Grundahl jump” (Grundahl et al., 1999). In particular, blue, cyan, and green symbols represent the stars bluer than the Momany jump, intermediate, and redder than the Grundahl jump, respectively, while red dots mark the red HB stars. The selections were performed in the vs () plane. Note that in case of M 4, the red and the blue HB stars (red and green points, respectively) are swapped in the () plane. Similarly, the bluest AGB stars (orange points) gets bluer than the reddest HB stars in the same plane. This behaviour is predicted by theoretical models, and is due to the sensitivity of filter to the Balmer jump feature.
5 The index as a new diagnostic for multiple stellar populations
5.1 Definition
The selected catalogues were employed to look for the evidence of multiple stellar populations in the observed clusters. Recent studies have shown that CMDs of globulars consist of intertwined sequences of two or more stellar populations, that can be traced continuously from the MS up to the RGB and the HB (Milone et al., 2012a, c). Previous studies of stellar populations in GCs based on Strömgrem (e. g. Grundahl et al., 1999; Yong & Grundahl, 2008), multi-wavelength HST and ground-based photometry (Marino et al., 2008; Bellini et al., 2010; Milone et al., 2012a, c) have demonstrated that appropriate combinations of colours and magnitudes can be powerful techniques to isolate multiple sequences in the CMD of GCs.
The () colour is sensitive to light-element variations (Marino et al., 2008; Sbordone et al., 2011). These authors have shown that, at least in some clusters, stars enhanced in N and Na and depleted in O and C, populate the red part of the RGB in the versus () CMD, while Na/N-poor and O/C-rich stars occupy the red RGB region. A visual inspection at these diagrams reveals that the RGB is much broader than expected from photometric colour errors only, that for RGB stars are typically smaller than 0.03 mag.
The () colour is very efficient in disentangling stellar populations with different helium abundance (Piotto et al., 2007; di Criscienzo et al., 2011). Both theoretical arguments and observations show that Na/N poor stars are also helium-poor while stars enhanced in sodium and nitrogen have also higher helium abundance. Moreover, helium-rich stars have bluer () but redder () colour than helium-poor ones. Driven by these results, we introduce here a new index , defined as , that maximizes the separation among stars with different helium and light-elements content.
In the following, we will use NGC 6205 and NGC 6121 to describe the properties of the index. Figure 4 presents the vs diagram for both clusters: the left and central panels show the entire diagram and a zoom in the RGB region, respectively. In this plane, the pseudo-CMD appears reversed when compared to a typical CMD: the index gets larger (i.e. less negative) for MS stars of increasing brightness, while the SGB bends towards more negative colours. Interestingly, in the case of NGC 6121 the red HB crosses the RGB and the blue HB extends to the larger index, while in the case of NGC 6205 it is completely outside the range of the plot ( , and not shown for clarity. An homogeneous investigation of the HB morphology will be presented in a forthcoming paper.
Contrary to what shown in Fig. 3, the RGB shows a large colour spread, significantly larger that the photometric error, and multiple sequences can be recognised in both clusters. This suggests that multiple stellar populations are present and that the index is able to identify them, by splitting the RGB into multiple components. In particular, in the case of NGC 6121 Figure 4 suggests that the RGB is bimodal in the magnitude interval . We have thus drawn by hand the grey lines of Fig. 4 (top right panel) to separate two groups of stars in the magnitude bin where the RGB split is more evident (). These stars are coloured green and magenta, and named RGBa and RGBb, respectively. Also in the case of NGC 6205 the RGB is broadened, with the presence of at least three components. Similarly to what done for the case of NGC 6121, in Fig. 4 (bottom right) we have selected three groups of stars along the RGB of NGC 6205 (RGBa,b,c), that have been plotted with green, magenta, and cyan colours.
The selected populations help to understand why the is a good colour combination to split the different RGBs that otherwise are photometrically degenerate. This is shown in Fig. 5. The top three panels show the ridge lines of the two sequences detected in NGC 6121, in three different CMDs ( vs , (), ()). The same is shown for the three sequences of NGC 6205 in the central row. The crucial point is that the relative position of different ridge lines changes depending on the colour index adopted. This is clearly seen for NGC 6121, where the green line is bluer than the magenta line in , but the opposite occurs in the other two planes. A similar trend is seen in NGC 6205, where the bluest sequence in (the green line again) is the reddest in the other planes. To quantify this effect, we calculate the colour difference between the ridge lines, at a fixed magnitude level roughly corresponding to a point two magnitudes brighter than the MSTO. In particular, we fixed mag for NGC 6121 and =16.63 mag in the case of NGC 6205. We calculated the colour differences with respect of the green line: the values are reported in each panel, and we plotted them in the bottom panels of the figure as a function of the central wavelength of the adopted filter. Namely, we show the (), (), and () differences. The evidence that the ridge lines corresponding two the distinct sub-populations change their relative location in the various observational planes is reflected by the fact that the colour difference changes sign. From this plot one can immediately conclude that the colour difference is that one that maximizes the split between the different RGB sequences. Also note that the = combination can work, but less efficiently than the index. We shown an example of this in the Appendix.
We note that the index provides a pseudo-CMD morphologically similar to the index introduced by Yong et al. (2008), that combines three Ströemgren colours. The advantage of the index is, from the observational point of view, that it is based on broad-band photometry, more accessible and less time consuming than the narrow-band technique. As shown by Yong & Grundahl (2008), the index is a good tracer of the abundance of N in RGB stars. As for the case of , the reason for the efficiency of the index to split subpopulations along the RGB has to be searched in the spectral properties of the different populations. This will be discussed in §6. However, we stress here that an efficient photometric identification of different stellar populations along the RGB is the first step to guide future spectroscopic campaigns.
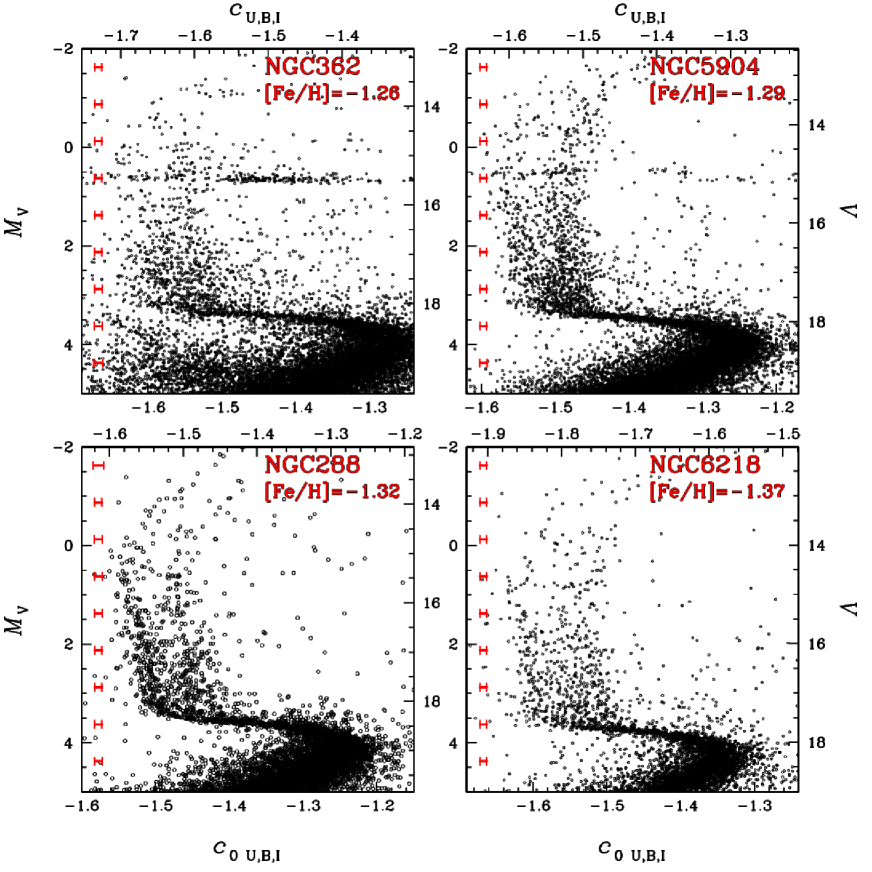
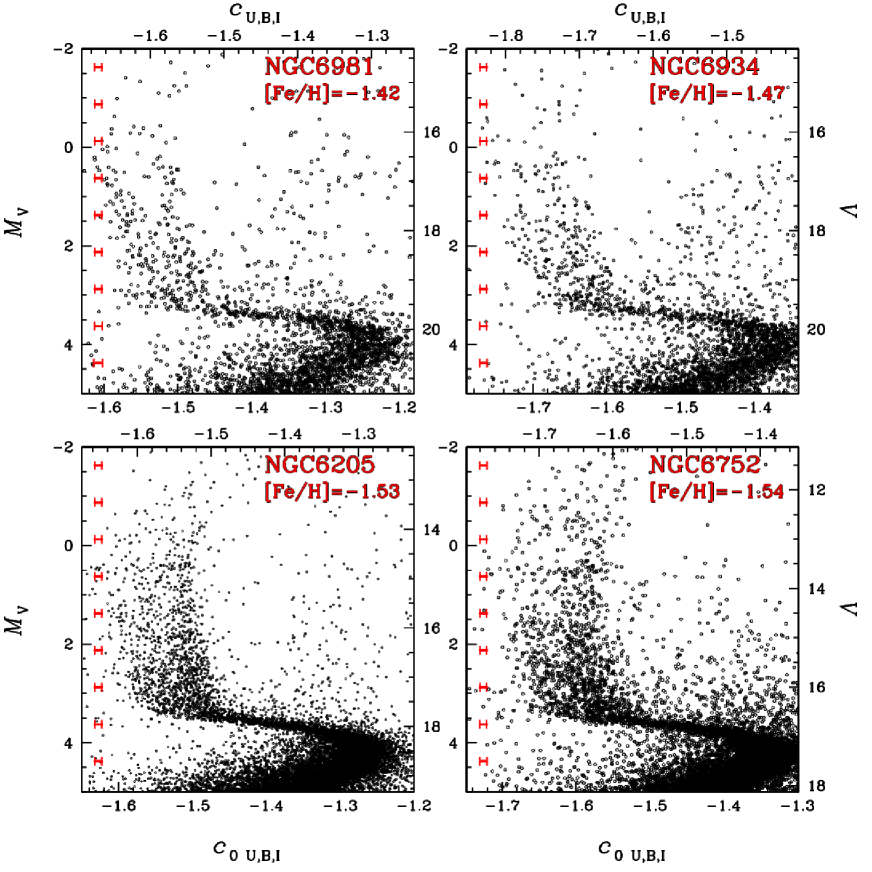
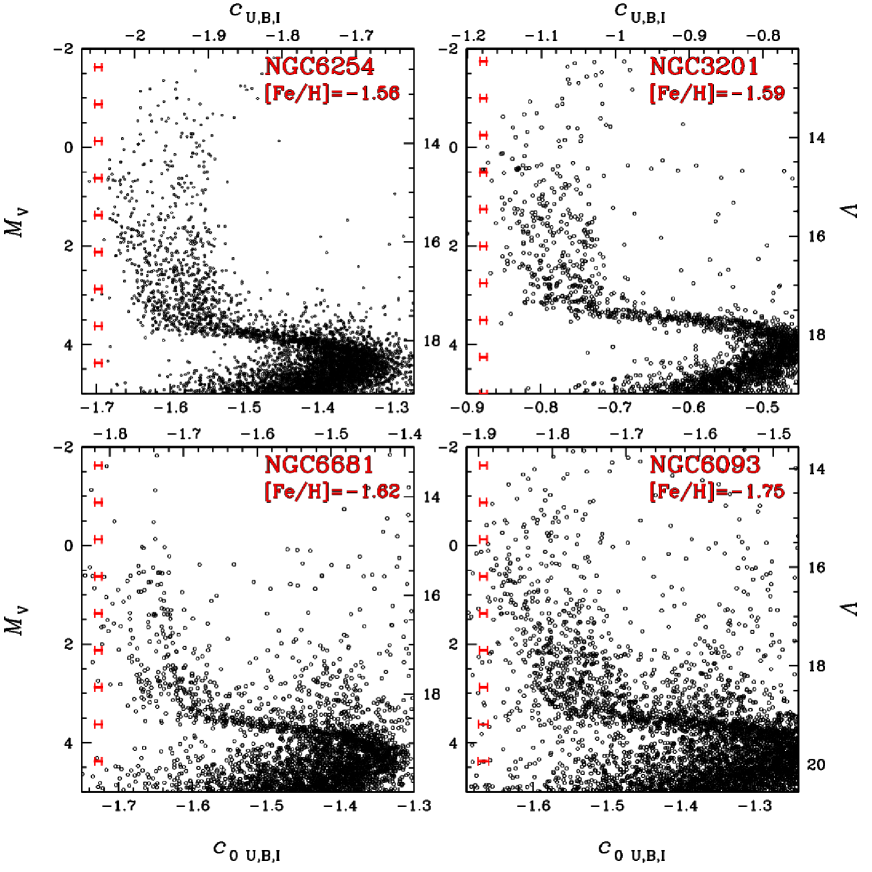
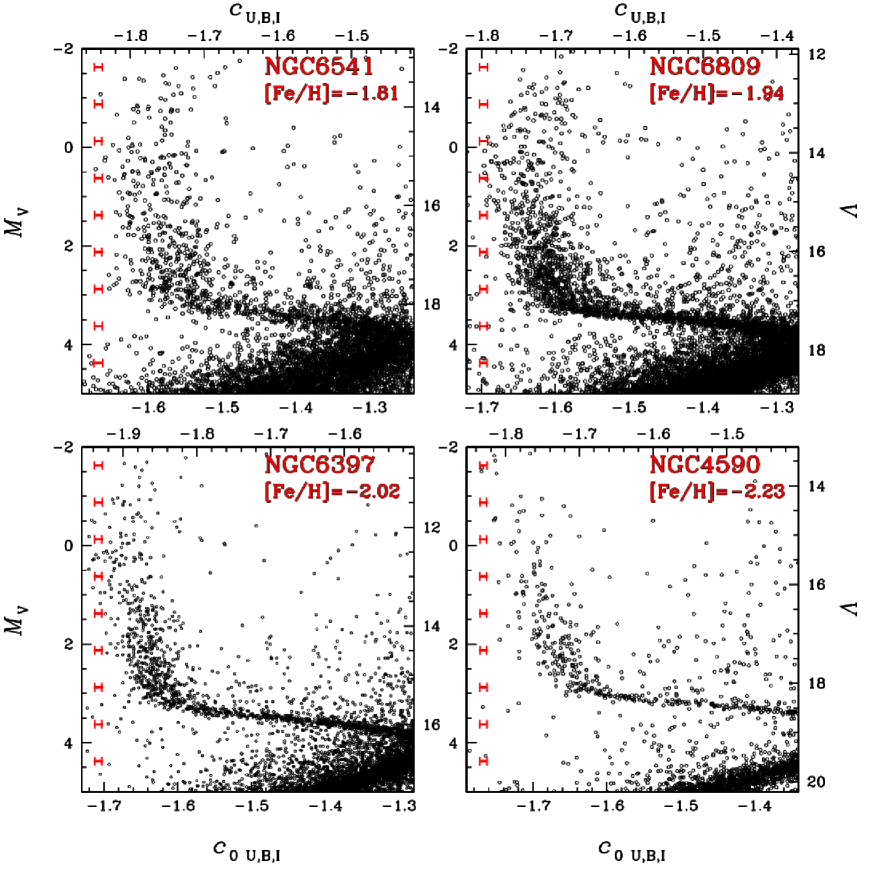
5.2 The index: multiple RGBs in 22 GCs
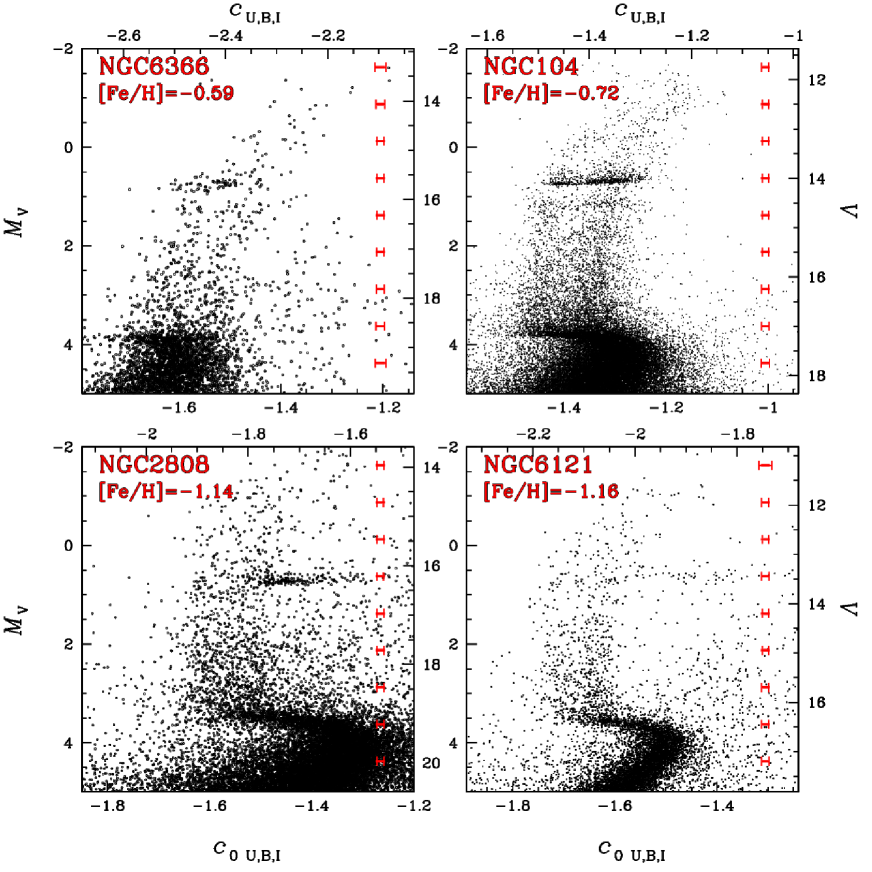
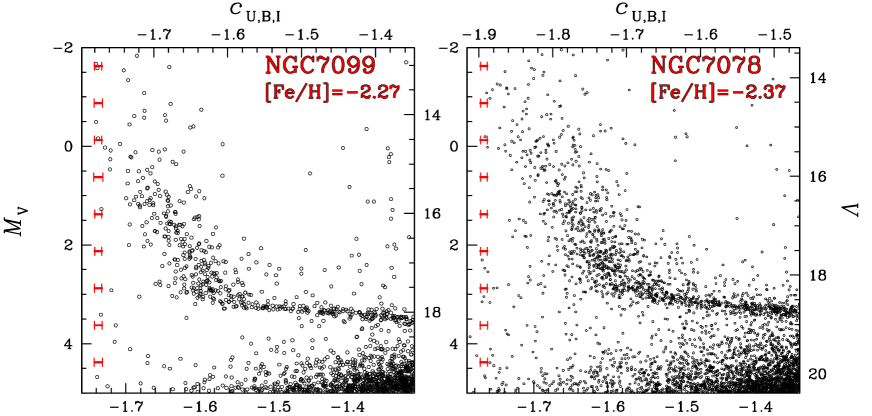
The vs diagrams for a sample of 22 clusters observed in this survey are shown in Fig. 6–11111The diagram for NGC 6712 is presented in the Appendix.. To better compare the different clusters, we have adopted the values of distance and average reddening from (Harris, 1996, updated as in 2010) and shifted the diagrams to absolute magnitudes.
Clearly, the RGBs present large colour spreads, and in most cases multiple sequences are evident. This strongly suggests that multiple stellar populations are a common feature in globular clusters. Note that the clusters are sorted for decreasing metallicity in Fig. 6–11. By comparing the pseudo-CMDs one can disclose interesting features. First of all, the slope of the RGBs in this diagram is strongly sensitive to metallicity. In fact, while the index of the RGBs in the most metal-rich clusters ([Fe/H]) gets less negative for brighter magnitudes, the more metal-poor the cluster, the more negative in index for the brightest stars. For metallicities close to [Fe/H] the RGBs are almost vertical.
Qualitatively, not only the slope but also the morphology of the RGB change from cluster to cluster. In particular, some cluster display a RGB dominated by two sub-branches, the best examples being NGC 6981 and NGC 5904, while others are characterized by a smoother distribution of stars (see NGC 2808, NGC 6205). Nevertheless, continuous does not imply homogeneous distribution. Overdensities and substructures are evident, suggesting that in all clusters there are dominant subpopulations, but in none of them the RGB appears neatly separated into several well defined sequences. The presence of a few stars in between might be due to photometric error, but we cannot exclude that they belong to tails of the distributions, with intrinsic intermediate properties.
5.3 Dependence on the clusters’properties
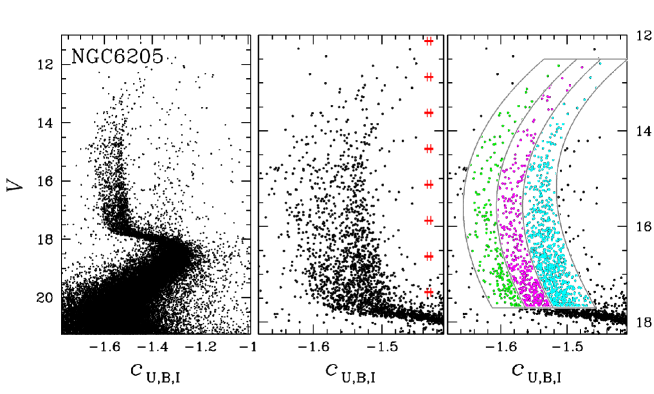
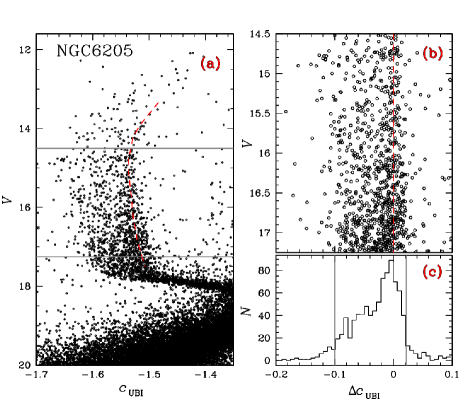
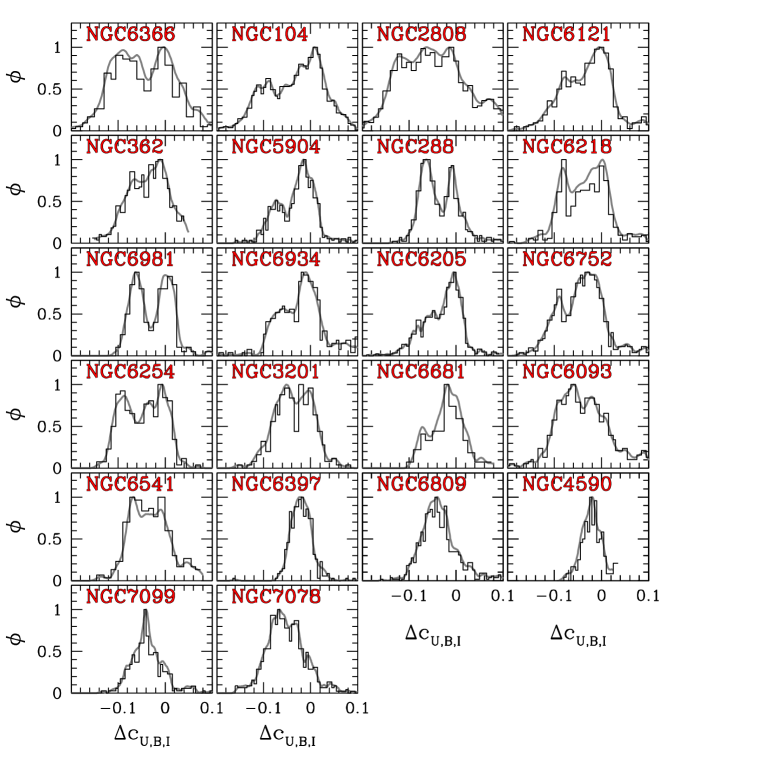
To further investigate the influence of metallicity and other cluster parameters on the multimodal RGBs, we have adopted the procedure illustrated in Fig. 12 for NGC 6205. Panel (a) is a reproduction of the Right panels of Fig. 4 showing the versus diagram zoomed around the RGB, where we have superimposed the red-dashed fiducial line, that is drawn by hand. The two gray lines are located 1.5 and 4.5 mag (in the band) above the MS turn-off and delimit the region where the RGB multimodality is better visible. Only stars in this magnitude intervals are used in the following analysis. The normalized versus diagram is plotted in panel (b), and is obtained by subtracting from the colour index of each stars the corresponding value of the fiducial at the same mag. Panel (c) shows the histogram distribution. The histogram distributions for all the clusters studied in this paper are plotted in Fig. 13 for stars in the same magnitude interval. Superimposed to each of them, we plot the kernel density distribution, obtained using a gaussian kernel. The distribution of RGB stars confirms the multimodality detected in the pseudo-CMDs. NGC 6366, NGC 104, NGC 5904, NGC 6121, NGC 6254, NGC 288, and NGC 6981 have clearly bimodal RGBs, while NGC 2808, NGC 6205, NGC 6218, and NGC 6254, present some hint of three components.
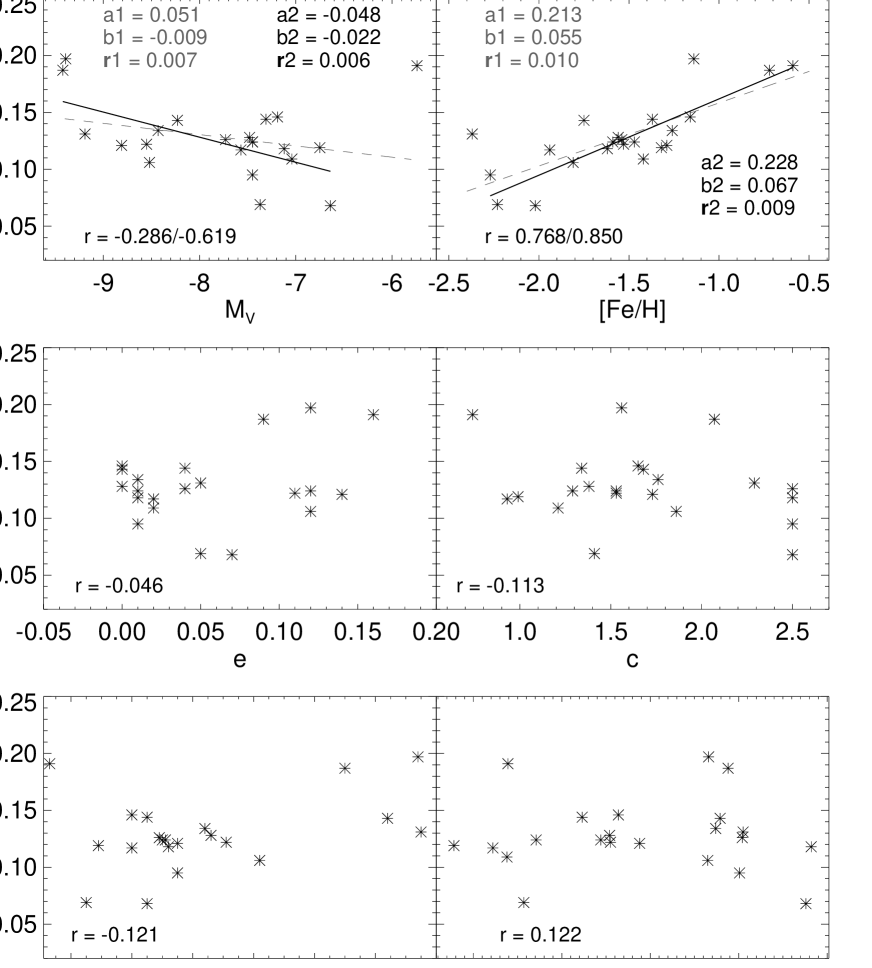
Starting from the normalized colour histogram previously defined, we defined the width of the RGB, , as the colour extension of the histogram after removing the 5% bluest and reddest stars (as an example, we see the two vertical lines in panel (c) of Fig. 12)222The outliers have been rejected to minimize the effect of field-star contamination and objects with large photometric errors on the estimate of .. The value of the index, summarized in Tab. 2, spans a limited range, from 0.06 to 0.20 mag, with mean value mag. We searched for possible correlations between the RGB width and the global clusters’parameters. We adopted the compilation by Harris (2010), and calculated the Pearson linear coefficient with a number of different parameters. Some examples are shown in Fig. 14. The three rows respectively show, from top to bottom, the trend of as a function of cluster integrated absolute visual magnitude and the iron content, the ellipticity and the concentration, the internal velocity dispersion and the central density. The Pearson coefficient is reported in each panel. In general, correlations seem to be very weak. The only two exceptions are the integrated absolute magnitude and the metallicity. Using the full set of clusters, we derive correlation coefficients r=0.286 and 0.768, respectively. In both cases, plot the linear fit together with the data points (dashed grey lines) and report the fit coefficients (zero point a1, slope b1, and dispersion ). Note that in both plots there are outliers with respect of the general trend. In the case of , seems to decrease for increasing (fainter) magnitudes, but the faintest cluster in the sample, NGC 6366, is an obvious outlier. If we remove it, the correlation improves from 0.286 to 0.619. The fit without this cluster gives a steeper relation (black line, with a2, b2, coefficients). Note that NGC 6366 is a bulge cluster, and we cannot exclude that the low luminosity is due to severe mass loss during its orbital motion.
A similar situation occurs for the dependence on the metallicity. While there is a general trend of decreasing for decreasing metallicity, the most metal-poor cluster, NGC 7078, presents a colour spread larger than expected according to that relation. Removing this object, the correlation increases from 0.768 to 0.850, resulting again in a steeper relation (black line). A possible explanation is that the colour becomes less sensitive to the colour spread of the RGB in this metal-poor regime. This could be due to the fact that more metal-poor RGBs are also bluer and hotter, and therefore the spectral features responsible for the colour spread might be weaker. However, it is worth noting that a similar anomalous behaviour of NGC 7078 was found by Pancino et al. (2010), when considering the CN-CH anticorrelations as a function of metallicity for 15 clusters.
| Cluster | vs [Na/Fe] | ||
|---|---|---|---|
| [mag] | r | ||
| NGC 104 | 0.19 | 0.48 | 0.71 |
| NGC 288 | 0.14 | 0.50 | 0.79 |
| NGC 362 | 0.13 | — | — |
| NGC 2808 | 0.20 | 0.53 | 0.79 |
| NGC 3201 | 0.10 | 0.34 | 0.60 |
| NGC 4590 | 0.07 | 0.35 | 0.38 |
| NGC 5904 | 0.12 | 0.42 | 0.75 |
| NGC 6093 | 0.14 | — | — |
| NGC 6121 | 0.14 | 0.37 | 0.87 |
| NGC 6205 | 0.12 | 0.46 | 0.90 |
| NGC 6218 | 0.13 | 0.46 | 0.81 |
| NGC 6254 | 0.13 | 0.37 | 0.73 |
| NGC 6366 | 0.19 | — | — |
| NGC 6397 | 0.07 | 0.14 | 0.40 |
| NGC 6541 | 0.11 | — | — |
| NGC 6681 | 0.12 | — | — |
| NGC 6752 | 0.10 | 0.56 | 0.93 |
| NGC 6809 | 0.12 | 0.60 | 0.67 |
| NGC 6934 | 0.12 | — | — |
| NGC 6981 | 0.11 | — | — |
| NGC 7078 | 0.13 | 0.51 | 0.44 |
| NGC 7099 | 0.10 | 0.44 | 0.37 |
Interestingly, we stress that solid evidence supports the existence of multiple populations in both NGC 6397 (the cluster with the smallest , and NGC 7078, coming from both spectroscopic (Lind et al., 2011) and photometric (Milone et al., 2012c) investigations. In particular, NGC 6397 presents small variation of light elements, in particular Na and O. This might also explain the limited colour spread of the RGB we reported here. Interestingly, when comparing the RGB morphology in the vs plots, one could speculate that the small colour spread observed in NGC 6397 is due to the absence of the red RGB, which is populated by the Na-rich, O-poor population. This is in nice agreement with the spectroscopic measurements, suggesting that the colour can be not only an effective instrument to detect multiple populations, but also to constrain the relative importance of different sub-populations in a cluster.
6 Discussion: the chemical properties of multiple sequences
To demonstrate the effectiveness of the index, in the following we will take advantage of the measurements of chemical abundance available in the literature for NGC 6121 and NGC 6205, to get information on the chemical composition of their multimodal RGBs.
Figure 15 is a reproduction of the right panels of Figure 4, zooming on the RGB of NGC 6121 (top) and NGC 6205 (bottom) in the vs plane. The colour code is the same, as well as the definition of RGBa,b and RGBa,b,c for the two clusters. In case of NGC 6121, stars with available spectroscopic measurements of Na and O from Marino et al. (2008) and Carretta et al. (2009) are plotted as circles and triangles respectively, while the Na-O anticorrelation determined by these authors is shown in the two insets. A visual inspection immediately reveals that stars from the RGBa and RGBb are clustered around two distinct values of Na and O. The RGBa has a chemical composition similar to that of halo stars, and the RGBb is populated by O-poor and Na-rich stars. Similar conclusions can be also inferred from the lower inset, showing the Na-O correlation from Carretta et al. (2009), even if the separation between RGBa and RGBb stars is less clear, likely due to the poorer accuracy of this data set.
In the case of NGC 6205, we identified three RGB components. The Na-O anticorrelations for stars of this cluster is available from Cohen et al. (2005) and Sneden et al. (2004), and is plotted in the inset. Stars with both spectroscopic and photometric measurements are marked with coloured circles and triangles. We note that the three groups of RGB stars have, on average, different abundances of Na and O. RGBa stars are Na-poor and O-rich, RGBc stars are Na-enhanced and O-depleted, and RGBb have intermediate properties. We emphasize here that the choice of the two or three groups of stars is not intended to demonstrate that these groups correspond to discrete stellar populations. The intent here is to investigate the connection between multimodal RGB and chemical composition.
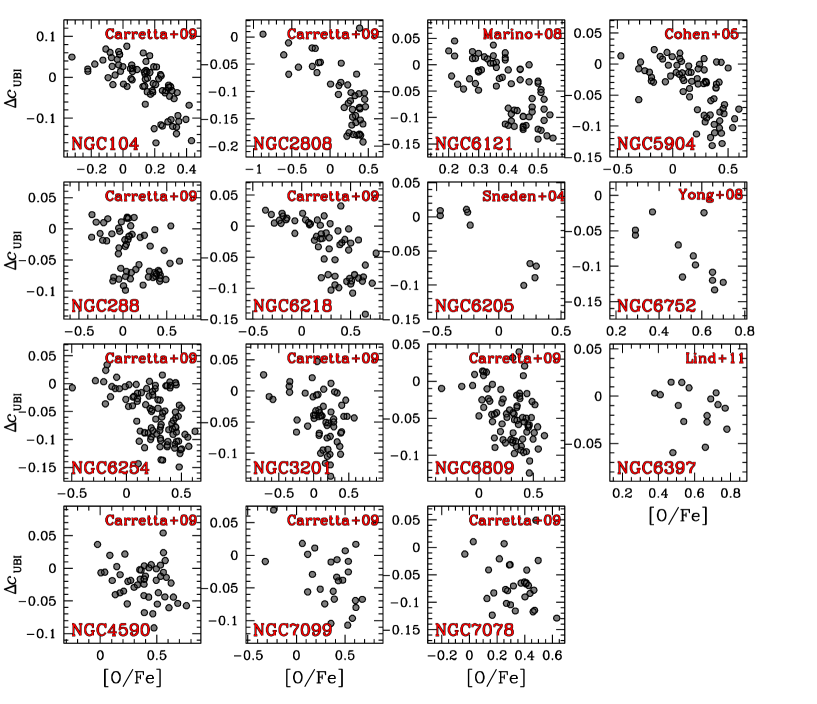
Figures 16 and 17 display versus [O/Fe] and the [Na/Fe] versus for the seventeen clusters with available spectroscopic measurements. Note that for some clusters various spectroscopic analysis are available. In these cases we only report the source which provides the smallest scatter in the [Na/Fe] versus relation. Fig. 16 shows a clear anticorrelation between and [O/Fe]. Remarkably, a similar relation between the Strömgren index and the nitrogen abundance has been observed for RGB stars of NGC 6752 by Yong et al. (2008).
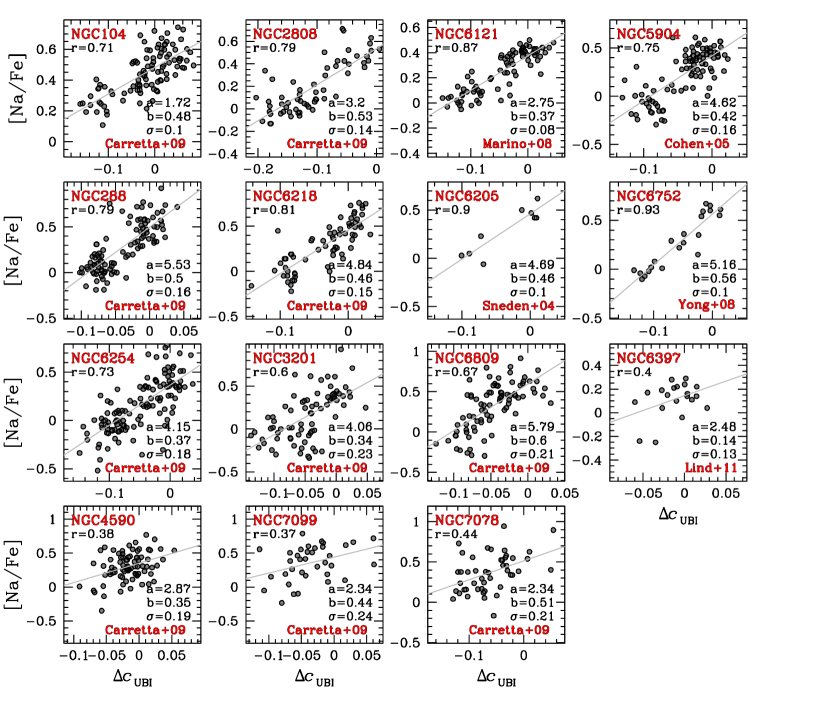
Interestingly, there appears to be a linear correlation [Na/Fe]=a+b. The values of a and b change from one cluster to the other and are shown in Fig. 17, together with the scatter around the fit. Apparently, the slope of the [Na/Fe] versus relation is different in the different clusters, and the values are reported in Tab. 2
Some hint of -Na correlation and -O anticorrelation is visible also in NGC 6397, despite the small broadening observed in this cluster. This supports the presence of multiple stellar generations. Overall, these results imply that the index can be used to trace the overall distribution of sodium, and oxygen in GCs.
6.1 New hints on the stellar populations of NGC 104
An accurate analysis of the stellar populations in each individual GC is beyond the scope of this paper. The study of NGC 104 (47 Tuc) presented in this section is only meant to emphasize, again, the effectiveness of the index. As already mentioned in Sect. 2.2, a number of recent studies have focused on the multiple stellar populations in this cluster, including works based on HST photometry and high-resolution VLT spectroscopy. In the following, we show that the ground-based photometry of the SUMO dataset can provide a view on the stellar populations in NGC 104 that is even more complex than that given by HST.
To do this, we start the discussion from the RGB, where HST and ground-based photometry revealed two distinct sequences that correspond to two stellar populations (Milone et al., 2012e). The less-populated component (population a) contains about 30% of the stars and has a chemical composition similar to the halo-field stars. The most-populated one (population b) includes the remaining 70% of stars, it is enhanced in nitrogen and helium, and depleted in carbon and oxygen.
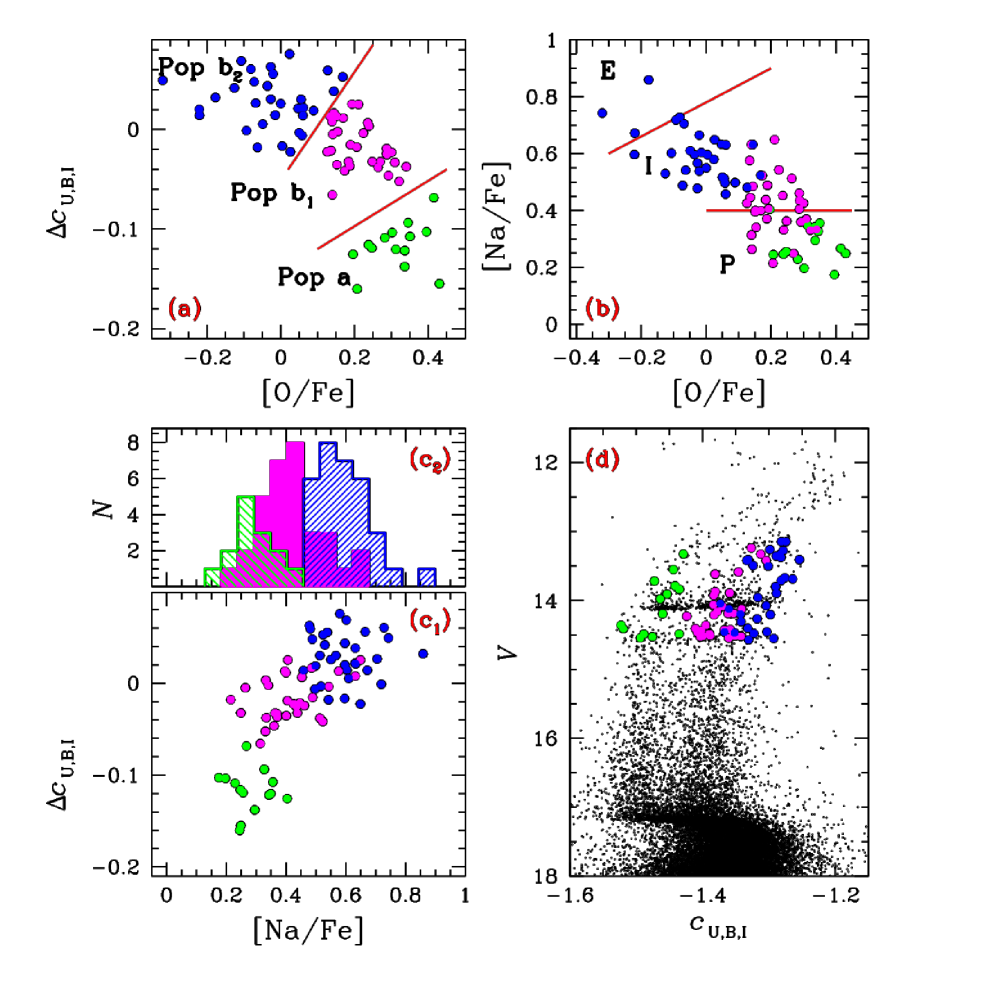
The -[O/Fe] anticorrelation of Fig. 18a confirms the presence of two stellar groups. A population of O-rich stars with low values, and a population of O-poor stars with large . These two stellar groups correspond to the populations and identified by Milone et al. (2012e). Interestingly, while stars belonging to population are fairly homogeneous in [O/Fe], population- stars span a wide range of about 0.6 dex in oxygen abundance. Hence we have further arbitrarily divided population into two subgroups, denoted as and . Population -, -, and -stars are displayed in Fig. 18a with green, magenta, and blue colour, respectively. The Na and O estimates come from Carretta et al. (2009).
These authors suggested a way to separate the cluster multiple stellar populations on the basis of their position in the Na-O plane. They defined as primordial (P) component all stars with [Na/Fe] ratio in the range between and 0.3. Here is the minimum value of the ratio [Na/Fe] ratio estimated by eye. The remaining stars are all considered second-population(s) stars, and have been further divided into two groups. Stars with ratio [O/Na]0.9 dex belong to the intermediate (I) population, while those with [O/Na]0.9 dex are defined as extreme (E) population. E, I, and P groups are separated by red lines in the [Na/Fe] vs [O/Fe] plane shown in Fig. 18b. The P component includes all the stars in population , but is strongly contaminated by population stars. Similarly, the I component contains a mix of population and population stars.
An effective way of testing the presence of a real oxygen spread amongst population stars, makes use of a comparison of independent measurements of different quantities for the same stars, like , [Na/Fe], and [O/Fe]. Specifically, if the broadening is intrinsic, population -, -, and -stars, will also differ in their sodium abundance. But if the broadening is entirely due to observational errors, the stars in the three stellar populations have the same probability of being Na-rich or Na-poor. Panel c1 of the same figure shows against [Na/Fe], and the histogram distribution of [Na/Fe] is plotted in panel . The fact that population -, -, and -stars have, on average, different sodium content, demonstrates that the oxygen spread is intrinsic and that population contains further sub-populations. The position of stars belonging to the three stellar populations in the versus diagram is shown in panel (d).
Independent support to the fact that the star formation history of NGC 104 is more complex than what inferred from previous works comes from the analysis of HB stars. Both theoretical arguments and observations have shown that, at least in some clusters, the HB morphology is strictly related to the presence of multiple stellar populations (e.g. D’Antona & Caloi, 2008; Salaris et al., 2008; Marino et al., 2011; Gratton et al., 2012). In case of NGC 104, there are two groups of CN-rich and CN-poor red-HB stars (Norris & Freeman, 1982), that define two sequences along the red HB, when observed in appropriate filters (Milone et al. 2012).
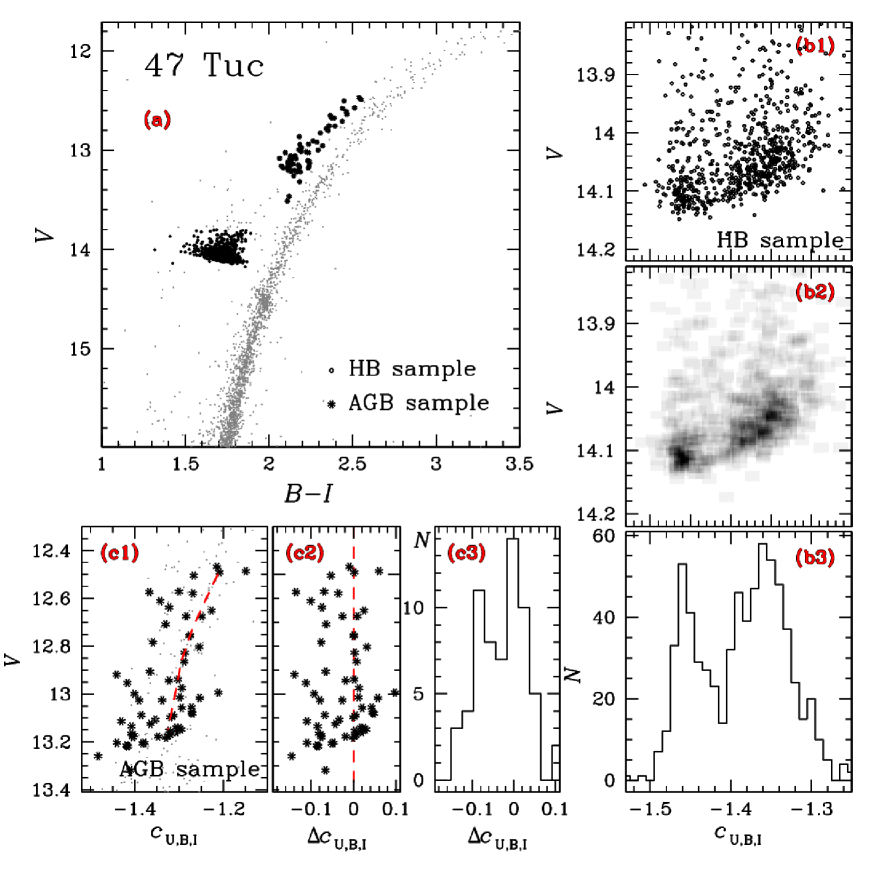
Figure 19 shows data for NGC 104. We plot in panel (a) a CMD based on wide colour baseline, with the sample of HB stars shown as black dots. In panels (b1) and (b2) we show the versus CMD and Hess diagram, respectively. The corresponding histogram of the colour distribution is shown in Panel (b3) and confirms that the HB of NGC 104 is not consistent with a simple stellar population. There are at least two groups of stars in close analogy with what observed along the RGB. A clustered blue HB, and a more dispersed red one with the presence of at least two components. Interestingly, stars in the red component are also brighter than the stars in the blue portion of the HB. Moreover, a similar conclusion can be reached also for another cluster with predominantly red HB morphology, namely NGC 6366 (see Fig. 6), that displays a bimodal HB made with similar morphology.
Though we cannot exclude that mass loss play a subtle role in shaping the complex HB morphology, it is difficult to understand why this effect would manifest in certain colours rather than in all CMDs. Nevertheless, we conclude that these results on NGC 104 provide strong direct evidence that the red-HB morphology of this GC is strictly related to hosted multiple generations, and suggest that the multiple sequences discovered in the CMDs of other GCs studied in this paper may be related to the morphology of their HBs.
Figure 19a also reveals a large number of AGB stars, are marked with black asterisks. To investigate the presence of multiple stellar populations along the AGB of 47 Tuc, panel (c1) shows the versus diagram zoomed around the AGB, with a fiducial line through the redder component. We verticalize the AGB stars in the usual way in panel (c2), while panel (c3) shows the histogram of the distribution. The bimodal distribution demonstrates that also the AGB of 47 Tuc hosts at least two stellar populations. We emphasize that this is the first detection of multiple sequences along a cluster AGB. Noteworthy, NGC 104 is the only cluster where multiple sequences have been found from the MS, to the RGB, HB, and finally along the AGB.
It has been suggested by Norris (1981) that there should exist a tight correlation between the incidence of AGB stars belonging to helium-enhanced stellar generations and the HB morphology. In particular, the observed paucity (if any) in GCs of CN-strong AGB stars could be related to the fact that these objects would be the progeny of He-enhanced HB stars – those stars populating the extended blue tail of the HB in some GCs – and given these stars would evolve preferentially as AGB-manqué objects as a consequence of their extremely thin envelopes, they would miss the AGB stage. In this context, the ability of to trace the presence of different sub-populations also along the AGB appears useful in order to investigate this issue in a large sample of clusters.
7 Conclusions
This is the first of a series of papers that will present the results of the SUMO project - a SUrvey of Multiple pOpulations in globular clusters. We focused here on a general description of the project, and the first general results. We are building a large data base of homogeneous photometry of a large number of GCs, with the main aim of characterizing and interpreting their multiple populations. This will be basis for future spectroscopic follow-up. To date, we have collected -band images for a sample of 30 clusters complementing the archive maintained by P. B. Stetson. In this paper, we have summarized the observational campaigns realized so far, the data reduction strategy, and the techniques to minimize differential reddening and polluting sources like foreground stars and background galaxies.
We have introduced a new index, , defined as the difference , that turns out to be very efficient in disentangling multiple sequences along the RGB in the range of ages and metallicities covered by selected objects. We presented results for 23 clusters, showing that showing that: i) they all display clear evidence of broadened or multiple RGBs; ii) the slope of the RGB in the V- diagrams is very sensitive to the mean cluster metallicity.
Although in those clusters where multimodal RGBs are evident, small intermediate populations always appear. These could be outliers due to photometric errors, but we cannot exclude populations with intrinsic intermediate properties. This continuous but inhomogeneous distribution seems to disfavor formation mechanisms that predict bursty formation of subpopulations.
The properties of the index were exploited to revise the behaviour of stellar populations in NGC 104, showing an overall more complex picture than previously discovered using HST data.
The effectiveness of the index was validated relating the photometric and spectroscopic properties of RGB stars in seventeen clusters. In particular, Na-rich and O-poor stars populate a RGB with larger (less negative) index than the one defined by the Na-poor, O-rich sub-population. These results demonstrate that the our photometric approach is an alternative to the spectroscopic one in the identification of GC stellar populations. In addition to this, the study of all the RGB stars provided from the wide field of view of the ground-based photometry, will allow us to investigate fundamental aspects in our understanding of multiple stellar populations, e.g. the radial distribution of different stellar groups and the real fractions of stars belonging to different stellar components. Finally, we stress that other color combinations can be used to distinguish multiple populations in the CMDs, like = . However, the separation between the different sequences is smaller than that provided by index.
acknowledgments
Support for this work was provided by the IAC (grant P/310394) and the Education and Science Ministry of Spain (grants AYA2010-16717). The research of MA is supported by Laureate Fellowship from the Australian Research Council (grant FL110100012). APM acknowledges the financial support from the Australian Research Council through Discovery Project grant DP120100475. SC acknowledges financial support from PRIN INAF 2012 (PI: E. Carretta) and PRIN MIUR 2010-2011, project “The Chemical and Dynamical Evolution of the Milky Way and Local Group Galaxies”, prot. 2010LY5N2T
References
- Anderson et al. (2009) Anderson J., Piotto G., King I. R., Bedin L. R., Guhathakurta P., 2009, ApJ, 697, L58
- Anderson (1997) Anderson J. A., 1997, PhD in Astrophysics, Univ. of California, Berkeley
- Bedin et al. (2004) Bedin L. R., Piotto G., Anderson J., Cassisi S., King I. R., Momany Y., Carraro G., 2004, ApJ, 605, L125
- Bedin et al. (2000) Bedin L. R., Piotto G., Zoccali M., Stetson P. B., Saviane I., Cassisi S., Bono G., 2000, A&A, 363, 159
- Bell et al. (1979) Bell R. A., Dickens R. J., Gustafsson B., 1979, ApJ, 229, 604
- Bellini et al. (2010) Bellini A., Bedin L. R., Piotto G., Milone A. P., Marino A. F., Villanova S., 2010, AJ, 140, 631
- Bono et al. (2010) Bono G. et al., 2010, PASP, 122, 651
- Bragaglia et al. (2010) Bragaglia A. et al., 2010, ApJ, 720, L41
- Briley et al. (1990) Briley M. M., Bell R. A., Hoban S., Dickens R. J., 1990, ApJ, 359, 307
- Briley et al. (2002) Briley M. M., Cohen J. G., Stetson P. B., 2002, ApJ, 579, L17
- Brown & Wallerstein (1992) Brown J. A., Wallerstein G., 1992, AJ, 104, 1818
- Brown et al. (1990) Brown J. A., Wallerstein G., Oke J. B., 1990, AJ, 100, 1561
- Cannon et al. (1998) Cannon R. D., Croke B. F. W., Bell R. A., Hesser J. E., Stathakis R. A., 1998, MNRAS, 298, 601
- Carretta et al. (2009) Carretta E., Bragaglia A., Gratton R., D’Orazi V., Lucatello S., 2009, A&A, 508, 695
- Carretta et al. (2006) Carretta E., Bragaglia A., Gratton R. G., Leone F., Recio-Blanco A., Lucatello S., 2006, A&A, 450, 523
- Carretta et al. (2012) Carretta E., Bragaglia A., Gratton R. G., Lucatello S., D’Orazi V., 2012, ApJ, 750, L14
- Carretta et al. (2007) Carretta E., Bragaglia A., Gratton R. G., Lucatello S., Momany Y., 2007, A&A, 464, 927
- Cohen (1978) Cohen J. G., 1978, ApJ, 223, 487
- Cohen et al. (2002) Cohen J. G., Briley M. M., Stetson P. B., 2002, AJ, 123, 2525
- Cohen et al. (2005) Cohen J. G., Briley M. M., Stetson P. B., 2005, AJ, 130, 1177
- D’Antona et al. (2005) D’Antona F., Bellazzini M., Caloi V., Pecci F. F., Galleti S., Rood R. T., 2005, ApJ, 631, 868
- D’Antona & Caloi (2008) D’Antona F., Caloi V., 2008, MNRAS, 390, 693
- D’Ercole et al. (2008) D’Ercole A., Vesperini E., D’Antona F., McMillan S. L. W., Recchi S., 2008, MNRAS, 391, 825
- di Criscienzo et al. (2011) di Criscienzo M. et al., 2011, MNRAS, 414, 3381
- di Criscienzo et al. (2010) di Criscienzo M., Ventura P., D’Antona F., Milone A., Piotto G., 2010, MNRAS, 408, 999
- Drake et al. (1992) Drake J. J., Smith V. V., Suntzeff N. B., 1992, ApJ, 395, L95
- Gratton et al. (2001) Gratton R. G. et al., 2001, A&A, 369, 87
- Gratton et al. (2012) Gratton R. G. et al., 2012, A&A, 539, A19
- Gratton et al. (1986) Gratton R. G., Quarta M. L., Ortolani S., 1986, A&A, 169, 208
- Grundahl et al. (2002) Grundahl F., Briley M., Nissen P. E., Feltzing S., 2002, A&A, 385, L14
- Grundahl et al. (1999) Grundahl F., Catelan M., Landsman W. B., Stetson P. B., Andersen M. I., 1999, ApJ, 524, 242
- Grundahl et al. (1998) Grundahl F., Vandenberg D. A., Andersen M. I., 1998, ApJ, 500, L179
- Harbeck et al. (2003) Harbeck D., Smith G. H., Grebel E. K., 2003, AJ, 125, 197
- Harris (1996) Harris W. E., 1996, AJ, 112, 1487
- Harris (2010) Harris W. E., 2010, ArXiv e-prints
- Ivans et al. (1999) Ivans I. I., Sneden C., Kraft R. P., Suntzeff N. B., Smith V. V., Langer G. E., Fulbright J. P., 1999, AJ, 118, 1273
- Kayser et al. (2008) Kayser A., Hilker M., Grebel E. K., Willemsen P. G., 2008, A&A, 486, 437
- Kraft (1978) Kraft R. P., 1978, in IAU Symposium, Vol. 80, The HR Diagram - The 100th Anniversary of Henry Norris Russell, Philip A. G. D., Hayes D. S., eds., p. 167
- Kraft et al. (1992) Kraft R. P., Sneden C., Langer G. E., Prosser C. F., 1992, AJ, 104, 645
- Kraft et al. (1997) Kraft R. P., Sneden C., Smith G. H., Shetrone M. D., Langer G. E., Pilachowski C. A., 1997, AJ, 113, 279
- Kravtsov et al. (2009) Kravtsov V., Alcaíno G., Marconi G., Alvarado F., 2009, A&A, 497, 371
- Lardo et al. (2011) Lardo C., Bellazzini M., Pancino E., Carretta E., Bragaglia A., Dalessandro E., 2011, A&A, 525, A114
- Lee et al. (2009) Lee J.-W., Kang Y.-W., Lee J., Lee Y.-W., 2009, Nature, 462, 480
- Lind et al. (2011) Lind K., Charbonnel C., Decressin T., Primas F., Grundahl F., Asplund M., 2011, A&A, 527, A148
- Lind et al. (2009) Lind K., Primas F., Charbonnel C., Grundahl F., Asplund M., 2009, A&A, 503, 545
- Lovisi et al. (2012) Lovisi L., Mucciarelli A., Lanzoni B., Ferraro F. R., Gratton R., Dalessandro E., Contreras Ramos R., 2012, ApJ, 754, 91
- Marino et al. (2009) Marino A. F., Milone A. P., Piotto G., Villanova S., Bedin L. R., Bellini A., Renzini A., 2009, A&A, 505, 1099
- Marino et al. (2011) Marino A. F., Villanova S., Milone A. P., Piotto G., Lind K., Geisler D., Stetson P. B., 2011, ApJ, 730, L16
- Marino et al. (2008) Marino A. F., Villanova S., Piotto G., Milone A. P., Momany Y., Bedin L. R., Medling A. M., 2008, A&A, 490, 625
- Martell et al. (2008) Martell S. L., Smith G. H., Briley M. M., 2008, AJ, 136, 2522
- Milone et al. (2009) Milone A. P., Bedin L. R., Piotto G., Anderson J., 2009, A&A, 497, 755
- Milone et al. (2008) Milone A. P. et al., 2008, ApJ, 673, 241
- Milone et al. (2012a) Milone A. P. et al., 2012a, ApJ, 754, L34
- Milone et al. (2013) Milone A. P. et al., 2013, ArXiv e-prints
- Milone et al. (2012b) Milone A. P., Marino A. F., Piotto G., Bedin L. R., Anderson J., Aparicio A., Cassisi S., Rich R. M., 2012b, ApJ, 745, 27
- Milone et al. (2012c) Milone A. P. et al., 2012c, A&A, 540, A16
- Milone et al. (2012d) Milone A. P., Piotto G., Bedin L. R., Cassisi S., Anderson J., Marino A. F., Pietrinferni A., Aparicio A., 2012d, A&A, 537, A77
- Milone et al. (2012e) Milone A. P. et al., 2012e, ApJ, 744, 58
- Milone et al. (2010) Milone A. P. et al., 2010, ApJ, 709, 1183
- Momany et al. (2004) Momany Y., Bedin L. R., Cassisi S., Piotto G., Ortolani S., Recio-Blanco A., De Angeli F., Castelli F., 2004, A&A, 420, 605
- Momany et al. (2002) Momany Y., Piotto G., Recio-Blanco A., Bedin L. R., Cassisi S., Bono G., 2002, ApJ, 576, L65
- Nataf et al. (2011) Nataf D. M., Gould A., Pinsonneault M. H., Stetson P. B., 2011, ApJ, 736, 94
- Norris (1981) Norris J., 1981, ApJ, 248, 177
- Norris & Freeman (1979) Norris J., Freeman K. C., 1979, ApJ, 230, L179
- Norris & Freeman (1982) Norris J., Freeman K. C., 1982, ApJ, 254, 143
- Osborn (1971) Osborn W., 1971, The Observatory, 91, 223
- Pancino et al. (2010) Pancino E., Rejkuba M., Zoccali M., Carrera R., 2010, A&A, 524, A44
- Pasquini et al. (2004) Pasquini L., Bonifacio P., Randich S., Galli D., Gratton R. G., 2004, A&A, 426, 651
- Pietrinferni et al. (2009) Pietrinferni A., Cassisi S., Salaris M., Percival S., Ferguson J. W., 2009, ApJ, 697, 275
- Piotto et al. (2007) Piotto G. et al., 2007, ApJ, 661, L53
- Piotto et al. (2012) Piotto G. et al., 2012, ApJ, 760, 39
- Roh et al. (2011) Roh D.-G., Lee Y.-W., Joo S.-J., Han S.-I., Sohn Y.-J., Lee J.-W., 2011, ApJ, 733, L45
- Salaris et al. (2008) Salaris M., Cassisi S., Pietrinferni A., 2008, ApJ, 678, L25
- Sbordone et al. (2011) Sbordone L., Salaris M., Weiss A., Cassisi S., 2011, A&A, 534, A9
- Shetrone (1996) Shetrone M. D., 1996, AJ, 112, 1517
- Smith & Bell (1986) Smith G. H., Bell R. A., 1986, AJ, 91, 1121
- Smith & Norris (1993) Smith G. H., Norris J. E., 1993, AJ, 105, 173
- Smith et al. (2005) Smith V. V., Cunha K., Ivans I. I., Lattanzio J. C., Campbell S., Hinkle K. H., 2005, ApJ, 633, 392
- Smolinski et al. (2011) Smolinski J. P., Martell S. L., Beers T. C., Lee Y. S., 2011, AJ, 142, 126
- Sneden et al. (2000) Sneden C., Johnson J., Kraft R. P., Smith G. H., Cowan J. J., Bolte M. S., 2000, ApJ, 536, L85
- Sneden et al. (2004) Sneden C., Kraft R. P., Guhathakurta P., Peterson R. C., Fulbright J. P., 2004, AJ, 127, 2162
- Sneden et al. (1997) Sneden C., Kraft R. P., Shetrone M. D., Smith G. H., Langer G. E., Prosser C. F., 1997, AJ, 114, 1964
- Sobeck et al. (2011) Sobeck J. S. et al., 2011, AJ, 141, 175
- Sollima et al. (2007) Sollima A., Beccari G., Ferraro F. R., Fusi Pecci F., Sarajedini A., 2007, MNRAS, 380, 781
- Sosin et al. (1997) Sosin C. et al., 1997, ApJ, 480, L35
- Stetson (1987) Stetson P. B., 1987, PASP, 99, 191
- Stetson (1990) Stetson P. B., 1990, PASP, 102, 932
- Stetson (1994) Stetson P. B., 1994, PASP, 106, 250
- Stetson (2000) Stetson P. B., 2000, PASP, 112, 925
- Villanova & Geisler (2011) Villanova S., Geisler D., 2011, A&A, 535, A31
- Yong & Grundahl (2008) Yong D., Grundahl F., 2008, ApJ, 672, L29
- Yong et al. (2008) Yong D., Grundahl F., Johnson J. A., Asplund M., 2008, ApJ, 684, 1159
- Yong et al. (2005) Yong D., Grundahl F., Nissen P. E., Jensen H. R., Lambert D. L., 2005, A&A, 438, 875
Appendix A The as an alternative index to identify multiple RGBs
Fig. 20 shows the case of NGC 6712 (panels a1-a4). Since the -band data are not yet available for this cluster, we used the = index. Note that the sensitivity of this index is smaller than that of the , as demonstrated by Fig. 5. In fact, the colour difference between difference sequences is smaller in () than in (). Nevertheless, it allows to identify well-defined substructures with at least two RGBs. To support this conclusion, we compare the index of NGC 6121 (panels b1-b4), which presents clear hints on multiple RGBs from the index. In particular, panels a2 and b2 present a zoom in the RGB region with superimposed the ridge line of the reddest sequence, in analogy to what presented in Fig. 12. The rectified RGBs are shown in a3) and b3), and finally the histograms showing the distribution of cubv colour differences are plotted in a4) and b4). The latter clearly shows bimodal distribution, thus supporting that also NGC 6712 hosts multiple populations.
