Main Sequence Star Populations in the Virgo Overdensity Region111Based on data collected at Subaru Telescope, which is operated by the National Astronomical Observatory of Japan.
Abstract
We present deep color-magnitude diagrams for two Subaru Suprime-Cam fields in the Virgo Stellar Stream(VSS)/Virgo Overdensity(VOD) and compare them to a field centred on the highest concentration of Sagittarius (Sgr) Tidal Stream stars in the leading arm, Branch A of the bifurcation. A prominent population of main sequence stars is detected in all three fields and can be traced as faint as mag. Using theoretical isochrone fitting we derive an age of Gyr, a median abundance of [Fe/H]= dex and a heliocentric distance of kpc for the main sequence of the Sgr Stream Branch A. The dominant main sequence populations in the two VSS/VOD fields (, ) are located at a mean distance of kpc and have an age Gyr and an abundance [Fe/H]= dex similar to the Sgr Stream stars. These statistically robust parameters, derived from photometry of 260 main sequence stars, are also in good agreement with the age of the main population in the Sagittarius dwarf galaxy ( Gyr). They also agree with the peak in the metallicity distribution of Gyr old M-giants, [Fe/H] dex, in the Sgr leading arm north. We then compare the results from the VSS/VOD fields with the Sgr Tidal Stream model by Law & Majewski based on a triaxial Galactic halo shape that is empirically calibrated with SDSS Sgr A-branch and 2MASS M giant stars. We find that the most prominent feature in the CMDs, the main sequence population at 23 kpc, is not explained by the model. Instead the model predicts in these directions a low density filamentary structure of Sgr debris stars at kpc and a slightly higher concentration of Sgr stars spread over a heliocentric distance range of kpc. At best there is only marginal evidence for the presence of these populations in our data. Our findings then suggest that while there are probably some Sgr debris stars present, the dominant stellar population in the Virgo Overdensity originates from a different halo structure that has almost identical age and metallicity as some sections of the Sgr tidal stream.
Subject headings:
Galaxies: Individual: Name: Sagittarius, Galaxy: Abundances, Galaxies: Stellar Content, Galaxy: Halo, Galaxy: Structure1. Introduction
The first decade of wide-field digital imaging has revolutionised the way the 3-D structure of the Milky Way can be mapped. The tomographic studies enabled by programs such as the Sloan Digital Sky Survey (SDSS, York et al., 2000) or the Two Micron All Sky Survey (2MASS, Skrutskie et al., 2006) have not only uncovered members from a new family of ultra-faint satellite galaxies but also revealed strong evidence for the presence of a significant amount of substructure in the halo of the Milky Way in the form of large scale stellar streams. Understanding the nature and origin of these satellite galaxies and their tidal debris has major implications for the validity of cosmological models (e.g. Kroupa et al., 2010). The most striking satellite galaxy currently undergoing tidal disruption is the Sagittarius dwarf (Ibata et al., 1994, 2001; Martínez-Delgado et al., 2001; Majewski et al., 2003). This galaxy is located approximately 16 kpc from the Galactic center (Kunder & Chaboyer, 2009), but the debris from the interaction with the Milky Way has been traced from 16–90 kpc galactocentric distance across large areas of the sky (Majewski et al., 2003; Newberg et al., 2003; Belokurov et al., 2006; Correnti et al., 2010). Layden & Sarajedini (2000) found evidence for multiple epochs of star formation in the Sgr dwarf with the principal star formation epochs at 11, 5, and 0.5–3 Gyr and associated mean abundance values of [Fe/H]=,, and , respectively. This picture was subsequently refined by Bellazzini et al. (2006) finding that more than 80 precent of Sgr stars belong to a relatively metal-rich ([Fe/H]0.7 dex) and intermediate-old age ( Gyr) population called Pop A, after Bellazzini et al. (1999) and Monaco et al. (2002).
Apart from major tidal streams, the analysis of large samples of tracers of halo substructure have further revealed the presence of numerous smaller stellar overdensities possibly associated with unknown fainter streams or merger events in the halo. In particular for the region of the Virgo constellation several detections of stellar overdensities have been reported covering the distance range 4–20 kpc. Most noticeable is a significant concentration of RR Lyrae (RRL) stars at h (Vivas et al., 2001; Vivas, 2002; Vivas & Zinn, 2003; Zinn et al., 2004; Ivezić et al., 2005) located at 19 kpc from the Sun (Duffau et al., 2006; Newberg et al., 2007; Prior et al., 2009b). This clump was also detected as an excess of metal-poor, old F-type main sequence turnoff stars by Newberg et al. (2002) and as a distinct stellar clustering labeled Vir Z by Walsh et al. (2009). Duffau et al. (2006) showed via spectroscopy that the majority of the RRL and blue horizontal branch stars in the overdense region define a kinematically cold ( 20 kms-1) feature centered on a Galactic rest frame velocity VGSR of 100 kms-1, which they labeled the “Virgo Stellar Stream” (VSS).
Furthermore, Jurić et al. (2008) and more recently Bonaca et al. (2012) detected a density enhancement over 2000 sq degrees of sky toward the Virgo constellation by means of photometric parallax distance estimates of SDSS stars. They named this large scale feature the “Virgo Overdensity” (VOD). The VOD is estimated to have a distance of kpc (Jurić et al., 2008; Vivas et al., 2008; Keller et al., 2009). In the following, we will use the term “VSS” when we are referring to the feature identified kinematically and abundance-wise, and use the term “VOD” for the spatial overdensity.
Martínez-Delgado et al. (2004, 2007) speculated that the Virgo stellar overdensity might be related to the complex debris structure of the trailing arm of the Sagittarius stream, a scenario that is supported by the Sgr Stream models for this region of the sky (Law et al., 2005; Fellhauer et al., 2006) assuming the Galactic halo potential has a spherical or oblate shape. Subsequent spectroscopic follow-up studies of a sample of these RRLs by Prior et al. (2009b) not only found further RRLs associated with the VSS, both in terms of velocity and abundance, but also revealed a population of metal-poor RRLs with large negative VGSR velocities. These stars were taken to indicate the likely presence of a population of Sgr leading tidal tail stars, which are expected to have such velocities in this region. Prior et al. (2009a) also suggested that Sgr trailing debris may make a contribution to the population at positive VGSR velocities, though it was unlikely to fully account for the VSS feature. Chou et al. (2007, 2010) have argued from a chemical abundance point-of-view for the presence of Sgr debris stars in this region.
The aim of the present paper is to provide a robust estimate of the mean age of the stellar population that dominates the VSS/VOD region by means of deep imaging in two directions close to the 12.4h clump. For that purpose we observed two Subaru Suprime-Cam fields covering 0.25 square degrees each, centered around , and , , respectively. We also observed a field away, in the direction of the highest star density of the Sagittarius Branch A leading arm. All three fields were identified by Walsh et al. (2009) as having statistically significant overdensities of point sources.
In Section 2 we describe the data acquisition, reduction and photometric calibration. The analysis of the CMDs is presented in Section 3. In Section 4 arguments are compiled for the interpretation of our measurements in the context of the VOD being dominated by the Sgr Tidal Stream. An alternative interpretation of the CMDs naturally arises from the comparison with the predictions of the Sagittarius dwarf–Milky Way halo interaction model. This is tested in Section 5. Finally, in Section 6 we summarize and discuss our conclusions.
| Field | (deg) | (deg) | (deg) | (deg) | (deg) | (deg) |
|---|---|---|---|---|---|---|
| 114513 | 176.288 | +13.95 | 250.07 | +69.68 | 247.8 | 5.2 |
| 122001 | 185.077 | 01.35 | 286.95 | +60.55 | 262.1 | 15.3 |
| 124700 | 191.992 | 00.75 | 301.07 | +62.11 | 268.6 | 11.4 |
2. Data Acquisition, Photometry and Calibration
We obtained deep , CCD images of the three fields (Table 1) using the Suprime-Cam (Miyazaki et al., 2002) on the Subaru Telescope during nights of 2009 February 22 and 23 (PI. N. Arimoto). The Suprime-Cam consists of a 5 2 array of 2048 4096 CCD detectors and provides a field-of-view of 34′ 27′with a pixel scale of 0.202″. The first night was photometric and the second night partially clear with the median seeing during both nights at 0.8″. Each field was observed in a dithered series of 5 280 s exposures in the SDSS band and 10 200 s in . Data were processed using the pipeline software SDFRED dedicated to the Suprime-Cam (Yagi et al., 2002; Ouchi et al., 2004). Each image was bias-subtracted and trimmed, flat-fielded, distortion and atmospheric dispersion corrected, sky-subtracted, and combined in the usual manner. The astrometric calibration of each passband was based on a general zenithal polynomial projection derived from astrometric standard stars selected from online USNO catalog222http://ftp.nofs.navy.mil/data/fchpix/.
SourceExtractor (Bertin & Arnouts, 1996) was employed to identify and analyse sources down to mag. The source catalogs include PSF and flux measurements inside two circular apertures (diameter: 0.8″and 1.2″) optimized for the seeing. We have tied our photometry to the SDSS photometric system by matching all the point sources from SDSS observed in our fields with our -band and -band detections. The magnitude zero-points with respect to the Galactic-extinction corrected SDSS photometry were obtained by calculating a 3- clipped mean of the magnitude differences of the unsaturated SDSS stars that were detected in our Subaru data. The comparison of typically 100–200 SDSS stars in the magnitude interval for each calibration made these zero-points statistically robust with uncertainties less than 0.01 mag.
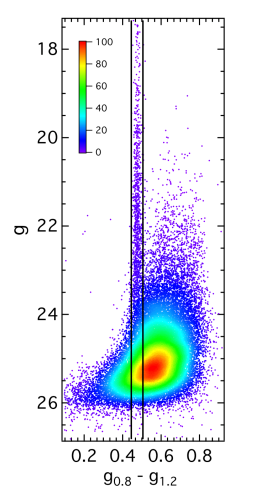
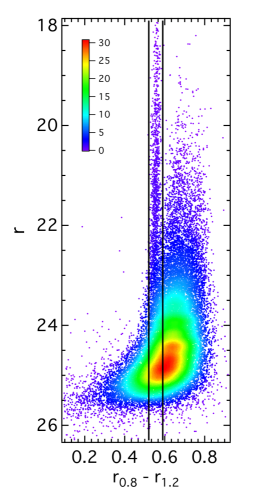
To separate stars from background galaxies and other non-stellar objects, we compare the fluxes in the two different apertures. The PSF geometry places stellar objects in a well-defined, narrow region in the magnitude–flux ratio plane. Such a plot is shown in Fig. 1 for the field. Unsaturated stars populate vertical bands centered at and , respectively. Selecting only objects with values in these two bands ensures a fair star-galaxy separation in our images down to mag, a limit that depends on the seeing. At fainter magnitudes the signal-to-noise gets too low and unresolved background galaxies blend into the region leading to an increasing level of contamination. All color-magnitude diagrams (CMDs; vs. ) shown in our study are based on aperture photometry with a 0.8″diameter aperture calibrated to the SDSS system and are restricted to objects that fall simultaneously into both stellar flux ratio intervals as determined for each field individually.
Artificial star tests were conducted to estimate the detection completeness. A catalogue of uniformly distributed simulated stars was added to each image based on measured PSF parameters and noise properties. Photometry of all the stars was then performed and typical photometric errors derived as the difference between input and computed magnitude. We calculated the fraction of simulated stars recovered at different locations across the image to test whether stellar crowding is present and how it affects the completeness of the observations. The derived completeness curves (recovery rates as a function of magnitude) did not vary across the FoV and showed a steep gradient where the 50% source completeness in the photometry is approximately 0.5 mag brighter than the limiting magnitude of mag.


3. Color-Magnitude Diagrams
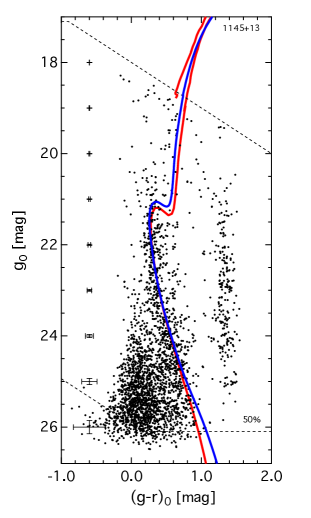
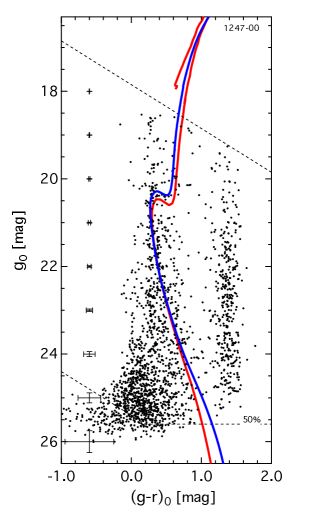
Over the observed FoV of 918 sq arcmin several thousand sources satisfy the aperture flux selection. The three CMDs (Fig. 2) show two distinct vertical plumes of Galactic stars reflecting the separation of the halo and thick disk stars at a color of and the thin disk stars at (see Fig.2a or Chen et al., 2001). Below mag and around an increasing number of unresolved background galaxies start dominating the CMDs. The Subaru photometry typically reaches down to a limiting magnitude of mag but we will restrict our analysis to the interval .
The CMDs were statistically decontaminated from unwanted Galactic stars using model CMDs generated for each field with the TRILEGAL code (Girardi et al., 2005; Vanhollebeke et al., 2009). As an example, the simulated CMD of the Galactic field in the direction of 1145+13 is shown in Fig. 2a. A comparison of the numbers of observed and predicted Galactic stars in the magnitude-color intervals , finds good agreement (Table LABEL:cmdcomp):
| Field | Observed | TRILEGAL |
|---|---|---|
| 114513 | 367 | 395 |
| 122001 | 536 | 510 |
| 124700 | 546 | 568 |
The cleaning procedure involves a process, in which a point source A in the CMD of 114513, 122000, or 124701 is removed if there is a source B in the Galactic CMD that lies within the 3 photometry uncertainty ellipse of A. Source B is also removed from the control field catalog for the rest of the process to avoid repeated use. If more than one source is found in the ellipse, the closest to A is discarded. The decontaminated CMDs are shown in Fig. 3. We note that the stars in the simulated CMD represent a single realisation of the contamination, which explains why not all Galactic stars were removed. Cleaning efficiencies of 68 percent (114513), 63 percent (122000), and 59 percent (124701) were achieved in the “pure field” part of the CMD (, ). For the color interval where the star density is higher compared to a pure field the cleaning process is expected to be more efficient because of the higher probability that an observed star matches with a star in the TRILEGAL CMD and thus is removed.
3.1. Field in the Sgr Stream Leading Arm
The tidal stream of the Sgr dwarf galaxy in the SDSS data visibly diverges westwards of to give a prominent bifurcation known as Branches A and B (Belokurov et al., 2006). Our field is located at equatorial coordinates , in the direction of the highest star density of the Sagittarius Branch A as defined by Belokurov et al. (2006). In line with expectations, our CMD (Fig. 2b) exhibits a diagonal ridge of main sequence stars in the interval , a feature that is even more pronounced in the statistically decontaminated version of the CMD (Fig. 3). The Sgr Stream population has a measured MSTO color of . We derive the age, [Fe/H], and distance of the Sagittarius Stream using a maximum likelihood method which closely follows Frayn & Gilmore (2002) and was employed to analyse the CMD of Segue 3 (Fadely et al., 2011). The fundamental assumption is that the data is dominated by a single age/metallicity population. For the procedure, a suite of isochrones are fitted to a sample of stars, assigning to each a bivariate Gaussian probability function whose variance is set by the associated photometric errors and . We apply this analysis on all stars in our decontaminated CMD. For a given isochrone we compute the likelihood
| (1) |
where is defined as:
| (2) | |||
For each star , are the magnitude, color, and de-reddened distance modulus values for isochrone that maximize the likelihood of the entire data set in Equation 2. We take an approximate solution to finding the values of and by searching over a series of fine steps in and values for each isochrone. Input isochrones are supplied by the Dartmouth library (Dotter et al., 2008), and linearly interpolated at a step size of 0.01 mag in the 2D color–magnitude space. The distance modulus is sampled over a range of in steps of 0.025 mag. To achieve the best sensitivity in the fitting process we used the isochrone segment between 0.5 mag brighter than the MSTO and 2 mag below.
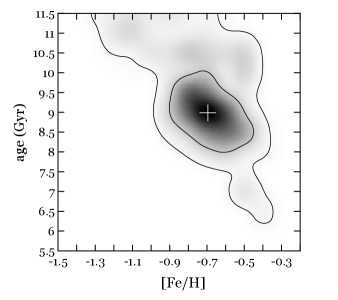
We calculate the maximum likelihood values over a grid of isochrones, covering an age range from 5.5 to 13.5 Gyr and metallicity range [Fe/H] dex. Grid steps are 0.5 Gyr in age, and 0.1 dex in [Fe/H]. With a grid of values, we can locate the most likely value and compute confidence intervals by interpolating between grid points. In addition to this interpolation, we smooth the likelihood values over grid points in order to provide a more conservative estimate of parameter uncertainties. In Figure 4, we present the relative density of likelihood values for the sample described above. We find the isochrone with the highest probability has an age of Gyr and [Fe/H] , with 68% and 95% confidence contours presented in the figure. The marginalized uncertainties (Table LABEL:MS_paras) about this most probable location correspond to an age of Gyr, a metallicity of [Fe/H] dex, and a distance modulus of mag ( kpc). They account for the varying photometric errors in the critical part of the CMD, the differences in Dartmouth isochrone shapes between 5-12 Gyr, and isochrone model variations. Other sources of uncertainties such as the systematic errors inherent in the process of isochrone fitting, small errors in the photometric zero points and, at a more fundamental level, the underlying stellar physics and stellar populations used to calibrate the theoretical isochrones mean that the error bars are in general underestimates. Nevertheless, the conclusions we can draw from the results are unaffected.
The best-fitting isochrone is overplotted as a blue line in the left panel of Fig. 3. The associated heliocentric distance of the main sequence of kpc is in excellent agreement with the estimated Sgr Stream distance of 29 kpc at that location (Belokurov et al., 2006). To illustrate that our results are independent of the chosen set of theoretical models we also present the Padova isochrone (Girardi et al., 2004) with the same age, [Fe/H], and distance (red curve). The slightly brighter turnoff and a slightly bluer lower giant branch corresponds to a metallicity difference of [Fe/H]D–[Fe/H] dex and an age difference of Gyr, well within the listed uncertainties derived from the Dartmouth isochrones. For a detailed comparison of the Dartmouth and Padova isochrones we refer to Dotter et al. (2007, 2008), but we note that the differences for low mass stars is because of differences in the treatment of the equation of state and surface boundary conditions. These differences are additional reasons why isochrone fitting was restricted to the brighter parts of the main sequence.
There is not much information currently available in the literature about the age, metallicity and color of the leading tidal tail MSTO in this part of the Sgr Stream. Carlin et al. (2012) presented the most recent results for fields in the trailing tidal tail. Their Fig. 21 shows the spectroscopic MDFs of four fields along the regime with no significant metallicity gradient observed within the uncertainties. From the numbers in their Table 6 we calculate a mean [Fe/H] of and a mean of 0.64. That range of [Fe/H] is statistically in agreement with our quoted range of [Fe/H].

| m-M | Age | [Fe/H] | ||
|---|---|---|---|---|
| Field | (mag) | (kpc) | (Gyr) | (dex) |
| 114513 | ||||
| 122001 | ||||
| 124700 |
3.2. The VSS/VOD Fields
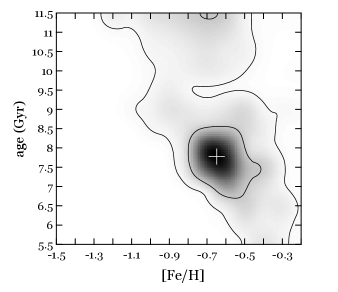
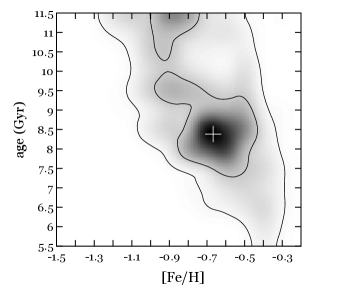
The detection algorithm used by Walsh et al. (2009) to search for new ultra-faint Milky Way dwarf satellites flagged two positions, and (see Table 1) both located in the vicinity of two fields studied by Martínez-Delgado et al. (2007) and in the general direction of the Virgo Stellar Stream/Virgo Overdensity as defined by excesses of RRL stars (Vivas et al., 2001; Vivas, 2002; Vivas & Zinn, 2003; Zinn et al., 2004; Ivezić et al., 2005) and of F-type main sequence stars (Newberg et al., 2002), spanning an R.A./Decl. range of and . The reddening corrected CMDs of and are shown in Fig. 2. Main sequences are clearly visible in the field-subtracted CMD from g20 down to 24.0 mag, almost as conspicuous as in our Sgr Stream field. Following the same procedure as described before we established the best-fitting isochrones. They are shown in Fig. 3 with the corresponding maximum likelihood solutions in Fig. 4. We derive similar ages of Gyr and Gyr and identical metallicities of [Fe/H]= and , respectively. The associated heliocentric distances are kpc and (see Table LABEL:MS_paras).
We estimate the strength of the main sequence population in the two VOD fields from star counts within mag of the best-fitting isochrone and 3 mag down the MS from the turn-off. These numbers are listed in Table LABEL:paras together with the corresponding percentages normalised to the 249 stars found in the Sgr Stream field. The quoted uncertainties are the standard error. Although the VOD fields are away from the main ridge of the Sgr Tidal Stream we observe only a moderate drop in MS star counts to about 50 percent.
Chou et al. (2010) pointed out that the lack of metal-rich RRL stars could mean that the entire VSS/VOD stellar population is metal-poor. With this point as a base, we investigate the possible presence of an old, metal-poor stellar population in the 122001 and 124700 CMDs. For that purpose, we take the estimates of to for the metallicity of VSS/VOD RRL stars (Duffau et al., 2006; Prior et al., 2009a; An et al., 2009), adopt an age of 11.2 Gyr, and distance of 19 kpc (Duffau et al., 2006; Newberg et al., 2007; Bell et al., 2008; Prior et al., 2009a) and overplot in the CMDs the corresponding Dartmouth and Padova isochrones (Fig. 5). In both CMDs, the MSTO region of the old, metal-poor isochrones seems to match a small group of stars at . However, the bright main sequence stars that would go with this feature are mostly absent for about mag below the turn-off until the two isochrones merge with the best-fitting isochrones. The lack of such bright main sequence stars in the interval that could be associated to the VSS/VOD suggests that the nearer population, i.e. at 19 kpc, is small at best when compared to the slightly more distant main sequence stars at kpc.
To quantitatively assess the possibility that some of the stars above the MSTO ( in Fig. 3) are from a smaller VOD stellar population located a few kpc closer along the line-of-sight we count stars around the MSTO with colors in the decontaminated CMDs. The number of stars within one magnitude above and below the MSTO are listed in Table LABEL:starstats. The 122001 and 124700 fields have marginally more stars (%) above the turn-off when compared to the 1145+13 field (%). If approximately 1/3 of the stars above the MSTO are associated to the Milky Way (i.e. leftover stars from the decontamination process), then the metal-poor, old VOD population is about 20-30% compared to the VOD main sequence stars in that part of the sky.
We now discuss possible interpretations of the results from the CMD analysis.
4. Are the VOD main sequence stars part of the Sgr tidal Stream?
Intriguingly, the statistically robust results, based on about 260 main sequence stars (, ) in the two VOD fields, are in excellent agreement with the age and metallicity derived for the MS stars in the 1145+13 field selected to be in the direction of the highest star density of the Sgr Branch A leading arm. This immediately raises the question, are the detected VOD main sequence stars part of the Sgr Tidal Stream? We find that the VOD results are in good agreement with the age for the main population in the Sagittarius dwarf ( Gyr; Bellazzini et al., 2006) and the peak in the metallicity distribution function at [Fe/H]= dex for the Gyr old M-giants in the Sgr north leading arm in the region (Chou et al., 2007). We recognise that the M-giants might be biased to higher metallicities compared to a complete RGB sample but the Bellazzini et al. study is principally based on K-giants and does not indicate any major difference with the M-giant results. We also note that the metallicity of the VOD MS stars is slightly lower when compared to the stars in the Sgr core where the metallicity distribution function has a wide spread from to super-solar and peaks at [Fe/H]= dex (Bellazzini et al., 2008). However, this difference can be explained with the reported abundance gradient along the tidal arms (Keller et al., 2010).
| Field | Counts | Strength |
|---|---|---|
| 1145 | 249 | 100% |
| 122001 | 134 | 54% |
| 124700 | 132 | 53% |


| Field | Above | Below | Percent |
|---|---|---|---|
| 1145+13 | 33 | 97 | % |
| 122001 | 38 | 82 | % |
| 124700 | 33 | 60 | % |
Consequently, based solely on the similarity between the MS population parameters derived for our VSS/VOD fields and those observed for the Sgr dwarf and the Sgr Tidal Stream stars, it would be possible to draw the conclusion that the stellar population of the complex overdense region around =12.5 h, =0 deg in the Virgo constellation is dominated by Sgr Tidal Stream main sequence stars. However, such a conclusion ignores the additional information from models of the Sgr/Galaxy interaction, which provide further constraints. These will be discussed in the next section. We note, however, that, as discussed in Section 3.2, regardless of the origin of the dominant population, our data provide little evidence for the presence of a significant separate old and metal-poor population of stars at a distance of kpc.
Finally, we like to point out that the RRLs probably associated with Sgr in this region do not pose a problem. Abundances for 14 RRLs where the association with Sgr is unambiguous (e.g. Vivas et al., 2005) are low ([Fe/H] with ). Moreover, the six Starkenburg et al. (2009) Group 1 stars, also likely Sgr objects, lie in this same part of the sky and have a similar mean abundance. This abundance is consistent with the RRLs in the VSS/VOD region (whether they are VSS objects or not). For instance, the two large negative VGSR RRLs in Prior et al. (2009b), which are likely Sgr objects, have abundances [Fe/H] similar to the Sgr RRLs of Prior et al. (2009a) and those in the Vivas et al. paper. In other words, we are not trying to deny that there is a metal-poor Sgr population, only that it is not dominant and that the mean abundance of Sgr RRL stars is a poor indicator of the mean abundance of the Sgr Stream, as the RRLs are likely older than the bulk of the Sgr stellar population.
5. Are the VOD main sequence stars from a different halo structure?
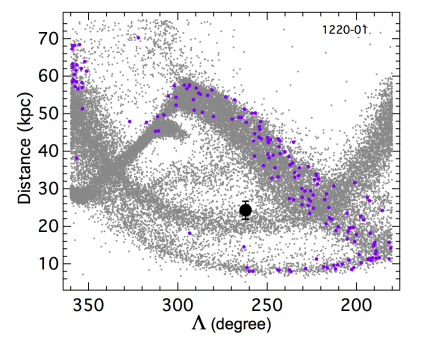
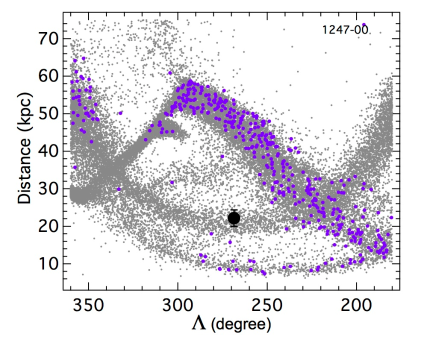
From the analysis of the deep CMDs we also gained information about the 3-D location of significant populations of main sequence stars in three well-defined directions. These geometrical anchor points allow a comparison with the currently best Sgr Tidal Stream model by Law & Majewski (2010, hereafter LM10). The N-body simulation from Law & Majewski is based on a complete all-sky view of the Sgr Stream. It is empirically calibrated with SDSS A-branch and 2MASS M giant stars and predicts the heliocentric distances and radial velocities of 100,000 particles stripped from the Sagittarius dwarf up to four orbits (approximately 3 Gyr) ago.
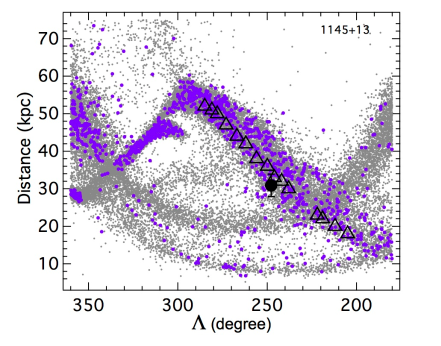
In Fig. 6 we plot heliocentric distance data as a function of orbital longitude for the simulated Sgr satellite debris from the best-fit triaxial model () within the assumptions of the simulation333http://www.astro.virginia.edu/srm4n/Sgr/data.html. The locations of the MS stars in our three fields are shown as filled circles. To illustrate the model predictions we highlight those Sgr Stream model particles that fall within half a degree of each field’s orbital latitude. The chosen width equals the observed field-of-view. The distance distribution of the model particles is bimodal in all three cases with a minor concentration at 9 kpc and a slightly larger population between kpc and kpc, respectively. The model prediction agrees well with the distance we obtained from isochrone fitting for the MS stars in the 114513 field (top panel of Fig. 6). The good match was in fact anticipated as the LM10 Sgr Tidal Stream model has been calibrated with the SDSS A-branch data from Belokurov et al. (2006) (triangles in Fig. 6). However, no agreement is found between the model and the VOD main sequence stars (filled circle in centre and bottom panels of Fig. 6): no Sgr Tidal Stream stars are expected at the distance of 23 kpc where the maximum-likelihood fit located the main sequence in the 122001 and 124700 fields. If we adopt the LM10 triaxial model as the true representation of the Sgr Tidal Stream in this part of the sky then the necessary conclusion would be that the observed MS stars at 23 kpc originate from a different stellar structure in the Milky Way halo.
Do we find traces of Sgr Stream stars in our CMDs? To guide the eye we superimpose a Dartmouth isochrone with a metallicity of [Fe/H]= and an age of 8 Gyr at distances of 9 and 47 kpc over the 122001 and 124700 CMDs in the panels of Fig. 7. Looking at the course of the isochrone in both lefthand panels we notice a diagonal ensemble of stars following the isochrone and running in parallel to the main sequence at 23 kpc from mag down to about mag. It is conceivable that these stars are indeed members of the small population of Sgr Stream stars at 9 kpc as predicted by the model. To enhance the signal we combine the CMDs of the two fields in Fig. 8. Now we can see a distinct narrow feature (, ) parallel and close to the isochrone at a distance of approximately 10 kpc. In terms of distance, small distance spread and population size this filamentary structure is suggestive of the 9 kpc Sgr Tidal Stream predicted by the LM10 model. We note that this view offers an interesting and alternative interpretation of the origin of stars brighter than the 23 kpc MSTO as it has been discussed in Section 4.1. They are main sequence stars of the Sgr Stream at 9 kpc rather than the MSTO stars of an old, metal-poor population at 19 kpc.
Moving on to the 47 kpc feature (righthand panels in Fig. 7) reveals a difference between the 122001 and 124700 CMDs. In the latter field we observe more stars scattered around the isochrone while the fewer stars in the 122001 CMD close to the isochrone lie systematically above the line. This finding is again consistent with the picture we get from the LM10 model (see Fig. 6) that predicts a population of Sgr Stream stars in the 124700 direction larger by a factor of 4.3. Hence it is conceivable that this excess of stars are indeed representatives of the Sgr Stream spread over 11 kpc () from 42-53 kpc along the line-of-sight. The bottom panel in Fig. 8 shows the scatter around the isochrone in the combined CMD. We attempted to fit the data with a second population but the dominance of the 23 kpc population and the dispersed distribution of stars produced only numerically unstable solutions. Additional data obtained over a larger field may, however, allow further validation of the Sgr Tidal Stream model and thus its use in interpreting our observations. In particular, Fig. 6 suggests that in the direction of the 124700 field, the Sgr Stream stars from the distant ( kpc) wrap are relatively frequent. Observations in this vicinity with wider area coverage may then permit a stronger identification of the predicted Sgr population than is possible with current single field.


6. Summary and Conclusions
We report the detection of a prominent population of main sequence stars in two Subaru Suprime-Cam fields and located in the overlapping region of the Virgo Stellar Stream(VSS) and the Virgo Overdensity (VOD). The main sequence stars are at a heliocentric distance of kpc and have an age of Gyr and a mean metallicity of [Fe/H]= dex as estimates from the best fitting isochrones. These parameters are similar to the age and metallicity we derived for the main stellar feature in our third Suprime-Cam field, , centered on the leading arm of the Sgr Stream, Branch A of the bifurcation. The Sgr Stream population has a MSTO color of and can be traced as faint as mag in the CMD. From isochrone fitting we infer an age of Gyr and a mean metallicity of [Fe/H]= dex. We believe they are the first measurements of these quantities for the leading tidal tail in this part of the Sgr Stream. The associated heliocentric distance of kpc agrees well with the estimated distance to the Sgr Tidal Stream in that direction of the Galactic halo as inferred from upper main sequence and turn-off stars from SDSS (Belokurov et al., 2006).
The derived parameters for the main sequence stars in the two VSS/VOD fields are also a good match to the age of the dominant stellar population (Pop A) in the Sagittarius dwarf galaxy ( Gyr; Bellazzini et al., 2006) as well as to the peak in the metallicity distribution function, [Fe/H]= dex, of the Gyr old M-giants in the Sgr north leading arm at the orbital longitude (Chou et al., 2007).
The agreement in metallicity may be taken as supporting evidence that the detected VOD main sequence stars are from the Sgr Tidal Stream, in line with the Martínez-Delgado et al. (2007) proposition (see also Prior et al., 2009a) that the Sgr debris is a major contributor to the overdensity in Virgo. Although the measured metallicity in the VSS/VOD fields ([Fe/H]= dex) is slightly more metal poor than the stars in the Sgr core where the metallicity distribution function has a spread from to super-solar and peaks at [Fe/H]= dex (Bellazzini et al., 2008), the difference is consistent with the abundance gradient along the tidal arms reported by Keller et al. (2010).
However, it must be recalled that metallicity provides only a poor constraint as other Milky Way dwarf satellites massive enough to leave a prominent stellar feature in the MW halo can be expected to have similar [Fe/H] (Kirby et al., 2008; Meisner et al., 2012). To test the hypothesis that the VOD is dominated by stars from a different halo structure, we compared the CMDs of the VSS/VOD fields with the Sgr Tidal Stream model by Law & Majewski (2010) based on a triaxial Galactic halo shape that is empirically calibrated with SDSS Sgr A-branch and 2MASS M giant stars. In the surveyed directions the model makes precise predictions about the location and strength of different wraps of the Sgr Tidal Stream: a small number of Sgr Tidal Stream stars at a distance of 9 kpc and a slightly larger population dispersed over the distance range kpc (Fig. 6). Overplotted isochrones on the CMDs at the prescribed distances (Figs. 7 and 8) indeed align with features that can be interpreted as the predicted Sgr Tidal Stream stars. The predicted number variation of the Sgr Tidal Stream stars between the two fields was also observed providing additional confidence in the Sgr Tidal Stream model. A more quantitative analysis of these features by means of isochrone fitting turned out to be unsuccessful because of the low contrast. A systematic, deep photometric study over a larger area will be necessary to collect more stars for further insight.
The major finding from the analysis of the CMDs of the two selected fields in the complex VSS/VOD region is a prominent main sequence population at 23 kpc. Given these stars are absent in the currently best-fit N-body simulation of the tidal disruption of the Sgr dwarf galaxy (Law & Majewski, 2010) an association with Sagittarius seems unlikely. These stars appear to belong to a different stellar substructure in the Galactic halo. Additionally, we find that at the VOD location this substructure has a similar age and metallicity as the Sgr Tidal Stream stars in the leading arm, Branch A of the bifurcation. With a metallicity of [Fe/H]= dex the associated stars are also significantly more metal-rich than the VSS/VOD RRL stars ([Fe/H] dex).
The authors wish to thank the anonymous referee for providing thoughtful comments that helped to improve the paper, and Renee Kraan-Korteweg for reading the early versions of the manuscript. HJ and PK acknowledge the financial support from the Go8 - DAAD - Australia/Germany Joint Research Co-operation Scheme and HJ and PT acknowledge financial support from the Access to Major Research Facilities Programme which is a component of the International Science Linkages established under the Australian Government innovation statement, Backing Australia’s Ability. This research is also supported in part by the Australian Research Council through Discovery Projects grants DP0878137 and DP120100475. BW thanks NSF AST 0908446. AJ and MZ acknowledge support from BASAL CATA PFB-06, FONDAP CFA 15010003, the Chilean Ministry for the Economy, Development, and Tourism s Programa Iniciativa Científica Milenio through grant P07-021-F, awarded to The Milky Way Millennium Nucleus, and Fondecyt REGULAR 1110393. EO acknowledges American NSF support through grant AST-0807498. The authors are grateful to David Law and Steven Majewski for making the details of their model data publicly available.
References
- An et al. (2009) An, D., Johnson, J. A., Beers, et al. 2009, ApJ, 707, L64
- Bell et al. (2008) Bell, E. F., Zucker, D. B., Belokurov, V. et al. 2008, ApJ, 680, 295
- Bellazzini et al. (2006) Bellazzini, M., Correnti, M., Ferraro, F. R., Monaco, L. & Montegriffo, P. 2006, A&A, 446, L1
- Bellazzini et al. (1999) Bellazzini, M., Ferraro, F. R. & Buonanno, R. 1999, MNRAS, 307, 619
- Bellazzini et al. (2008) Bellazzini, M., Ibata, R. A., Chapman, S. C. et al. 2008, AJ, 136, 1147
- Belokurov et al. (2006) Belokurov, V., Zucker, D. B., Evans, N. W. et al. R. 2006, ApJ, 642, L137
- Bertin & Arnouts (1996) Bertin, E., & Arnouts, S. 1996, A&AS, 117, 393
- Bonaca et al. (2012) Bonaca, A., Jurić, M., Ivezić, Z. et al. 2012, AJ, 143, 105
- Carlin et al. (2012) Carlin, J. L., Majewski, S. R., Casetti-Dinescu, D. I., et al. 2012, ApJ, 744, 25
- Chen et al. (2001) Chen, B., Stoughton, C., Smith, J. A. et al. 2001, ApJ, 553, 184
- Chou et al. (2010) Chou, M., Cunha, K., Majewski, S. R. et al. 2010, ApJ, 708, 1290
- Chou et al. (2007) Chou, M., Majewski, S. R., Cunha, K. et al. 2007, ApJ, 670, 346
- Correnti et al. (2010) Correnti, M., Bellazzini, M., Ibata, R. A., Ferraro, F. R., & Varghese, A. 2010, ApJ, 721, 329
- Dotter et al. (2007) Dotter, A., Chaboyer, B., Jevremović, D., et al. J. 2007, AJ, 134, 376
- Dotter et al. (2008) Dotter, A., Chaboyer, B., Jevremović, D. et al. 2008, ApJS, 178, 89
- Duffau et al. (2006) Duffau, S., Zinn, R., Vivas, A. K. et al. 2006, ApJ, 636, L97
- Fadely et al. (2011) Fadely, R., Willman, B., Geha, M.et al. 2011, AJ, 142, 88
- Fellhauer et al. (2006) Fellhauer, M., Belokurov, V., Evans, N. W. et al. 2006, ApJ, 651, 167
- Frayn & Gilmore (2002) Frayn, C. M., & Gilmore, G. F. 2002, MNRAS, 337, 445
- Girardi et al. (2004) Girardi, L., Grebel, E. K., Odenkirchen, M., & Chiosi, C. 2004, A&A, 422, 205
- Girardi et al. (2005) Girardi, L., Groenewegen, M. A. T., Hatziminaoglou, E., & da Costa, L. 2005, A&A, 436, 895
- Ibata et al. (2001) Ibata, R., Irwin, M., Lewis, G. F., & Stolte, A. 2001, ApJ, 547, L133
- Ibata et al. (1994) Ibata, R. A., Gilmore, G., & Irwin, M. J. 1994, Nature, 370, 194
- Ivezić et al. (2005) Ivezić, Ž., Vivas, A. K., Lupton, R. H., & Zinn, R. 2005, AJ, 129, 1096
- Jurić et al. (2008) Jurić, M., Ivezić, Ž., Brooks, A. et al. 2008, ApJ, 673, 864
- Keller et al. (2009) Keller, S. C., da Costa, G. S., & Prior, S. L. 2009, MNRAS, 394, 1045
- Keller et al. (2010) Keller, S. C., Yong, D., & Da Costa, G. S. 2010, ApJ, 720, 940
- Kirby et al. (2008) Kirby, E. N., Simon, J. D., Geha, M., Guhathakurta, P., & Frebel, A. 2008, ApJ, 685, L43
- Kroupa et al. (2010) Kroupa, P., Famaey, B., de Boer, K. S. et al. 2010, A&A, 523, 32
- Kunder & Chaboyer (2009) Kunder, A., & Chaboyer, B. 2009, AJ, 137, 4478
- Law et al. (2005) Law, D. R., Johnston, K. V., & Majewski, S. R. 2005, ApJ, 619, 807
- Law & Majewski (2010) Law, D. R., & Majewski, S. R. 2010, ApJ, 714, 229
- Layden & Sarajedini (2000) Layden, A. C., & Sarajedini, A. 2000, AJ, 119, 1760
- Majewski et al. (2003) Majewski, S. R., Skrutskie, M. F., Weinberg, M. D., & Ostheimer, J. C. 2003, ApJ, 599, 1082
- Martínez-Delgado et al. (2001) Martínez-Delgado, D., Aparicio, A., Gómez-Flechoso, M. Á., & Carrera, R. 2001, ApJ, 549, L199
- Martínez-Delgado et al. (2004) Martínez-Delgado, D., Gómez-Flechoso, M. Á., Aparicio, A., & Carrera, R. 2004, ApJ, 601, 242
- Martínez-Delgado et al. (2007) Martínez-Delgado, D., Peñarrubia, J., Jurić, M., Alfaro, E. J., & Ivezić, Z. 2007, ApJ, 660, 1264
- Meisner et al. (2012) Meisner, A.M., Frebel, A., Jurić, M., & Finkbeiner, D.P. 2012, ApJ in press (arXiv:1205.0807)
- Miyazaki et al. (2002) Miyazaki, S., Komiyama, Y., Sekiguchi, M. et al. 2002, PASJ, 54, 833
- Monaco et al. (2002) Monaco, L., Ferraro, F. R., Bellazzini, M., & Pancino, E. 2002, ApJ, 578, L47
- Newberg et al. (2007) Newberg, H. J., Yanny, B., Cole, N. et al. 2007, ApJ, 668, 221
- Newberg et al. (2003) Newberg, H. J., Yanny, B., Grebel, E. K. et al. 2003, ApJ, 596, L191
- Newberg et al. (2002) Newberg, H. J., Yanny, B., Rockosi, C.et al. 2002, ApJ, 569, 245
- Ouchi et al. (2004) Ouchi, M., Shimasaku, K., Okamura, S. et al. 2004, ApJ, 611, 660
- Prior et al. (2009a) Prior, S. L., Da Costa, G. S., & Keller, S. C. 2009a, ApJ, 704, 1327
- Prior et al. (2009b) Prior, S. L., Da Costa, G. S., Keller, S. C., & Murphy, S. J. 2009b, ApJ, 691, 306
- Skrutskie et al. (2006) Skrutskie, M. F., Cutri, R. M., Stiening, R.et al. 2006, AJ, 131, 1163
- Starkenburg et al. (2009) Starkenburg, E., Helmi, A., Morrison, H. L. et al. 2009, ApJ, 698, 567
- Vanhollebeke et al. (2009) Vanhollebeke, E., Groenewegen, M. A. T., & Girardi, L. 2009, A&A, 498, 95
- Vivas (2002) Vivas, A. K. 2002, PhD thesis, YALE UNIVERSITY
- Vivas et al. (2008) Vivas, A. K., Jaffé, Y. L., Zinn, R. et al. 2008, AJ, 136, 1645
- Vivas & Zinn (2003) Vivas, A. K., & Zinn, R. 2003, Memorie della Societa Astronomica Italiana, 74, 928
- Vivas et al. (2001) Vivas, A. K., Zinn, R., Andrews, P. et al. 2001, ApJ, 554, L33
- Vivas et al. (2005) Vivas, A. K., Zinn, R., & Gallart, C. 2005, AJ, 129, 189
- Walsh et al. (2009) Walsh, S. M., Willman, B., & Jerjen, H. 2009, AJ, 137, 450
- Yagi et al. (2002) Yagi, M., Kashikawa, N. et al. 2002, AJ, 123, 66
- York et al. (2000) York, D. G., Adelman, J., Anderson, Jr., J. E., et al. 2000, AJ, 120, 1579
- Zinn et al. (2004) Zinn, R., Vivas, A. K., Gallart, C., & Winnick, R. 2004, in Astronomical Society of the Pacific Conference Series, Vol. 327, Satellites and Tidal Streams, ed. F. Prada, D. Martinez Delgado, & T. J. Mahoney, 92