Permission to make digital or hard copies of all or part of this
work for personal or classroom use is granted without fee provided that
copies are not made or distributed for profit or commercial advantage and
that copies bear this notice and the full citation on the first page. To
copy otherwise, or republish, to post on servers or to redistribute to
lists, requires prior specific permission and/or a fee.
\confnameWebSci’13, May 2–4, 2013, Paris, France.
Copyright 2013 ACM 978-1-4503-1015-4/12/05…$10.00.
![[Uncaptioned image]](/html/1303.6271/assets/x1.png)
Schematic representation of the preferential attachment process: The probability that a tie appears between node A and another node is a function of the number of ties of the other node. In this example, probabilities of new ties (in green) are indicated by line width. In this paper, we measure this relationship between the degree and the tie creation probability, modeling it as a power with an exponent whose values we explain by the processes underlying the network.
Preferential Attachment in Online Networks:
Measurement and Explanations
Abstract
We perform an empirical study of the preferential attachment phenomenon in temporal networks and show that on the Web, networks follow a nonlinear preferential attachment model in which the exponent depends on the type of network considered. The classical preferential attachment model for networks by Barabási and Albert (1999) assumes a linear relationship between the number of neighbors of a node in a network and the probability of attachment. Although this assumption is widely made in Web Science and related fields, the underlying linearity is rarely measured. To fill this gap, this paper performs an empirical longitudinal (time-based) study on forty-seven diverse Web network datasets from seven network categories and including directed, undirected and bipartite networks. We show that contrary to the usual assumption, preferential attachment is nonlinear in the networks under consideration. Furthermore, we observe that the deviation from linearity is dependent on the type of network, giving sublinear attachment in certain types of networks, and superlinear attachment in others. Thus, we introduce the preferential attachment exponent as a novel numerical network measure that can be used to discriminate different types of networks. We propose explanations for the behavior of that network measure, based on the mechanisms that underly the growth of the network in question.
keywords:
Network analysis; preferential attachmentcategory:
H.4.0 Information Systems Applications General1 Introduction
The term preferential attachment refers to the observation that in networks that grow over time, the probability that an edge is added to a node with neighbors is proportional to . This linear relationship lies at the heart of Barabási and Albert’s scale-free network model [2], and has been used in a vast number of subsequent work to model networks, online and offline. The scale-free network model results in a distribution of degrees, i.e., number of neighbors of individual nodes, that follow a power law with negative exponent. In other words, the number of nodes with is proportional to in these networks, for a constant . While a large amount of work has been done to verify empirically the validity of such power laws of the degree distribution, relatively little work has investigated whether the initial assumption of linear preferential attachment is valid. The only such study known to the authors is that of Jeong, Néda and Barabási [29], which observes a preferential attachment function that is a power of the degree with an exponent in the range . However, that study investigates only four network datasets representing only a small subset of network types encountered on the Web, and does not explain why the networks have a specific value of the exponent, which is crucial to better understand the dynamics and social processes that underlie preferential attachment, and thus the behavior of online networks in general. Due to the availability in recent years of a large number of independent network datasets covering diverse aspects of the World Wide Web, we are able to study the behavior of forty-seven network datasets, and can interpret the observed values of the preferential attachment exponent in terms of the social processes underlying the individual networks.
The contributions of this paper are:
-
•
We provide a method for measuring the preferential attachment exponent empirically in networks for which temporal information is known.
-
•
We perform an extensive and systematic study of preferential attachment in forty-seven online networks from seven different network categories.
-
•
We give interpretations for the observed values, showing that six out of the seven network categories display preferential attachment behavior with values of the preferential attachment exponent consistently above or below the value .
-
•
We interpret these findings in terms of social processes and explain why network categories feature such consistent behavior.
The remainder of the paper is structured as follows. In Section Related Work, we give a detailed review of growth models leading to power law-like distributions, both for networks and non-network datasets. In Section Method, we introduce our method for empirically measuring the preferential attachment exponent of a given temporal network dataset. In Section Experiments, we apply our method to a collection of forty-seven temporal network datasets. Finally, in Section Explanations, we give explanations for the observed behavior.
2 Related Work
The concept of preferential attachment has received ample attention in science, in particular network science [60]. Accompanying the rise of the World Wide Web, a new generation of studies was published. Aside from renewed interest in explanatory models (starting with Barabási and Albert’s seminal Science paper in 1999 [2], see also next section), social scientists started to use the concept in order to explain social processes. Preferential attachment is generally understood as a mechanism where newly arriving nodes have a tendency to connect with already well-connected nodes [3, 43, 60].
Preferential attachment has been used to explain observations in a variety of networks. For example, Lemarchand [34] and Wagner and Leydesdorff [58] explain evolving co-authorship networks based on preferential attachment. Similarly, Barabási and colleagues [3] investigate collaboration networks in science and find that preferential attachment acts as a governance mechanism in the evolution of these networks. Also, Hanaki and colleagues [28] find that collaboration networks in the IT industry are significantly related to preferential attachment. Gay and Dousset [23] investigated the biotechnology industry, where new firms attach preferentially to older and “fitter”, i.e., more successful, firms. A still emerging field of research is that of online networks, continuing the research stream started by Barabási and Albert [2] more than a decade ago. For example, Tremayne and colleagues [56] investigated preferential attachment in the war blog network, where links from other blogs and reporting posts were significant predictors. Most recently, Faraj and Johnson [21] have investigated open source software networks and found, surprisingly, a tendency away from preferential attachment.
2.1 Power Laws and Related Distributions
Power laws and related distributions such as the lognormal and Simon–Yule distributions can be understood as the result of generative processes and are observed in many different areas, e.g., physics, biology, astronomy and economics. Kapteyn [30] and Gibrat [24] are recognized as two of the first scientists connecting generative processes with lognormal distributions, in 1916 and 1933 respectively. Champernowne [10] showed that a small change in the lognormal generative process results in a generative process with a power law distribution. Yule [63] explained the observed power law distribution of species among genera of plants. A clean explanation how preferential attachment leads to a power law distribution was given by Simon [54]. Zipf [65] found that word frequencies follow a power law distribution and Lotka [38] showed the number of written articles by authors follows a power law distribution as well.
Recent work on power law distributions is focused on graph and network structure, e.g., the World Wide Web, the Internet, collaboration networks and others in connection with preferential attachment mechanisms [1, 2, 6]. Finally, Newman [13, 45] outlined the challenges in measuring power law exponents in real data.
2.2 Nonlinear Preferential Attachment
Traditionally, the preferential attachment function is assumed to be linear, i.e., directly proportional to the node’s degree. A natural generalization is to an arbitrary function of the node degree, in particular to sub- and superlinear functions [15, 22, 33, 46].
Superlinear preferential attachment functions in trees are investigated in [52]. The asymptotic distribution of degrees has the probability for one vertex (the perpetual hub) and the probability for all other vertices. Physically, this is a gelation-like phenomenon. In [32] it is shown that a moderate superlinear preferential attachment function leads to a degenerate degree distribution in the thermodynamic limit, where one node receives almost all edges. However, in a wide range of the pre-asymptotic regime the degree distribution follows a power law distribution.
In the sublinear case of a preferential attachment function that is a power with an exponent between zero and one, a stretched exponential degree distribution is the result [15].
2.3 Measuring Preferential Attachment
In most network studies, only a static snapshot of a network is available, and thus is is not possible to verify empirically whether preferential attachment takes place. Instead, most papers study the degree distribution of a network, and interpret its specific forms as evidence for preferential attachment. All references cited in the section Power Laws and Related Distributions fall into this category.
The preferential attachment exponent itself is measured for several networks in [29], where all exponents were found in the range . Newman [44] investigated a scientific collaboration network, finding a linear preferential attachment up to a degree , and a sublinear preferential attachment beyond that value. These investigations show that a linear preferential attachment function is rarely observed in real world data, and that sub- and superlinear functions play a pivotal role in governing the network growing process attributed to the preferential attachment mechanism.
3 Method
The concept of preferential attachment has slightly different interpretations depending on the type of networks considered. In order to distinguish these different cases, we classify the networks available to us into seven categories, depending on the underlying entities and relationships represented by vertices and edges.
Although some networks are genuinely undirected, such as a friendship network, many networks represent asymmetric relationships that allow us to distinguish active and passive nodes, depending on the role they play in the creation of edges:
-
•
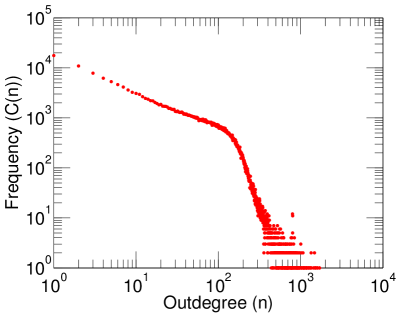
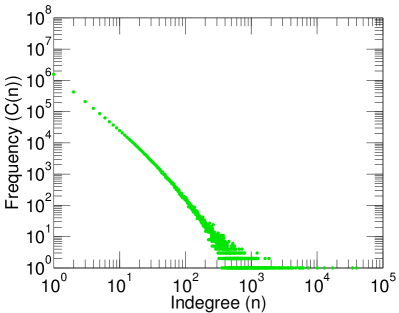
Some networks are directed, i.e., each edge possesses an intrinsic orientation from one node to another. An example is an email network, in which the nodes are persons and directed edges represent individual email messages. In such networks, the pointed-to node is the passive node and the pointing node is the active node. Thus, in the context of interpreting an edge as an attachment, it is the pointed-to node that receives the attachment. Therefore, we will only consider the indegree of nodes in these networks, i.e., the number of edges pointing to a given node.
-
•
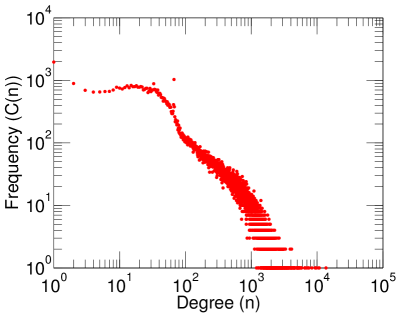
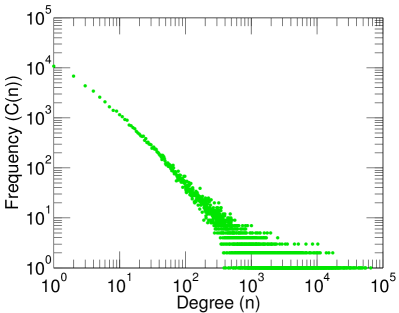
Some networks are bipartite. A bipartite network contains two kinds of vertices, and all edges connect one node type with the other. In these networks, we can distinguish between active and passive nodes. As an example, the user–song network where edges represent the “has listened to” relationship contains users (which are active) and songs (which are passive). We will thus only consider the set of passive nodes and their degrees in this case.
Note that in these two cases, the resulting degree distribution of passive nodes tends to exhibit power-law behavior much more often than the active nodes, as shown in Figure 1 with two examples. In the following, we describe the seven categories of networks we study.
Social networks
Social networks consist of persons connected by social ties such as friendship. The social networks we consider are based on online social networking sites and therefore, the considered social ties are online contacts. Social networks allow only a single edge between a given node pair, i.e., multiple edges are not allowed. Some social networks have positive and negative edges, representing positive and negative ties such as friendship and enmity, or trust and distrust. In that case, we are only interested in the presence of a tie. Some social networks are undirected, and others are directed. For directed social networks, a directed edge from person A to person B means that person A is following or otherwise connected in an unilateral way with another person. These directed connections can of course be reciprocated, in which case two edges connect a given node pair in opposite direction. Preferential attachment in a social networks results in the rule that people who already have many ties are more likely to receive new ties. In directed social networks, preferential attachment means that people who are followed by many people (i.e., are popular) are more likely to receive new followers.
Rating networks
A rating network is a bipartite network between persons and items they have rated. The nodes are persons and items, and each edge connects a person with an item, and is annotated with a rating. In the datasets we will consider, items can be movies, songs, products, jokes and even sexual escorts. Note that persons in rating networks are often called users, since the datasets are used in online recommender systems. The ratings values in rating networks will be ignored in our experiments. In other words, we consider only the information whether a person has rated an item. Rating networks usually only allow a single rating of a given item by a given person, although we also allow networks with parallel edges in this category. We also include in this category unweighted rating-like features such as persons liking items or marking them as favorites, since we ignore ratings anyway; in both cases an edge represents an endorsement (positive or negative) of an item by a person. We consider preferential attachment only of items. In other words, preferential attachment in rating networks refers to the fact that items with many items will receive more ratings in the future. Note that this statement is independent of the actual ratings given, but only refers to the information of whether a rating was or will be given.
Communication networks
A communication network consists of persons which exchange information in the form of individual messages. Since each message is represented by an edge, multiple edges connecting two persons are allowed. Edges in communication networks are always directed and can represent emails, other types of messages in social media such as “wall posts” in Facebook, or replies to another person in online forums. Preferential attachment in communication networks refers to the observation that persons who have already received many messages are more likely to receive messages in the future.
Folksonomies
Folksonomies consist of a set of tag assignments, which are person–tag–item triples that denote that a given person has assigned a given tag to a given item. Items can be as diverse as websites, movies or scientific papers. Tags are strings which are intended to describe or classify the item. We consider two types of preferential attachment types in folksonomies: preferential attachment on tags and preferential attachment on items. Preferential attachment on tags refers to the observation that tags which have been used in many tag assignments are more likely to be used in new tag assignments. On the other hand, preferential attachment on items refers to the observation that items which have been tagged often are more likely to receive tag assignments in the future. We will distinguish the two cases by simply considering them as two different bipartite networks: the person–tag network and the person–item network.
Wiki edit networks
Wiki edit networks are bipartite networks between users of wikis and the pages they edit, where each edge denotes a single edit. Wiki edit networks thus allow multiple edges between a user–page combination. All wikis considered are Wikimedia sites such as Wikipedia, Wiktionary, etc. Preferential attachment in edit networks refers to the observation that pages which have received many edits are more likely to receive many edits in the future. Note that wiki edit networks are part of the more general category of authorship networks, but that for usual (non-wiki) works, the set of authors is fixed and thus preferential attachment is impossible.
Explicit interaction networks
An explicit interaction network consists of people and interactions between them. Examples are people that meet each other, or scientists that write a paper together. Explicit interaction networks are unipartite and allow multiple edges, i.e., there can always be multiple interactions between the same two persons. They can also be both directed or undirected. Preferential attachment in explicit interaction networks refers to the observation that people who have had many interactions with other people in the past are more likely to have interactions in the future.
Implicit interaction networks
Implicit interaction networks are networks where the interaction between people is not encoded in direct ties between them, but in indirect ties through things with which people interact. Thus, an implicit interaction network is a bipartite network consisting of people and things, in which each edge represents an interaction. Examples of implicit interaction networks are people writing in forums, commenting on movies or listening to a song. In implicit interaction networks, we always allow multiple edges between the same person–thing pair. Preferential attachment in implicit interaction networks refers to the observation that things which have been interacted with many times in the past are more likely to receive interactions in the future.
3.1 Definitions
Let be an undirected, unweighted network allowing multiple edges, in which is the set of nodes and is the multiset of edges. The number of neighbors of a node is called its degree and is defined as
We explicitly allow multiple edges between two nodes, and count them separately in this definition of the degree. We ignore all edge weights, such as ratings in rating networks or the positive and negative signs of signed networks. We also allow loops, i.e., edges from a node to itself, as these may appear for instance in email networks when people send an email to themselves.
In order for preferential attachment to be observed directly (as opposed to observing the resulting degree distribution), we need to know the evolution of a given network. Thus, we need to know at which time each edge was added to the network and can then consider the evolution of the network as a function of time. We thus need to observe a temporal network at an intermediate time and at the latest known time . In this paper, we will choose such that at the time , 75% of all edges have been added to the network. This value is chosen such that is corresponds to the split used in the link prediction studies between known and unknown edges [36]. Note that preferential attachment has been exploited for implementing link prediction, under the same conditions we use here. For a given network , let be the network with the same vertex set as , and containing all edges created before . Denoting by the creation time of an edge , we have
Let be the degree of a node in , i.e.,
| (1) |
3.2 Preferential Attachment Functions
We can now give the definition of a preferential attachment function. A preferential attachment function is a function that maps the number of edges at time to the number of news edges received after . In other words, a function such that approximates for all nodes . The values returned by a preferential attachment function will be called attachment values.
Different network growth models can be expressed in terms of the preferential attachment function they are based on. We will consider all functions only up to a constant factor, since we are only interested in the relative attachment values of different vertices.
-
•
. In this model, the attachment is independent of the degree. This growth models leads to networks in which all edges are equally likely independently from each other, i.e., the Erdős–Rényi model [20]. These networks are usually simply called random graphs.
-
•
. In this model, preferential attachment is linear. This corresponds to the Barabási–Albert model of scale-free networks [2].
- •
-
•
. This model modifies the previous one in that it gives a nonzero attachment value even to nodes of zero degree [29].
In this paper, we will use the slightly more general form
in which is a regularization parameter, whose purpose will become clear in the following. The exponent will be called the preferential attachment exponent. The parameter is a multiplicative term that we can ignore since values of are to be interpreted only up to a constant factor.
3.3 Generalization of Previous Models
Individual graph growth models can be recovered by setting the parameter in the preferential attachment function to specific values.
(a) Constant case . This case is equivalent to a constant function , and thus this graph growth model results in networks in which each edge is equally likely and independent from other edges. This is the Erdős–Rényi model of random graphs [20].
(b) Sublinear case . In this case, the preferential attachment function is sublinear. This model gives rise to a stretched exponential degree distribution [15], whose exact expression is complex and given in [17, Eq. 94].
(c) Linear case . This is the scale-free network model of Barabási and Albert [2], in which attachment is proportional to the degree. This gives a power law degree distribution.
3.4 Curve Fitting
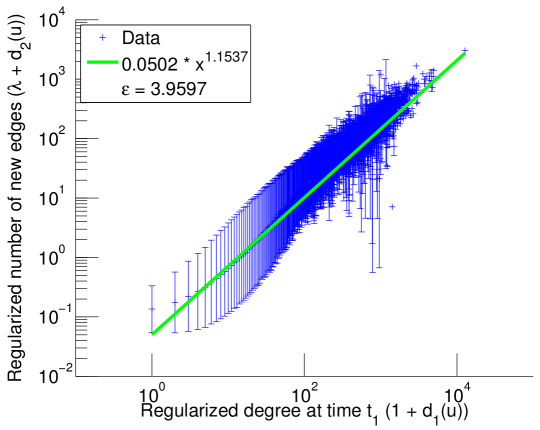
We now describe our method for estimating the value of the parameter . Since the values of the degree span several orders of magnitude, a simple least-squares curve fitting would give highly skewed results, as it would drastically over-weight high degrees. Therefore, we perform a least square fitting on the logarithmic degrees. The following minimization problem gives an estimate for the exponent .
| (2) |
The resulting value of is the estimated preferential attachment exponent. Note that due to the shift term of one and the regularization parameter , our model can both accommodate nodes with degree zero at time , as well as nodes that do not receive any new link between and .
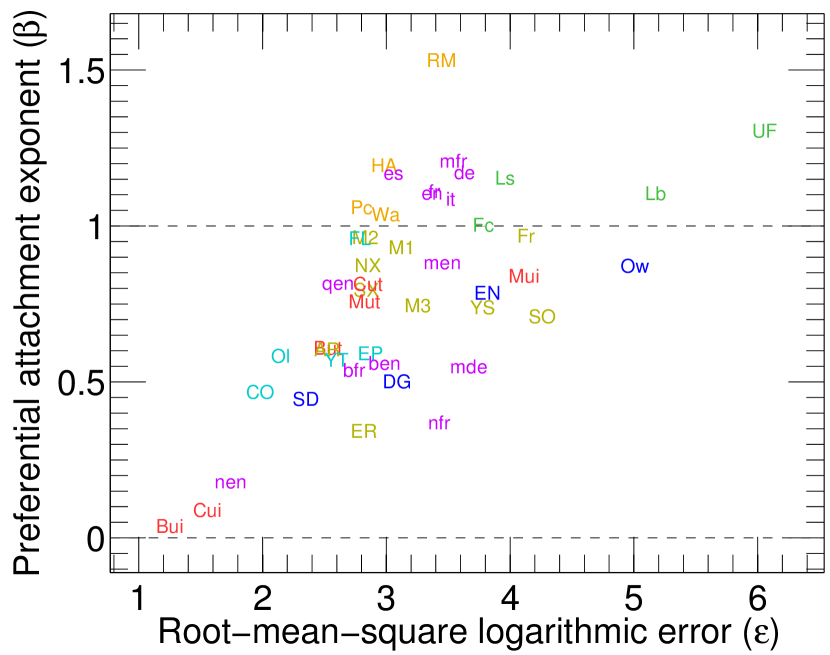
To measure the error of the fit, we define the root-mean-square logarithmic error in the following way:
This gives the average factor by which the actual new number of edges differs from the predicted value, computed logarithmically. The value of is larger or equal to one by construction.
4 Experiments
We compute an estimation of the preferential attachment exponent for forty-seven network datasets. All networks are taken from the Koblenz Network Collection (KONECT, konect.uni-koblenz.de). The full description of the networks can be read on the KONECT website111konect.uni-koblenz.de/networks. The networks we use in our experiments fulfill the following criteria:
-
•
Creation times are known for all edges.
-
•
We exclude very incomplete datasets, in which the degree distributions are skewed by the sampling method used to generate the data.
-
•
We exclude networks that are too small, i.e., have less than 10,000 edges.
Table 1 shows the list of datasets used in our experiments.
| Social networks | Flags | ||||
| [39] | EP | Epinions trust | D | 131,828 | 841,372 |
| [57] | Ol | Facebook friendships | U | 63,731 | 1,545,686 |
| [7] | CO | Wikipedia conflict | U | 118,100 | 2,985,790 |
| [40] | YT | YouTube | D | 3,223,643 | 18,524,095 |
| [41] | FL | Flickr | D | 2,302,925 | 33,140,018 |
| Rating networks | Flags | ||||
| [51] | SX | Sexual escorts | B | 16,730 | 50,632 |
| [25] | M1 | MovieLens 100k | B | 2,625 | 100,000 |
| [25] | M2 | MovieLens 1M | B | 9,746 | 1,000,209 |
| [55] | SO | Stack Overflow | B | 641,876 | 1,302,439 |
| [37] | AR | Amazon ratings | B | 3,376,972 | 5,838,041 |
| [25] | M3 | MovieLens 10M | B | 80,555 | 10,000,054 |
| [39] | ER | Epinions product ratings | B | 876,252 | 13,668,320 |
| [53] | Fr | Filmtipset | B | 144,671 | 19,554,219 |
| [4] | NX | Netflix | B | 497,959 | 100,480,507 |
| [62] | YS | Yahoo Songs | B | 1,625,951 | 256,804,235 |
| Communication networks | Flags | ||||
| [48] | UC | UC Irvine messages | D M | 1,899 | 59,835 |
| [12] | DG | Digg | D M | 30,398 | 87,627 |
| [27] | SD | Slashdot threads | D M | 51,083 | 140,778 |
| [57] | Ow | Facebook wall posts | D M | 63,891 | 876,993 |
| [31] | EN | Enron | D M | 87,273 | 1,148,072 |
| Folksonomies | Flags | ||||
| [25] | Mui | MovieLens user–movie | B M | 11,610 | 95,580 |
| [25] | Mut | MovieLens user–tag | B M | 20,537 | 95,580 |
| [5] | But | BibSonomy user–tag | B M | 210,467 | 2,555,080 |
| [5] | Bui | BibSonomy user–publication | B M | 777,084 | 2,555,080 |
| [19] | Cut | CiteULike user–tag | B M | 175,992 | 2,411,819 |
| [19] | Cui | CiteULike user–publication | B M | 754,484 | 2,411,819 |
| Wiki edit networks | Flags | ||||
| [61] | nfr | Wikinews, French | B M | 26,546 | 193,618 |
| [61] | bfr | Wikibooks, French | B M | 30,997 | 201,727 |
| [61] | qen | Wikiquote, English | B M | 116,363 | 549,210 |
| [61] | nen | Wikinews, English | B M | 173,772 | 901,416 |
| [61] | mde | Wiktionary, German | B M | 151,982 | 1,229,501 |
| [61] | ben | Wikibooks, English | B M | 167,525 | 1,164,576 |
| [61] | mfr | Wiktionary, French | B M | 1,912,264 | 7,399,298 |
| [61] | men | Wiktionary, English | B M | 2,133,892 | 8,998,641 |
| [61] | it | Wikipedia, Italian | B M | 2,393,568 | 26,241,217 |
| [61] | es | Wikipedia, Spanish | B M | 3,288,398 | 27,011,506 |
| [61] | fr | Wikipedia, French | B M | 4,310,551 | 46,168,355 |
| [61] | de | Wikipedia, German | B M | 3,620,990 | 57,323,775 |
| [61] | en | Wikipedia, English | B M | 25,323,882 | 266,769,613 |
| Explicit interaction networks | Flags | ||||
| [9] | HA | Haggle | U M | 274 | 28,244 |
| [18] | RM | Reality Mining | U M | 96 | 1,086,404 |
| [11] | Wa | D M | 2,919,613 | 12,887,063 | |
| [35] | Pc | DBLP | U M | 1,103,412 | 14,703,760 |
| Implicit interaction networks | Flags | ||||
| [49] | UF | UC Irvine forum | B M | 1,421 | 33,720 |
| [53] | Fc | Filmtipset | B M | 75,360 | 1,266,753 |
| [8] | Lb | Last.fm band | B M | 175,069 | 19,150,868 |
| [8] | Ls | Last.fm song | B M | 1,085,612 | 19,150,868 |
4.1 Methodology
For each network, we split the set of edges into the set of old edges and the set of new edges as described in Equation (1). Then, we compute the old degree for all nodes and the number of new edges . We then solve the least-squares minimization problem of Equation (2), giving an estimate of the preferential attachment exponent .
The regularization parameter is set to in our experiments.
4.2 Experimental Results
To illustrate the curve fitting procedure, we show the mean standard deviation of the logarithmic degree as a function of . Figure 2 shows this plot, along with the fitted curve, for the largest networks of six different network categories.
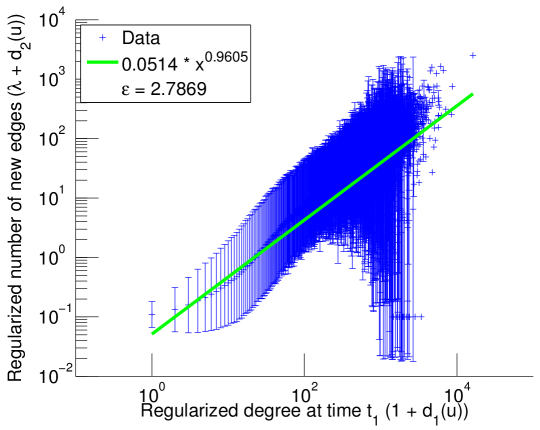
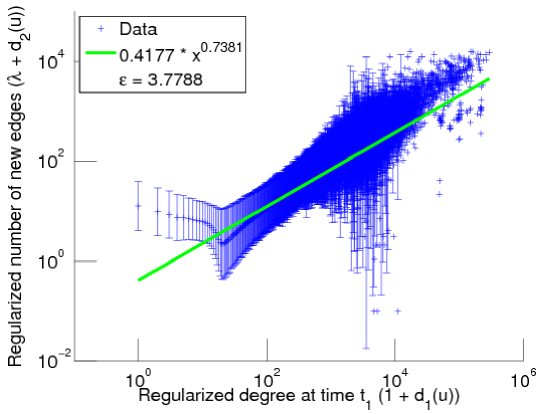

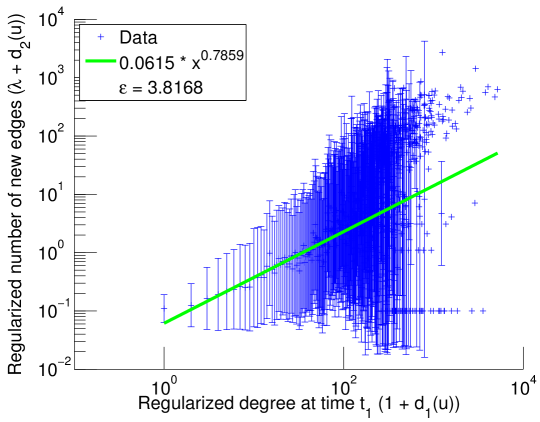
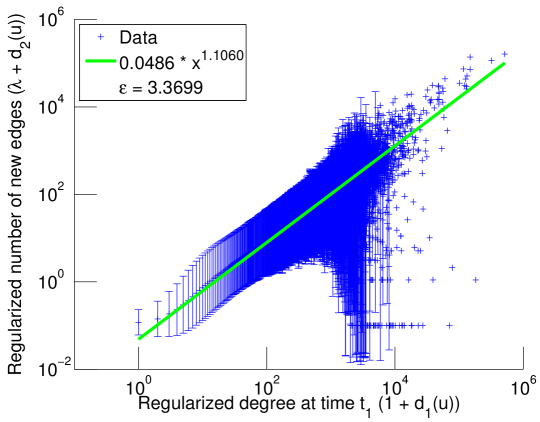
The root-mean-square logarithmic error is shown together with in Figure 3.
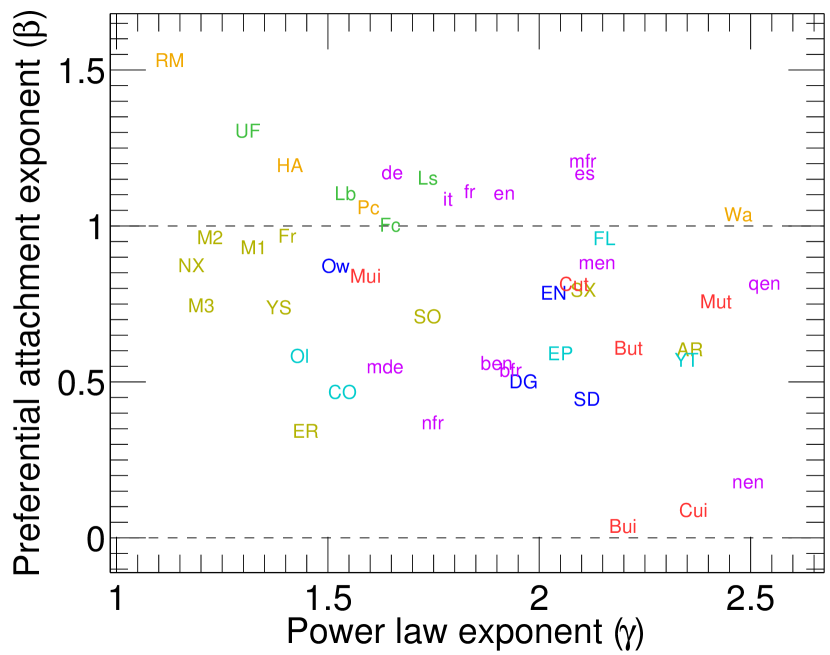
The measured preferential attachment exponents for all networks are shown in Figure 4. The estimates for the power law exponent are computed using the robust method given in [45, Eq. 5]. We note that the estimated degree distribution exponents lie in the approximate range , and are thus smaller than the usually cited range would suggest.

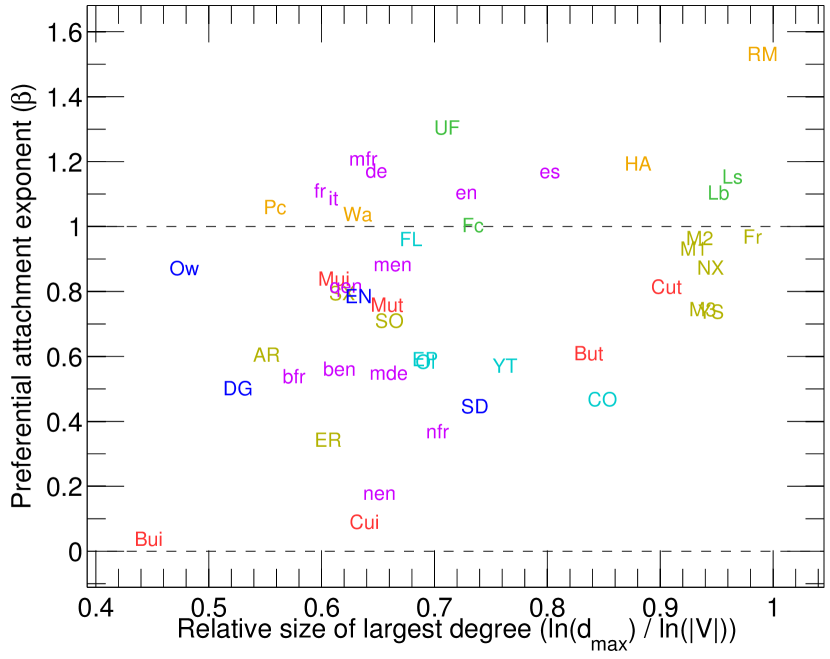
In the case of superlinear attachment, the degree distribution is predicted to converge over time to a state in which a single node dominates all other nodes, i.e., in which a single node has 100% of all inlinks asymptotically. Let be the degree of the node with most links in the networks. Then, to test whether such nodes are present in the studied networks, Figure 5 shows the ratio plotted against the preferential attachment . The plots exhibit a moderate agreement of the super- versus the sublinear cases for networks in which (such as RM, TH, Ls, Lb, PH, HA) and for (like Cui, Bui, nen, ER, DG, AR, nfr). If is close one (i.e., in the case of weak sublinear or weak superlinear attachment), the agreement breaks down.

5 Discussion
We have empirically investigated preferential attachment in forty-seven online networks and found that these networks follow a nonlinear preferential attachment model, i.e., their preferential attachment exponent is either larger than one (superlinear) or lower than one (sublinear). As such, we challenge the often implicit assumption in Web Science that preferential attachment assumes a linear relationship (cf. [2]). Furthermore, we show that certain clearly distinct categories of online networks feature a superlinear preferential attachment exponent, whereas other categories feature a sublinear one. Our findings point out that previous studies of preferential attachment in online networks might have oversimplified the underlying mechanisms by assuming linearity when, in fact, most online networks follow a nonlinear pattern.
In particular, we find that the majority (70%) of the studied online networks fall into the sublinear category, having . The networks in the sublinear category were previously classified as rating, communication, folksonomy and social networks (see also Table 1). Also, a subset of the authorship networks falls into this category, specifically all wiki edit networks except those from Wikipedia (with the exception of the French Wiktionary). The other 30% fall into the superlinear category where . These networks were classified as explicit and implicit interaction networks. Also, the second subset of the authorship networks falls into this category, specifically all Wikipedias and the French Wiktionary.
Our findings show that online networks do not follow a linear preferential attachment model. Actually, not one of the studied networks featured linearity where exactly. This is unexpected, as most literature implies such linearity. In addition, we show that online networks are also not consistent in their (non-)linearity: most networks follow a sublinear preferential attachment model, whereas others follow a superlinear model. However, we do find patterns that suggest an underlying internal consistency, because most of the previous classifications fit in their entirety into one category (except the wiki edit networks). For example, all networks in the ‘rating networks’ classification are part of the sublinear category, whereas all interaction networks fall into the superlinear category.
Furthermore, we observe that similar to the distribution of the preferential attachment exponent, the power law exponent too is far from consistent as suggested by previous literature [1]. We find that while the values differ quite extremely, the distribution does not seem to follow a distinct pattern, nor is there a clear correlation with the preferential attachment exponent (see Figure 4).
An explanation of these findings might be that some networks, in particular the ones falling into the superlinear category, follow other or at least additional governance mechanisms than other networks [47]. For example, authors on Wikipedia (which is part of the superlinear category) might perceive the existence of a strong internal normative system that prescribes their online behavior [50]. Indeed, previous research has often observed the existence of social norms and normative systems in online networks (e.g., [16, 42, 59, 64]). This phenomenon is often explained by the absence of more formal and explicit governance mechanisms (e.g., [14, 26]) that are typically observed in other types of networks.
6 Conclusion
The findings presented in this paper show that interaction in online networks might be more complex than previously thought. In particular, we show that these networks follow a nonlinear preferential attachment model, contrary to what is suggested in the literature. Similarly, most of the networks that we studied have a power law exponent that is not even close to being consistently in the range [1]. This leads to the conclusion that research into online networks might need to take into account other factors, and most importantly employ different models that allow for the nonlinearity of the preferential attachment model. Also, the previous assumption of a more or less generalized range of for the power law exponent seems to be challenged, as we observed variation in that value across the networks.
Our work suggests a number of future research directions. First, as a direct consequence of our empirical findings, we suggest that future work should develop new models to allow for nonlinearity of the preferential attachment exponent, as well as diversity of the power law exponent. Our findings undermine many of the previously developed models, as such we expect fruitful research in that direction. Second, and related to our first point, future research should search for explanations for our findings. In the previous section, we tentatively highlight some possible explanations; however, empirical studies need to establish their value. In particular, research should connect more mathematical approaches to study online networks (such as presented in this paper) and sociological attempts to explain the observed phenomena. For example, if the type of governance in a given network indeed influences its preferential attachment and power law exponent, how exactly does that mechanism work? Related to this question it is important to investigate the emergence of networks, something that we did neglect in the current research. If we assume sociological mechanisms to play a role in the explanation of diversity and nonlinearity of the two exponents, then it follows that the antecedents of these mechanisms need to be investigated. For example, how does a certain type of governance in an online network come into being? What are the driving forces behind this emergence, and how can these mechanisms best be studied? We hope that our paper contributes to fuel research into that direction.
Our study is subject to a number of limitations that present opportunities for future research. First, we do find that the preferential attachment exponent is nonlinear, similarly the power law exponent is distributed more diversely than expected. However, we do not investigate the relationship between these two observations, and suggest that future work further delves into this issue. Second, we investigated forty-seven datasets. Future research might broaden the scope of our study to include more and more diverse online networks. For example, in the current study we did not investigate networks such as hyperlink networks and affiliation networks. It should be fruitful to test the observations that we make in this paper on a larger scale, and as such generalize our findings to a broader level.
7 Acknowledgments
We thank Hans Akkermans, Rena Bakhshi and Julie Birkholz for helpful discussions and hints on work related to this paper. The research leading to the results presented in this paper has received funding from the European Community’s Seventh Frame Programme under grant agreement no 257859, ROBUST.
References
- [1] Albert, R., and Barabási, A.-L. Statistical mechanics of complex networks. Reviews of Modern Physics 74, 1 (2002), 47–97.
- [2] Barabási, A.-L., and Albert, R. Emergence of scaling in random networks. Science 286, 5439 (1999), 509–512.
- [3] Barabási, A.-L., Jeong, H., Neda, Z., Ravasz, E., and Schubert, A. Evolution of the social network of scientific collaborations. Physica A 311, 3–4 (2002), 590–614.
- [4] Bennett, J., and Lanning, S. The Netflix Prize. In Proc. KDD Cup (2007), 3–6.
- [5] Benz, D., Hotho, A., Jäschke, R., Krause, B., Mitzlaff, F., Schmitz, C., and Stumme, G. The social bookmark and publication management system BibSonomy. The VLDB J. 19, 6 (dec 2010), 849–875.
- [6] Bollobás, B. Modern Graph Theory. Springer, 1998.
- [7] Brandes, U., and Lerner, J. Structural similarity: Spectral methods for relaxed blockmodeling. J. Classification 27, 3 (2010), 279–306.
- [8] Celma, Ò. Music Recommendation and Discovery in the Long Tail. Springer, 2010.
- [9] Chaintreau, A., Hui, P., Crowcroft, J., Diot, C., Gass, R., and Scott, J. Impact of human mobility on opportunistic forwarding algorithms. IEEE Trans. on Mobile Computing 6, 6 (2007), 606–620.
- [10] Champernowne, D. A model of income distribution. Economic Journal 63 (1953), 318–351.
- [11] Choudhury, M. D., Lin, Y.-R., Sundaram, H., Candan, K. S., Xie, L., and Kelliher, A. How does the data sampling strategy impact the discovery of information diffusion in social media? In Proc. Int. Conf. on Weblogs and Social Media (2010), 34–41.
- [12] Choudhury, M. D., Sundaram, H., John, A., and Seligmann, D. D. Social synchrony: Predicting mimicry of user actions in online social media. In Proc. Int. Conf. on Computational Science and Engineering (2009), 151–158.
- [13] Clauset, A., Shalizi, C. R., and Newman, M. E. J. Power-law distributions in empirical data. SIAM Rev. 51, 4 (2009), 661–703.
- [14] Dahlander, L., Frederiksen, L., and Rullani, F. Online communities and open innovation: Governance and symbolic value creation. Industry and Innovation 15, 2 (2008), 115–123.
- [15] Dereich, S., and Mörters, P. Random networks with sublinear preferential attachment: Degree evolutions. Electrical J. of Probability 14 (2009), 1222–1267.
- [16] Dholakiaa, U. M., Bagozzia, R. P., and Pearo, L. K. A social influence model of consumer participation in network- and small-group-based virtual communities. Int. J. of Research in Marketing 21, 3 (2004), 241–263.
- [17] Dorogovtsev, S. N., and Mendes, J. F. F. Evolution of networks. Adv. Phys. 51 (2002), 1079–1187.
- [18] Eagle, N., and Pentland, A. S. Reality Mining: Sensing complex social systems. Personal Ubiquitous Computing 10, 4 (2006), 255–268.
- [19] Emamy, K., and Cameron, R. CiteULike: A researcher’s social bookmarking service. Ariadne, 51 (2007).
- [20] Erdős, P., and Rényi, A. On random graphs I. Publ. Math. Debrecen 6 (1959), 290–297.
- [21] Faraj, S., and Johnson, S. L. Network exchange patterns in online communities. Organization Science 22, 6 (2010), 1464–1480.
- [22] Gabel, A., and Redner, S. Sublinear but never superlinear preferential attachment by local network growth. arXiv:1212.0518.
- [23] Gay, B., and Dousset, B. Innovation and network structural dynamics: Study of the alliance network of a major sector of the biotechnology industry. Research Policy 34, 10 (2005), 1457–1475.
- [24] Gibrat, R. Les Inegalités économiques: Applications aux inégalités des richesses, à la concentration des entreprises, aux populations des villes, aux statistiques des familles, etc., d’une loi nouvelle: la loi de l’effect proportionnel. Sirey, 1931.
- [25] GroupLens Research. MovieLens data sets. http://www.grouplens.org/node/73, October 2006.
- [26] Gulati, R., Puranam, P., and Tushman, M. Meta-organization design: Rethinking design in interorganizational and community contexts. Strategic Management J. 33 (2012), 571–586.
- [27] Gómez, V., Kaltenbrunner, A., and López, V. Statistical analysis of the social network and discussion threads in Slashdot. In Proc. Int. World Wide Web Conf. (2008), 645–654.
- [28] Hanaki, N., Nakajima, R., and Ogura, Y. The dynamics of R&D network in the IT industry. Research Policy 39, 3 (2010), 386–399.
- [29] Jeong, H., Néda, Z., and Barabási, A. L. Measuring preferential attachment for evolving networks. Europhysics Lett. 61, 4 (2001), 567–572.
- [30] Kapteyn, J. C., and van Uven, M. J. Skew Frequency Curves in Biology and Statistics. Hoitsema Brothers, Groningen, 1916.
- [31] Klimt, B., and Yang, Y. The Enron corpus: A new dataset for email classification research. In Proc. European Conf. on Machine Learning (2004), 217–226.
- [32] Krapivsky, P. L., and Krioukov, D. Scale-free networks as preasymptotic regimes of superlinear preferential attachment. Phys. Rev. E 78 (2008), 026114.
- [33] Krapivsky, P. L., and Redner, S. Organization of growing random networks. Phys. Rev. E 63 (2001), 066123.
- [34] Lemarchand, G. A. The long-term dynamics of co-authorship scientific networks: Iberoamerican countries (1973–2010). Research Policy 41, 2 (2012), 291–305.
- [35] Ley, M. The DBLP computer science bibliography: Evolution, research issues, perspectives. In Proc. Int. Symp. on String Processing and Information Retrieval (2002), 1–10.
- [36] Liben-Nowell, D., and Kleinberg, J. The link prediction problem for social networks. In Proc. Int. Conf. on Information and Knowledge Management (2003), 556–559.
- [37] Lim, E.-P., Nguyen, V.-A., Jindal, N., Liu, B., and Lauw, H. W. Detecting product review spammers using rating behaviors. In Proc. Int. Conf. on Information and Knowledge Management (2010), 939–948.
- [38] Lotka, A. J. The frequency distribution of scientific productivity. J. of the Washington Academy of Sciences 16, 12 (1926), 317–324.
- [39] Massa, P., and Avesani, P. Controversial users demand local trust metrics: an experimental study on epinions.com community. In Proc. American Association for Artificial Intelligence Conf. (2005), 121–126.
- [40] Mislove, A. Online Social Networks: Measurement, Analysis, and Applications to Distributed Information Systems. PhD thesis, Rice University, 2009.
- [41] Mislove, A., Koppula, H. S., Gummadi, K. P., Druschel, P., and Bhattacharjee, B. Growth of the Flickr social network. In Proc. Workshop on Online Social Networks (2008), 25–30.
- [42] Moser, C., Groenewegen, P., and Huysman, M. Social norms as governance mechanisms in online professional communities. In Proc. Academy of Management Meeting (2011).
- [43] Newman, M. The structure and function of complex networks. SIAM Review 45, 2 (2003), 167–256.
- [44] Newman, M. E. J. Clustering and preferential attachment in growing networks. Phys. Rev. E 67, 5 (2002).
- [45] Newman, M. E. J. Power laws, Pareto distributions and Zipf’s law. Contemporary Phys. 46, 5 (2006), 323–351.
- [46] Oliveira, R., and Spencer, J. Connectivity transitions in networks with super-linear preferential attachment. Internet Math 2 (2005), 121–163.
- [47] O’mahony, S., and Ferraro, F. The emergence of governance in an open source community. Academy of Management J. 50, 5 (2007), 1079–1106.
- [48] Opsahl, T., and Panzarasa, P. Clustering in weighted networks. Social Networks 31, 2 (2009), 155–163.
- [49] Opsahl, T., and Panzarasa, P. Triadic closure in two-mode networks: Redefining the global and local clustering coefficients. Social Networks 34 (2011).
- [50] Pfeil, U., Zaphiris, P., and Ang, C. S. Cultural differences in collaborative authoring of Wikipedia. J. of Computer-mediated Communication 12, 1 (2006), 88–113.
- [51] Rocha, L. E. C., Liljeros, F., and Holme, P. Information dynamics shape the sexual networks of Internet-mediated prostitution. Proc. of the National Academy of Sciences 107, 13 (2010), 5706–5711.
- [52] Rudas, A., Tóth, B., and Valkó, B. Random trees and general branching processes. Random Struct. Algorithms 31, 2 (2007), 186–202.
- [53] Said, A., De Luca, E. W., and Albayrak, S. How social relationships affect user similarities. In Proc. IUI Workshop on Social Recommender Systems (2010).
- [54] Simon, H. A. On a class of skew distribution functions. Biometrika 42 (1955), 425–440.
- [55] Stack Exchange Inc. Stack Exchange Data Explorer. http://data.stackexchange.com/, 2011.
- [56] Tremayne, M., Zheng, N., Lee, J. K., and Jeong, J. Issue publics on the Web: Applying network theory to the war blogosphere. J. of Computer-mediated Communication 12, 1 (2006), 290–310.
- [57] Viswanath, B., Mislove, A., Cha, M., and Gummadi, K. P. On the evolution of user interaction in Facebook. In Proc. Workshop on Online Social Networks (2009), 37–42.
- [58] Wagner, C. S., and Leydesdorff, L. Network structure, self-organization, and the growth of international collaboration in science. Research Policy 34, 10 (2005), 1608–1618.
- [59] Wang, E. S. T., and Chen, L. S. L. Forming relationship commitments to online communities: The role of social motivations. Computers in Human Behavior 28, 2 (2012), 570–575.
- [60] Watts, D. J. The ‘new’ science of networks. Annual Review of Sociology 30 (2004), 243–270.
- [61] Wikimedia Foundation. Wikimedia downloads. http://dumps.wikimedia.org/, January 2010.
- [62] Yahoo! Labs. KDD Cup from Yahoo! Labs. http://kddcup.yahoo.com/, 2011.
- [63] Yule, G. U. A mathematical theory of evolution, based on the conclusions of Dr. J. C. Willis, F.R.S. Philos. Trans. of the Royal Society of London, Ser. B 213 (1925), 21–87.
- [64] Zhou, T. Understanding online community user participation: a social influence perspective. Internet Research 21, 1 (2011), 67–81.
- [65] Zipf, G. K. The Psychobiology of Language. Houghton Mifflin, 1935.