Structural transitions in a doped lanthanum cuprate
Abstract
139La NMR and relaxation measurements have been performed on La1.8-xEu0.2SrxCuO4 ( and 0.2) single crystals. The temperature dependence of the 139La NMR spectra in all the structural phases [high-temperature tetragonal (HTT) low-temperature orthorhombic (LTO) low-temperature tetragonal (LTT)] reveals the non-vanishing tilt angle of the CuO6 octahedra in the HTT phase, opposed to the case of La2-xSrxCuO4 where the tilt angle disappears immediately above the transition. Since 139La relaxation data provide evidence of the thermodynamic critical fluctuations associated with the structural phase transitions, HTT LTO and LTO LTT, we conclude that the structural transitions in Eu-doped La2-xSrxCuO4 should be of the order-disorder type rather than of the displacive type observed in La2-xSrxCuO4. The change of the nature of the structural transitions caused by doping with Eu appears to be consistent with the LTO LTT transition that is absent in La2-xSrxCuO4.
pacs:
74.72.Gh, 76.60.-kI Introduction
The intrinsic structural instability and its strong influence on superconductivity observed in La2-x(Ba,Sr)xCuO4 and in rare-earth-doped La2-x-yMySrxCuO4 (M = Nd, Eu) compoundsAxe et al. (1989); Büchner et al. (1994) emphasize the crucial role of local structure in high-temperature superconductivity. Moreover, the effects of structural distortions in these materials have been manifested in the formation of static stripe order.Vojta (2009); Hücker (2012) Despite a great deal of work, however, some issues remain controversial and the detailed nature of the local structure of lanthanum cuprates is not yet fully understood.
As is well known from x-ray and neutron diffraction studies, for hole concentration above a certain value in La2-xBaxCuO4 and La2-x-yMySrxCuO4, a sequence of structural phase transitions (SPTs) occurs on lowering temperature () : high-temperature tetragonal (HTT) phase low-temperature orthorhombic (LTO) phase low-temperature tetragonal (LTT) phase. While there is a consensus that these rich structural phases are associated with the subtle changes in the tilt angle and/or tilt axis of the CuO6 octahedra, there has been much debate on whether or not the macroscopic structure corresponds to the local one. In the average structure model obtained by diffraction studies, the HTT LTO is characterized mainly by the tilt angle of the CuO6 octahedra, whereby there is no tilt of the CuO6, i.e., the CuO2 planes are flat, in the HTT phase. In addition, the LTO LTT transition is ascribed to the rotation of the tilt axis of CuO6 octahedra through 45∘ in the average structure model,Axe and Crawford (1994); Friedrich et al. (1996); Simovič et al. (2003); Hücker et al. (2004) in which the change of the direction of the tilt axis seems to have a profound effect on the electronic properties, resulting in the stabilization of static stripe order and the destruction of superconductivity.Büchner et al. (1994); Klauss et al. (2000); Vojta (2009)
The other view is called the local structure model, in which the direction of the local tilts does not change at the LTO LTT transition and the LTO structure results from coherent superposition of the local LTT variants.Billinge et al. (1994); Haskel et al. (2000); Han et al. (2002) In this model, the local tilts persist even in the HTT phase Wakimoto et al. (2006) but the tilt axes are in disorder resulting in the average HTT phase. A similar argument can be found in Ref. Haskel et al., 1996 although a discrepancy exists between the conclusions in Refs. Billinge et al., 1994 and Haskel et al., 1996 with respect to the direction of the local CuO6 tilt.
The main discrepancy between the average and local structure model lies in whether the tilt of the CuO6 exists or not in the HTT phase. Thus the key to discriminate between two models is to measure the local tilt angle in the HTT phase. 139La nuclear magnetic resonance (NMR) is a well-known local probe which is extremely sensitive to certain details of the local structure of lanthanum cuprates. In fact, the non-zero angle () in the LTO and LTT phases between the principal axis of the electric field gradient (EFG) at the La site and the crystal -axis has been well known and is directly induced from the tilt angle () of the CuO6 octahedra. Here we report the 139La NMR studies of La1.8-xEu0.2SrxCuO4 single crystals, providing evidence for the non-vanishing tilt angle of the CuO6 octahedra in the HTT phase supporting the local structure model. Furthermore, distinct behaviors of the 139La spin-lattice relaxation rate at the HTT LTO and LTO LTT transitions were observed, consistent with the fact that the former is a second order and the latter a first order.Axe and Crawford (1994); Cherny (1995)
II Sample preparation and experimental details
The single crystals were grown using the traveling solvent floating zone (TSFZ) method under an oxygen pressure of 3 bar. From x-ray diffraction and thermal expansion studies, we observed the LTO LTT transition at and K for and 0.20, respectively, and the HTT LTO transition at K for .
139La NMR and spin-lattice relaxation measurements were performed in La1.8-xEu0.2SrxCuO4 single crystals with and 0.20. 139La (nuclear spin ) NMR spectra were obtained by sweeping external magnetic field, , at fixed resonance frequencies, in the temperature range 4.2–360 K. 139La spin-lattice relaxation rates were measured at the central transition () by monitoring the recovery of magnetization after saturation with a single pulse. Since a common recovery law cannot explain the data for the whole temperature range investigated, we obtained effective spin-lattice relaxation rates by fitting the recovery data for the first decade in the whole temperature range investigated to the stretched exponential function: where is the nuclear magnetization and a fitting parameter.
III Results and Discussion
Figure 1 shows the 139La spectra obtained in La1.67Eu0.2Sr0.13CuO4 at 29 MHz in the LTT phase (4 K), for applied parallel and perpendicular to the axis. These spectra represent typical quadrupole-perturbed ones which are observed in a single crystal with . Note that the flat background between satellites for indicates the high quality of the single crystal.
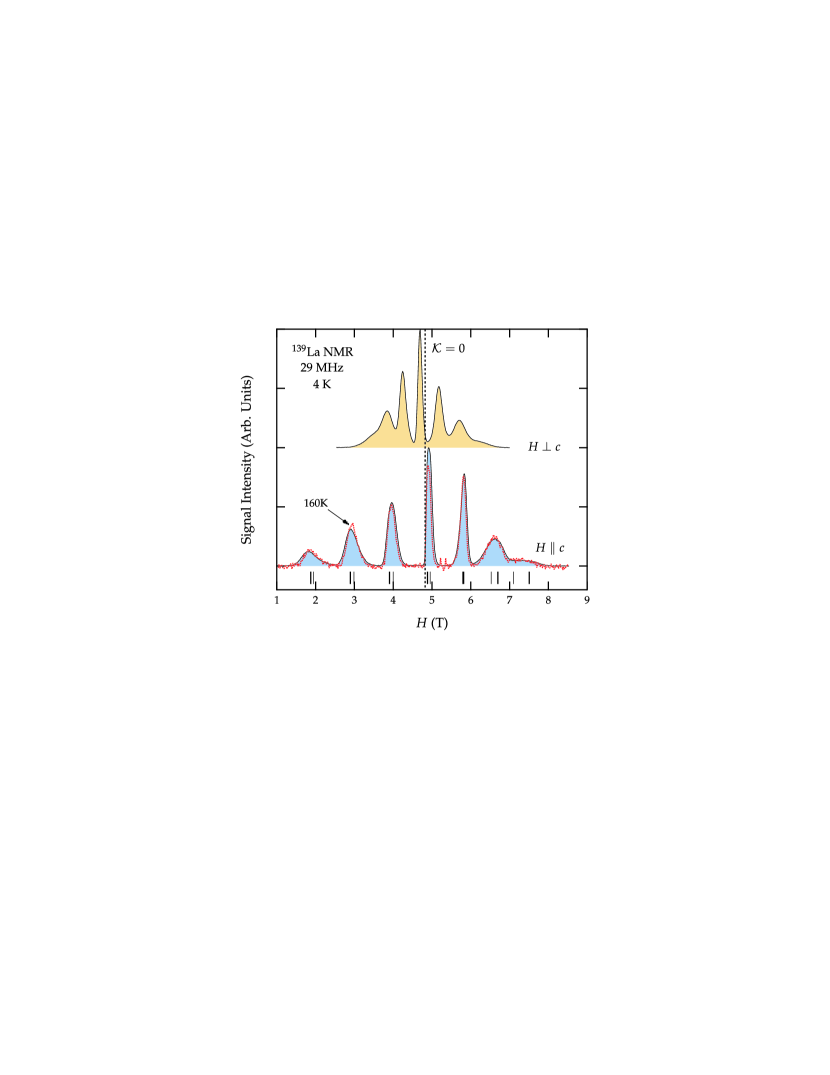
In addition to the satellites which result from the first order quadrupole effect, there is also a second order quadrupole effect which shifts the central transition () depending on the tilt angle between the principal axis of the electric field gradient (EFG) (i.e., the axis of ) and the external field :
| (1) |
where MHz/T is the nuclear gyromagnetic ratio of 139La, the Knight shift, the quadrupole frequency, and . Since the second order shift should vanish when and is very small for the 139La in La-based cuprates,Baek et al. (2012) the considerable shift of the central line for from the resonance field for indicates that is tilted out of the axis by the angle . Also, we find that the spectra display asymmetric features in the position and the linewidth of mirror satellites ( and ) with respect to the central transition. This implies that the tilt angle is considerably distributed. To support this, we calculated the resonant fields of the transitions for and by assuming MHz and the asymmetry parameter . The results are denoted in Fig. 1 as the thick () and thin () lines under the spectra, which accounts for the asymmetric satellite spectra very well. Interestingly, the spectra measured at 160 K in the LTO phase are almost identical with those at 4 K, with slightly reduced linewidths. This indicates that the distribution of the tilt angle is robust in a wide range of temperatures, even above the LTO LTT transition.

Since can be obtained from the second order shift of the central line according to Eq. (1), from now on we focus on the -dependence of the central line in order to get detailed information of the tilt angle of the CuO6 octahedra. In Fig. 2, we show the evolution of the central NMR line on lowering in La1.6Eu0.2Sr0.2CuO4. Here the field was converted to using Eq. (1) by assuming . Although there should be a distribution of which may cause the extension of the spectrum to in Fig. 2, the width ( MHz) of the 139La NQR spectrumSuh et al. (1999) should give the symmetric broadening of the NMR central line of kHz at MHz for a given angle according to Eq. (1). This allows us to treat as a constant for practical purposes. Note that two spectra for different frequencies measured at 200 K coincide. This indicates that the shift of the central line is mostly of a quadrupolar origin rather than of a magnetic one. At 40 K, we find that the line is clearly resolved to two. The magnetic shift (), , and for the two sites are found to be identical, indicating that the two lines represent local structural inhomogeneity rather than different magnetic properties. Indeed, two distinct lines are attributed to the so called buckling of the CuO2 plane which results from the tilt of the CuO6 octahedra along [010] whose direction alternates by along , which was recently demonstrated in La2-xSrxCuO4(LSCO).Baek et al. (2012)
For quantitative analysis, we rewrite Eq. (1) in the form
| (2) | |||
| with | |||
| (3) | |||
In writing Eq. (2), we used and . Thus, by measuring spectra at different frequencies, one can separate the shift into the contribution of the magnetic () and the quadrupole origin. The inset of Fig. 3 demonstrates how the magnetic shift () and the quadrupolar contribution () can be separated using Eq. (2) and the actual dominance of the quadrupole contribution with negligibly small . Therefore, the average shift of the central line is indeed equivalent to a measure of the average tilt angle .
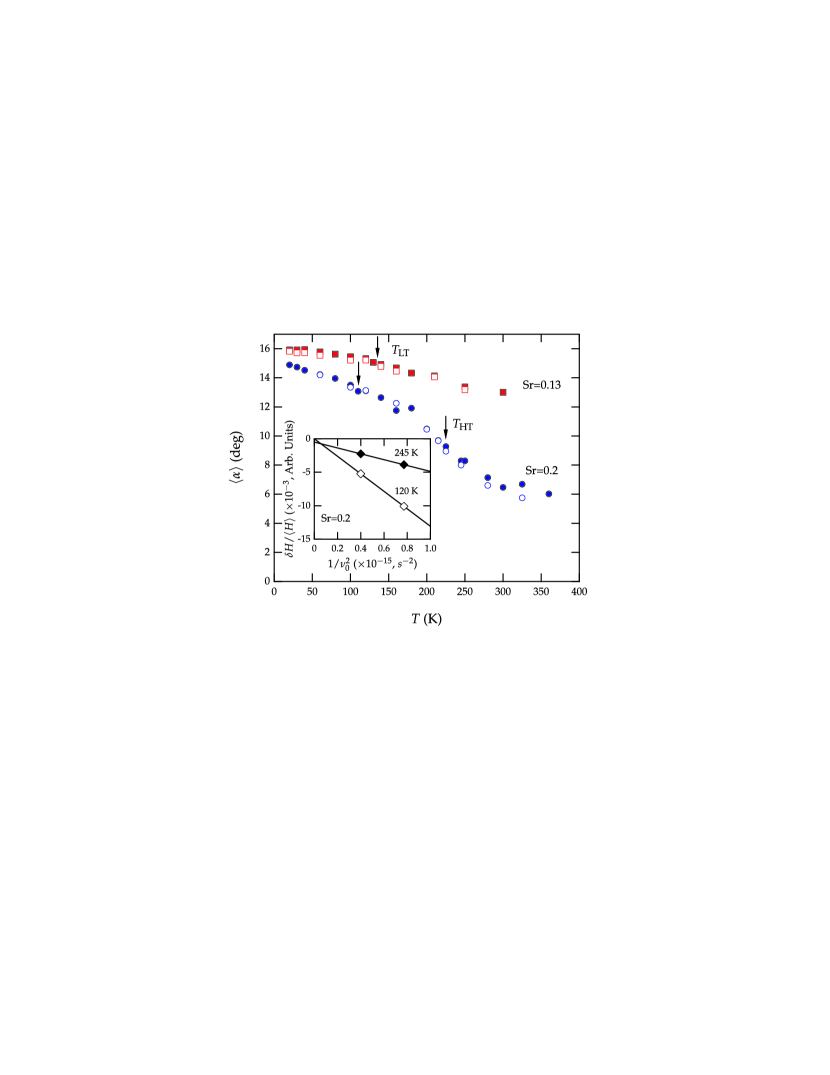
We plot converted from the average field for the two doped samples. In Fig. 3, we actually plot two sets of : the one (open symbols) is obtained from the values of of spectra measured at two different frequencies using Eq. (2) as demonstrated in the inset, and the other (closed symbols) is obtained simply from of a single spectrum measured at one frequency by assuming in Eq. (2). No noticeable difference between the open and closed symbols indicates that is negligibly small.
The main feature in Fig. 3 is non-vanishing at high in the HTT phase. This is clearly contrasted with the picture described by the average structure model, but rather supports the local structure model. One may claim that the non-zero is attributable to the experimental error in aligning the -axis of the sample along the direction of the applied field . However, the misalignment of the sample should give rise to a narrowing of the line at high at both edges of the spectrum, i.e., the line should shrink with respect to the center corresponding to the misalignment angle. Figure 2 clearly shows that the left edge of the spectrum corresponding to the smaller does not change while a significant narrowing of the spectrum takes place with increasing at the right edge of the spectrum corresponding to the larger . Thus, we conclude that the non-zero is totally irrelevant to the experimental error.
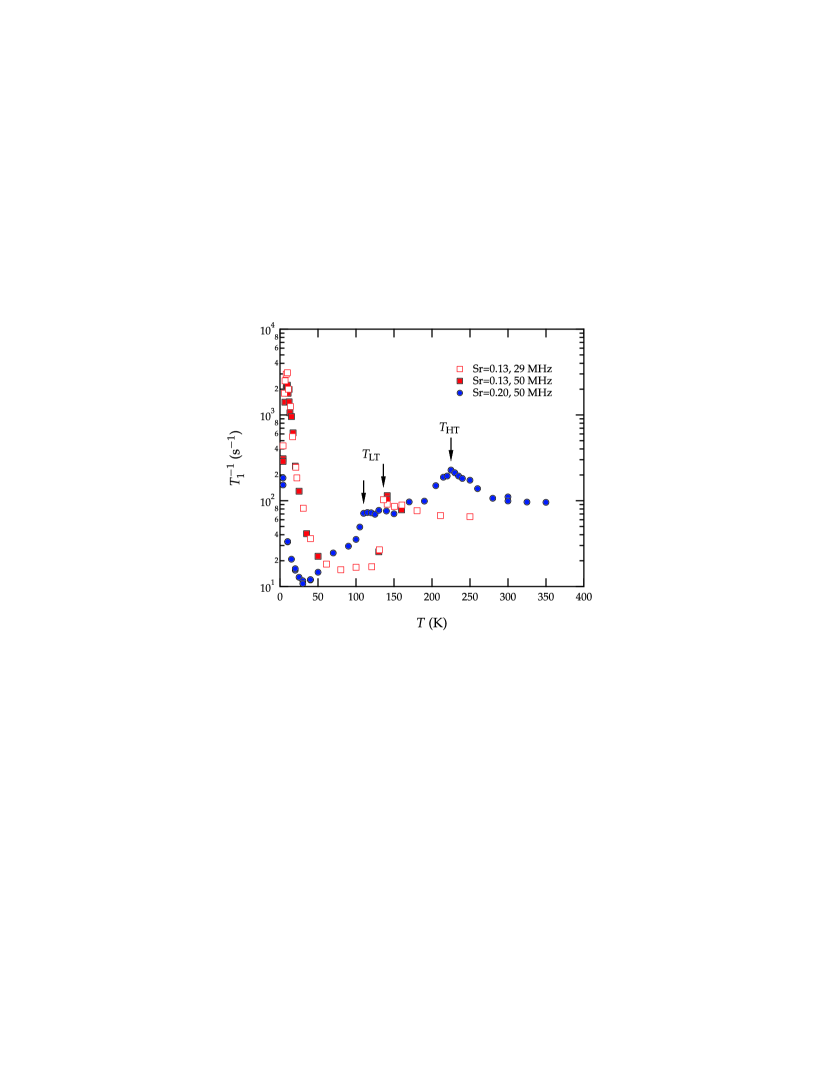
A remarkable finding is that there is no visible anomaly of at both and in Fig. 3. In contrast, we find that the collective modes associated with the phase transitions are clearly picked up by the 139La spin-lattice relaxation rate as shown in Fig. 4. Namely, displays distinct features at the structural transitions: a sudden decrease at and a relatively sharp anomaly at above which a clear upturn of precedes. A strong enhancement observed at low temperatures below K for both samples is attributed to glassy spin freezing phenomenon. Note that for Sr=0.2 the low- enhancement of is significantly suppressed by an order of magnitude.
The sudden drop of at with essentially no enhancement above is in contrast to the continuous and relatively sharp peak of at . Since the NMR spin-lattice relaxation rate reflects the critical behavior of collective modes at a phase transition, the contrasting behaviors of at and suggest a different thermodynamic nature of the structural transitions. This is in good agreement with the observation that the LTO LTT transition in the heavily hole-doped sample is discontinuous (first order) where the well-defined critical behavior of the order parameter does not exist, while the HTT LTO is dominantly a second order Büchner et al. (1993); Axe and Crawford (1994); Suh et al. (1999) although weakly first order nature may be present, as observed in the underdoped LSCO sample.Baek et al. (2012)
Therefore, the absence of an anomalous change of at and cannot be due to an inhomogeneous structural mixture or simple tilt angle disorder caused by dopants, but should reflect characteristics of the structural phase transitions. For the LTO LTT transition, no change of at is actually expected for both the average and local structure models, since the difference of the two models is the direction of the local tilt axis in the LTT and LTO phases, not the average tilt angle itself.
On the other hand, for the HTT LTO transition, the significant tilt angle which remains in the HTT phase suggests that the HTT LTO is characterized dominantly by an order-disorder type transition where the HTT phase results from disordered LTO structures. This contrasts sharply with the displacive transition observed in LSCO in which the CuO2 plane becomes flat in the HTT phase.Braden et al. (2001); Baek et al. (2012) This implies that doping Eu in LSCO modifies the nature of the HTT LTO transition. Since the LTT phase at low does not occur in LSCO, it is possible that the different type of the HTT LTO transition is relevant to the occurrence of the LTT phase. It was argued that the thermal conductivity peak that appears in La2CuO4 and non-superconducting rare earth-doped LSCO is suppressed in superconducting LSCO due to enhanced scattering of the heat carrying phonons with soft phonons.Baberski et al. (1998); Hess et al. (2003) We find that a similar argument could be made for the different nature of the HTT LTO caused by Eu doping. The dominant soft phonon modes in LSCO are actually consistent with the second order displacive HTT LTO structural transition observed in LSCO,Böni et al. (1988); Baek et al. (2012) considering that displacive materials are characterized by low anharmonicity or quasi-harmonicity.Rehwald (1973); Cowley (1980); Nakanishi et al. (1982) By doping Eu, however, strong anharmonicity of the vibrations is likely introduced so that the soft mode is overdamped, being insufficient to drive a displacive transition and resulting in an order-disorder type transition instead. In this case, however, it would be quite natural that the transition is imperfect due to a structural inhomogeneity caused by dopants. Indeed, the fact that decreases continuously toward zero with increasing as shown in Fig. 3 may suggest that short-range precursor orderBruce and Cowley (1980) with a displacive nature occurs at , yielding to the long-range order-disorder transition at .
IV Conclusion
We studied 139La NMR of La1.8-xEu0.2SrxCuO4 ( and 0.2) as a function of temperature. The -dependence of confirms the critical modes associated with the structural transitions, showing first order LTO LTT and second order HTT LTO transitions. An important finding is that the local tilt angle of the CuO6 octahedra does not vanish in the HTT phase, which is consistent with the local structure model. This is opposed to La2-xSrxCuO4 in which the average structure model is strongly supported. This indicates that Eu-doping causes the change of the nature of the structural transitions from a displacive HTT LTO transition in LSCO to an order-disorder one in Eu-doped LSCO. This unusual sensitivity of the lattice dynamics in La cuprates is attributed to the soft phonon modes that are highly susceptible to dopants.
Acknowledgement
This work was supported by the Basic Science Research Program through the National Research Foundation of Korea (NRF) funded by the Ministry of Education, Science and Technology (NRF-2008-314-C00123). This work was supported in part by the US DOE. One of authors (B.J.S.) acknowledges the support from the 2008 Research Fund of the Catholic University of Korea. M.H. acknowledges support by the Office of Science, U.S. Department of Energy under Contract No. DE-AC02-98CH10886.
References
- Axe et al. (1989) J. D. Axe, A. H. Moudden, D. Hohlwein, D. E. Cox, K. M. Mohanty, A. R. Moodenbaugh, and Y. Xu, Phys. Rev. Lett. 62, 2751 (1989).
- Büchner et al. (1994) B. Büchner, M. Breuer, A. Freimuth, and A. P. Kampf, Phys. Rev. Lett. 73, 1841 (1994).
- Vojta (2009) M. Vojta, Adv. Phys. 58, 699 (2009).
- Hücker (2012) M. Hücker, Physica C 481, 3 (2012).
- Axe and Crawford (1994) J. D. Axe and M. K. Crawford, J. Low Temp. Phys. 95, 271 (1994).
- Friedrich et al. (1996) C. Friedrich, B. Büchner, M. M. Abd-Elmeguid, and H. Micklitz, Phys. Rev. B 54, R800 (1996).
- Simovič et al. (2003) B. Simovič, M. Hücker, P. C. Hammel, B. Büchner, U. Ammerahl, and A. Revcolevschi, Phys. Rev. B 67, 224508 (2003).
- Hücker et al. (2004) M. Hücker, V. Kataev, J. Pommer, U. Ammerahl, A. Revcolevschi, J. M. Tranquada, and B. Büchner, Phys. Rev. B 70, 214515 (2004).
- Klauss et al. (2000) H.-H. Klauss, W. Wagener, M. Hillberg, W. Kopmann, H. Walf, F. J. Litterst, M. Hücker, and B. Büchner, Phys. Rev. Lett. 85, 4590 (2000).
- Billinge et al. (1994) S. J. L. Billinge, G. H. Kwei, and H. Takagi, Phys. Rev. Lett. 72, 2282 (1994).
- Haskel et al. (2000) D. Haskel, E. A. Stern, F. Dogan, and A. R. Moodenbaugh, Phys. Rev. B 61, 7055 (2000).
- Han et al. (2002) S.-W. Han, E. A. Stern, D. Haskel, and A. R. Moodenbaugh, Phys. Rev. B 66, 094101 (2002).
- Wakimoto et al. (2006) S. Wakimoto, H. Kimura, M. Fujita, K. Yamada, Y. Noda, G. Shirane, G. Gu, H. Kim, and R. J. Birgeneau, J. Phys. Soc. Jpn. 75, 074714 (2006).
- Haskel et al. (1996) D. Haskel, E. A. Stern, D. G. Hinks, A. W. Mitchell, J. D. Jorgensen, and J. I. Budnick, Phys. Rev. Lett. 76, 439 (1996).
- Cherny (1995) A. Cherny, Physica C 244, 129 (1995).
- Baek et al. (2012) S.-H. Baek, A. Erb, B. Büchner, and H.-J. Grafe, Phys. Rev. B 85, 184508 (2012).
- Suh et al. (2000) B. J. Suh, P. C. Hammel, M. Hücker, B. Büchner, U. Ammerahl, and A. Revcolevschi, Phys. Rev. B 61, R9265 (2000).
- Büchner et al. (1993) B. Büchner, M. Cramm, M. Braden, W. Braunisch, O. Hoffels, W. Schnelle, R. Müller, A. Freimuth, W. Schlabitz, G. Heger, et al., Europhys. Lett. 21, 953 (1993).
- Suh et al. (1999) B. J. Suh, P. C. Hammel, M. Hücker, and B. Büchner, Phys. Rev. B 59, R3952 (1999).
- Braden et al. (2001) M. Braden, M. Meven, W. Reichardt, L. Pintschovius, M. T. Fernandez-Diaz, G. Heger, F. Nakamura, and T. Fujita, Phys. Rev. B 63, 140510 (2001).
- Baberski et al. (1998) O. Baberski, A. Lang, O. Maldonado, M. Hücker, B. Büchner, and A. Freimuth, Europhys. Lett. 44, 335 (1998).
- Hess et al. (2003) C. Hess, B. Büchner, U. Ammerahl, and A. Revcolevschi, Phys. Rev. B 68, 184517 (2003).
- Böni et al. (1988) P. Böni, J. D. Axe, G. Shirane, R. J. Birgeneau, D. R. Gabbe, H. P. Jenssen, M. A. Kastner, C. J. Peters, P. J. Picone, and T. R. Thurston, Phys. Rev. B 38, 185 (1988).
- Rehwald (1973) W. Rehwald, Adv. Phys. 22, 721 (1973).
- Cowley (1980) R. A. Cowley, Adv. Phys. 29, 1 (1980).
- Nakanishi et al. (1982) N. Nakanishi, A. Nagasawa, and Y. Murakami, J. Phys. Colloques 43, C4 (1982).
- Bruce and Cowley (1980) A. D. Bruce and R. A. Cowley, Adv. Phys. 29, 219 (1980).