Finding Core Collapse Supernova from the Epoch of Reionization Behind Cluster Lenses
Abstract
Current surveys are underway to utilize gravitational lensing by galaxy clusters with Einstein radii in the search for the highest redshift galaxies. Associated supernova from the epoch of reionization would have their fluxes boosted above the detection threshold, extending their duration of visibility. We predict that the James Webb Space Telescope (JWST) will be able to discover lensed core-collapse supernovae at redshifts exceeding –.
keywords:
supernovae: general – gravitational lensing – galaxies: clusters: general – early Universe1 Introduction
Clusters of galaxies act as gravitational lenses, focusing light-rays from sources behind them and magnifying their images. As this effect enables observers to probe higher redshifts than ever probed before, surveys are being conducted with the Hubble Space Telescope (HST) to obtain deep images of the sky through massive galaxy clusters. One such ongoing program is the Cluster Lensing and Supernova survey (CLASH), which is imaging 25 clusters each to a depth of 20 orbits (Postman et al., 2012). The 5 clusters selected for this program have large Einstein radii of 35′′ to 55′′, maximizing their potential for discovering ultra-high redshift galaxies. Indeed, three candidate galaxies at redshifts – and another candidate galaxy at have already been found in the CLASH fields (Bouwens et al., 2012; Coe et al., 2013). Similarly, the planned HST Frontier Fields111http://www.stsci.edu/hst/campaigns/frontier-fields/ program will target 6 strong lensing galaxy clusters to reveal yet higher redshifts galaxies.
The James Webb Space Telescope (JWST), the successor to HST scheduled for launch in 2018, is likely to have analogous observational programs with comparable integration times on a similar number of lensing clusters. Although the CLASH survey does aim to detect Type Ia supernova (SN) out to redshifts of , the current HST cluster observations are unlikely to detect gravitationally lensed SN from the epoch of reionization at . Indeed, transient science was not identified as a science priority for the Frontier Fields program, which will not revisit the same field twice. The greater sensitivity of JWST and its optimization for observations in the infrared could potentially allow it to find lensed supernova from the cosmic dawn in these same cluster fields.
In this Letter, we estimate the cosmic star formation rate during the epoch of reionization by requiring that enough Pop II stars were formed to ionize the universe. Using model spectral time series for Type II SN, as well as a simple isothermal sphere model for lensing, we calculate in §2-5 the required magnification and duration of detectability of such SN at for different JWST bands and integration times. Combining the above, we derive the snapshot rate, i.e. the expected number of gravitationally lensed core collapse SNe detected in the field-of-view of JWST around these high magnification clusters.
2 Star Formation & Supernova Rate
We infer the volumetric supernova rate as a function of redshift by relating it to the cosmic star formation rate density (SFRD) :
| (1) |
where we use a Salpeter initial mass function (IMF), , and include a factor of in the mass integral to account for the shallower slope at in a realistic IMF (Fukugita, Hogan & Peebles, 1998). For the stellar mass range between and appropriate for optically-luminous core-collapse supernova, the conversion coefficient between the star formation rate and the supernova rate is .
We require that enough massive stars were formed by the end of reionization so as to produce sufficient ionizing UV radiation to ionize the intergalactic medium by . This follows the approach used in Pan, Kasen & Loeb (2012), albeit with different parameters to bring our estimates closer to other inferences in literature, as detailed below. The star formation rate during reionization peaks at late times, when metals expelled from a prior generation of star formation enriched the interstellar gas, so we assume that early Pop II stars () with a present-day IMF dominated the ionizing photon budget. Using the stellar ionizing fluxes of Schaerer (2002), we find the average number of ionizing photons produced per baryon incorporated into a Pop II star was . Thus, the mass in stars per comoving volume should satisfy
| (2) |
where is the number of ionizing photons necessary to ionize each baryon after accounting for recombinations, is the cosmic baryon density, and is the average escape fraction of ionizing photons from their host galaxies into the intergalactic medium. Also, we can relate the mass in stars per volume to the mass in virialized halos per volume via a star formation efficiency :
| (3) |
where we use the Sheth-Tormen mass function of halos for (Sheth & Tormen, 1999), and is the minimum halo mass with atomic hydrogen cooling. The cosmological parameters, such as the matter and baryon densities , , were taken from Planck Collaboration et al. (2013). Assuming is constant, we can calibrate via equations (2), (3), and then evaluate at any redshift. The star formation rate is simply, .
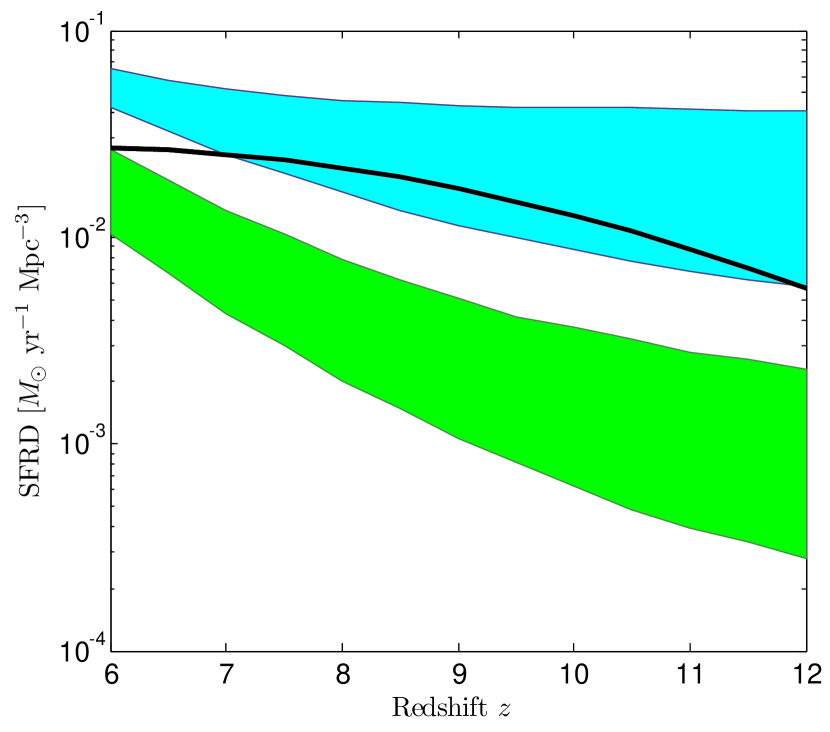
Figure 1 shows our estimated SFRD, with and , resulting in a yr-1 Mpc-3 (comoving) between redshifts of to . This corresponds to volumetric rates of approximately yr-1 Mpc-3 for core-collapse supernova. Our simple SFRD model and the resulting SN rates linearly scale with and , so the JWST snapshot rates calculated later can be easily scaled for different parameter choices of the SFRD.
3 Light Curves
We adopt the spectral time series of a Type II plateau SN from a red giant progenitor with an initial mass , computed by Kasen & Woosley (2009) using a code that solves the full multi-wavelength time-dependent radiative transfer problem. We plot the SN light curves in the observer frame for the best possible HST and JWST filters in Figure 2. Note that Type II SN are diverse transients with peak luminosities that can vary by more than an order of magnitude, and the relationship between the progenitor mass and the brightness of the supernova is uncertain; we adopt a single characteristic model to represent all core collapse SNe for the sake of simplicity. Type IIP SNe are the most common events, and the model light curves and spectra used here agree very well with observed SNe of average luminosities.
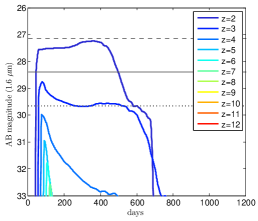
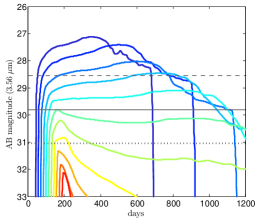
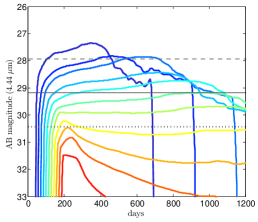
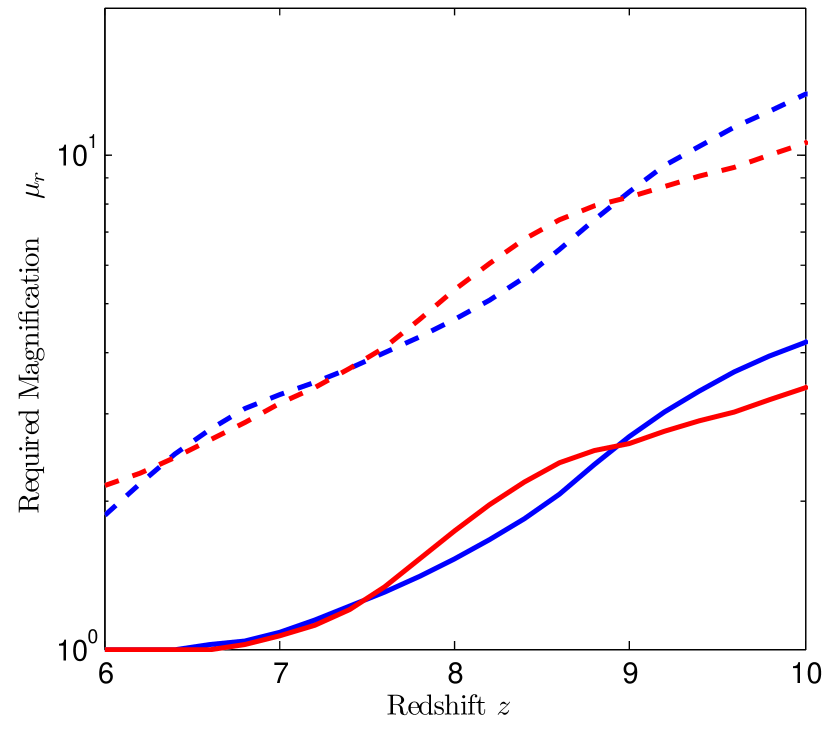
We verified that HST is incapable in practice of detecting a core-collapse SNe from the epoch of reionization. The sensitivity of the HST 1.6m filter is only a factor of 2 worse than the JWST F444W filter, but its overwhelming drawback is its waveband, which can only probe the SN rest-frame UV flux at . Although the JWST F356W is more sensitive, the F444W band will be optimal for detecting the highest redshift SN that gravitational lensing could provide. Figure 3 shows the magnification necessary to detect Type II supernova at high redshifts for different integration times. Even with a s exposure, a large magnification factor of will be necessary for detecting Type IIP SNe at with JWST.
4 Lensing Magnification
For simplicity, we adopt a singular isothermal sphere (SIS) model for the mass distribution of the lensing cluster, within which the magnification properties are uniquely specified by the Einstein radius (Schneider, Ehlers & Falco, 1992). We denote the angular separations of the source and the image from the center axis of the lens as and , respectively. If the source lies within the Einstein radius , two images are created at locations , with magnifications . Note that has negative magnification, that is, the image is flipped compared to the source. If the source lies outside the Einstein radius , there is only one image at with magnification . We conservatively consider only the higher-magnification image at , for which the source angle .
Then, the differential source volume (comoving) of magnified events as a function of magnification and redshift is:
| (4) |
where the differential comoving distance is
| (5) |
with , and the differential source area is
| (6) | |||||
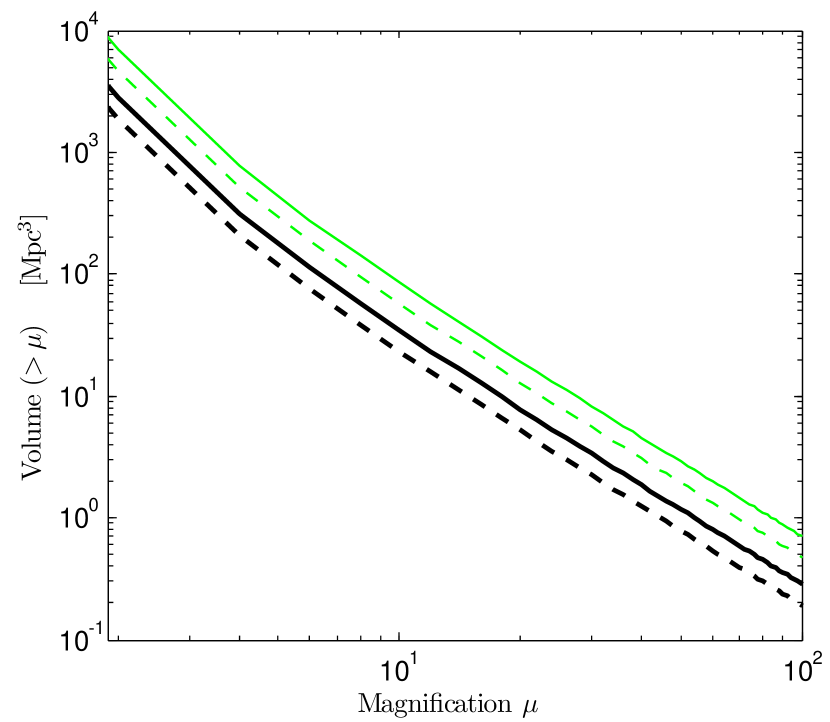
Here is the angular diameter distance, and the extra is to adjust the area to comoving units. In Figure 4, we plot the source volume for a range of Einstein radii typical of high-magnification clusters. Given core-collapse SN rates of yr-1 Mpc-3, capturing SN with high magnifications within source volumes Mpc3 is unlikely. Hence, we expect most lensed supernova detected to have their fluxes moderately boosted with ; the benefit of lensing is to probe somewhat deeper redshifts, and to greatly extend the duration of visibility. Also, since high-redshift observations are background-limited, for a target signal-to-noise ratio, the limiting flux is proportional to , so even a modest magnification of can reduce the required integration time by an order-of-magnitude.
This volume limitation of lensing also justifies our focus on core-collapse SNe, which have the highest volumetric rates. Although Type Ia SNe are brighter, their volumetric rate is a factor of 4 smaller than the core collapse rate at (Pan, Kasen & Loeb, 2012), with the difference drastically increasing with redshift due to the long delay times needed between star formation and explosion for some Type Ia events (Maoz, Mannucci & Brandt, 2012). Pair-instability SNe from Pop III stars have volumetric rates at least two orders of magnitude lower.
5 Snapshot Rate
The snapshot ‘rate’ is the total number of events observed at a limiting flux within a given field (not per unit time). The differential snapshot rate can be calculated from equations (1) and (4) via
| (7) |
where is the rest-frame duration over which an event with magnification will be brighter than the limiting flux at redshift , for the observation wavelength under consideration. We find using our spectral time-series for the Type IIP SN model described in §3. As we care about the apparent SN rate for observers, there is an implicit factor of in front of the intrinsic volumetric supernova rate , but that cancels with a factor for due to cosmic time dilation.
In Figure 5, we plot the expected snapshot rate of magnified core-collapse SN detected by JWST above target redshifts, calculated by integrating equation (7) over and partially over . Since NIRCam has two modules each with a 2.22.2 arcmin2 field-of-view, we limit the source area in equation (4) to images that lie within this field-of-view.
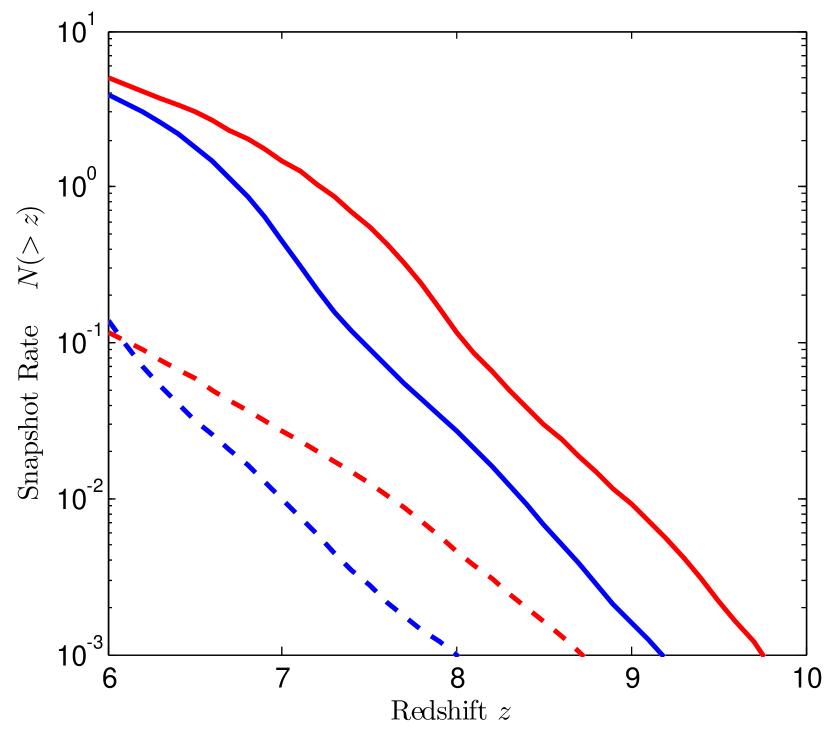
We find that a s JWST snapshot with the F444W filter is expected to detect magnified core collapse SN at around each cluster, and SNe at . Using clusters with , the prospects for detecting a few non-superluminous SNe at high redshifts via lensing are high. If the other galaxy clusters in the CLASH survey with smaller Einstein radii of – are also included, the expected number of gravitationally lensed high- SNe detected should double.
6 Discussion
At , the observed duration of gravitationally-lensed core-collapse SNe can reach year, lending their detection to a search strategy of taking images separated by year, and looking for flux differences between consecutive snapshots. Ideally, the cluster survey should cover most of the critical curve area, and not just known locations of magnified images of high- galaxies, as the lensed SN may appear in currently ‘dark’ critical curve areas, and serve as a flag for its fainter host galaxy. The spectral energy distribution of Type II SNe is sufficiently different from blackbody to allow for photometric redshift determination, however, typing the SNe accurately may require time-consuming spectroscopy.
Our quantitative results improve upon previous calculations of the frequency of lensed SNe. For example, Marri, Ferrara & Pozzetti (2000) first explored the effects of gravitational lensing on high- Type II SNe by intervening cosmological mass for different cosmologies, but the predicted detection rates were unrealistically high because of optimistic assumptions about JWST capabilities. Gunnarsson & Goobar (2003) explored the lensing by massive clusters of distant Type Ia and Type II SNe observed at wavelengths of 0.8-1.25 microns, but found the discovery rate tapered off at . Also, gravitational lensing is not required per se to detect Type II SNe from the epoch of reionization. A moderate JWST blank-field survey can obtain similar snapshot rates, albeit trading off the highest redshift events for more lower redshift ones compared to a lensing survey. For example, Mesinger, Johnson & Haiman (2006) found that a s exposure with JWST can detect 4-24 SNe per field at , although the assumed SFRD yr-1 Mpc-3 was an order-of-magnitude higher than our estimates here, and the current specifications for JWST NIRCam filter sensitivities are now times worse than the values assumed at that time.
For more luminous SNe, Whalen et al. (2012) found that core collapse SNe from Pop III progenitors in the earliest galaxies could be visible with the deepest JWST surveys (reaching ) even at , as these SNe are bluer and almost an order-of-magnitude brighter than the average Type II SNe considered in this paper. Whalen et al. (2013) also found that superluminous Type IIn SNe powered by circumstellar interactions from Pop III stars could be visible out to . Truly massive Pop III stars with masses can also die as extremely bright pair-instability supernova, detectable with JWST at (Pan, Kasen & Loeb, 2012; Hummel et al., 2012); indeed, the current record for the highest-redshift supernova ever observed is likely a pair-instability or pulsational pair-instability event at (Cooke et al., 2012). However, the small volumetric density of Pop III stars makes it unlikely that these events will be strongly lensed. Finally, there is growing evidence of a prompt population of Type Ia SNe, so their volumetric rates during the later stages of reionization may not be negligible. With the fiducial SFRD model in this Letter, we estimate gravitationally lensed Type Ia SNe could be discovered at in the snapshots across the high-magnification clusters at any given time.
At lower redshifts, the measured core collapse SN rate is a factor of lower than that predicted from the cosmic star formation rate (Horiuchi et al., 2011); the most likely explanation is that some SN are dim, whether intrinsically faint or due to dust obscuration. This will reduce our predicted snapshot rate. However, we ignored the contribution of multiple lensing images in our analysis. Due to the gravitational lens time delay, which could be years for strong lensing around the clusters of interest (Coe et al., 2013), multiple images arriving at different times can increase the expected snapshot detection rate of separate SN within the same field-of-view. Although our SIS lens model can produce a maximum of only 2 magnified images, substructure and ellipticity in actual galaxy clusters will likely increase both the number of images and their magnifications.
ACKNOWLEDGMENTS
We are grateful to Dan Kasen for providing the spectral time series data for the Type IIP SN model used in this letter. TP was supported by the Hertz Foundation and the National Science Foundation via a graduate research fellowship. This work was supported in part by NSF grant AST-0907890 and NASA grants NNX08AL43G and NNA09DB30A.
References
- Bouwens et al. (2012) Bouwens R. et al., 2012, ArXiv e-prints
- Coe et al. (2013) Coe D. et al., 2013, ApJ, 762, 32
- Cooke et al. (2012) Cooke J. et al., 2012, Nature, 491, 228
- Ellis et al. (2013) Ellis R. S. et al., 2013, ApJ, 763, L7
- Fukugita, Hogan & Peebles (1998) Fukugita M., Hogan C. J., Peebles P. J. E., 1998, ApJ, 503, 518
- Gunnarsson & Goobar (2003) Gunnarsson C., Goobar A., 2003, A&A, 405, 859
- Horiuchi et al. (2011) Horiuchi S., Beacom J. F., Kochanek C. S., Prieto J. L., Stanek K. Z., Thompson T. A., 2011, ApJ, 738, 154
- Hummel et al. (2012) Hummel J. A., Pawlik A. H., Milosavljević M., Bromm V., 2012, ApJ, 755, 72
- Kasen & Woosley (2009) Kasen D., Woosley S. E., 2009, ApJ, 703, 2205
- Maoz, Mannucci & Brandt (2012) Maoz D., Mannucci F., Brandt T. D., 2012, MNRAS, 426, 3282
- Marri, Ferrara & Pozzetti (2000) Marri S., Ferrara A., Pozzetti L., 2000, MNRAS, 317, 265
- Mesinger, Johnson & Haiman (2006) Mesinger A., Johnson B. D., Haiman Z., 2006, ApJ, 637, 80
- Pan, Kasen & Loeb (2012) Pan T., Kasen D., Loeb A., 2012, MNRAS, 422, 2701
- Planck Collaboration et al. (2013) Planck Collaboration et al., 2013, ArXiv e-prints
- Postman et al. (2012) Postman M. et al., 2012, ApJS, 199, 25
- Robertson & Ellis (2012) Robertson B. E., Ellis R. S., 2012, ApJ, 744, 95
- Robertson et al. (2013) Robertson B. E. et al., 2013, ArXiv e-prints
- Schaerer (2002) Schaerer D., 2002, A&A, 382, 28
- Schneider, Ehlers & Falco (1992) Schneider P., Ehlers J., Falco E. E., 1992, Gravitational Lenses
- Sheth & Tormen (1999) Sheth R. K., Tormen G., 1999, MNRAS, 308, 119
- Whalen et al. (2013) Whalen D. J. et al., 2013, ArXiv e-prints
- Whalen et al. (2012) Whalen D. J., Joggerst C. C., Fryer C. L., Stiavelli M., Heger A., Holz D. E., 2012, ArXiv e-prints