Production cross sections from 82Se fragmentation as indications
of shell effects in neutron-rich isotopes close to the drip-line
Abstract
Production cross sections for neutron-rich nuclei from the fragmentation of a 82Se beam at 139 MeV/u were measured. The longitudinal momentum distributions of 126 neutron-rich isotopes of elements were scanned using an experimental approach of varying the target thickness. Production cross sections with beryllium and tungsten targets were determined for a large number of nuclei including several isotopes first observed in this work. These are the most neutron-rich nuclides of the elements (64Ti, 67V, 69Cr, 72Mn). One event was registered consistent with 70Cr, and another one with 75Fe. The production cross sections are correlated with systematics to reveal trends in the data. The results presented here confirm our previous result from a similar measurement using a 76Ge beam, and can be explained with a shell model that predicts a subshell closure at around . This is demonstrated by systematic trends and calculations with the Abrasion-Ablation model that are sensitive to separation energies.
pacs:
25.70.Mn, 27.40.+z, 27.50.+e, 21.60.CsI Introduction
I.1 Discovery of new nuclei
The discovery of new nuclei in the proximity of the neutron dripline provides a stringent test for nuclear mass models, and hence for the understanding of both the nuclear force and the creation of elements. Another important aspect of such measurements is that once neutron-rich nuclei are observed and their cross sections for formation are understood, investigations to study the nuclei themselves, such as with decay spectroscopy, can be planned. Therefore, obtaining production rates for the most exotic nuclei continues to be an important part of the experimental program at existing and future rare-isotope facilities.
A number of production mechanisms have been used to produce neutron-rich isotopes for Tarasov et al. (2009a) but, in the last few years, two reaction mechanisms were the most effective at producing nuclei in this region:
-
•
projectile fragmentation – an experiment with a 76Ge (132 MeV/u) beam produced 15 new isotopes of Tarasov et al. (2009b),
-
•
in-flight fission with light targets (Abrasion-Fission) – an experiment with a 238U beam Ohnishi et al. (2010) produced a large number of isotopes of using a Be-target, and several new isotopes with by Coulomb fission on a heavy target.
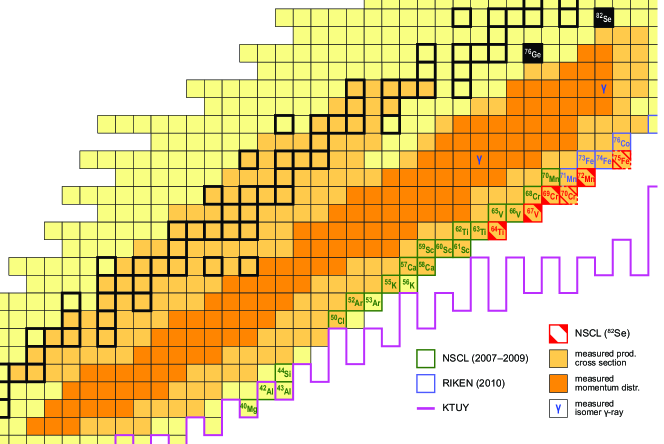
Progress in the production of neutron-rich isotopes was made possible by the increase of primary beam intensities, new beam development at the National Superconducting Cyclotron Laboratory (NSCL) at Michigan State University and advances in experimental techniques Baumann et al. (2007). Indeed, recent measurements at the NSCL Tarasov et al. (2007); Baumann et al. (2007); Mantica et al. (2008a); Tarasov et al. (2009a) have demonstrated that the fragmentation of 48Ca and 76Ge beams can be used to produce new isotopes in the proximity of the neutron dripline. Continuing this work, we report here the next step with a newly developed 82Se beam towards the fundamental goal of defining the absolute mass limit for chemical elements in the region of calcium. In the present measurement, four neutron-rich isotopes with were identified for the first time (see Fig.1), one event was registered consistent with 70Cr46, and another one with 75Fe49.
I.2 Evidence for global structure changes
One of the first indications of significant changes in the structure of neutron rich nuclei was the discovery of enhanced nuclear binding of heavy sodium isotopes Thibault et al. (1975). This is now understood to result from significant contributions of fp shell intruder orbitals to the ground-state configurations of these isotopes Campi et al. (1975); Warburton et al. (1990). Low-lying 2+ states and quadrupole collectivity have been reported in neutron-rich even-even Ne and Mg isotopes around , see for example Refs. Guillemaud-Mueller et al. (1984); Motobayashi et al. (1995); Yoneda et al. (2001); Yanagisawa et al. (2003); Church et al. (2005). This region around 31Na, where the neutron fp shell contributes significantly to the ground-state structure, is now known as the “Island of Inversion”. Similarly, there is mounting evidence for an onset of deformation around neutron number in Fe and Cr nuclei. In even-even Fe and Cr nuclei, for example, this evidence is based on the energies of low-lying states Hannawald et al. (1999); Sorlin et al. (2003); Adrich et al. (2008); Aoi et al. (2009); Gade et al. (2010), transition strengths Rother et al. (2011), deformation length Aoi et al. (2009), and higher-spin level schemes Zhu et al. (2006). Neutron and configurations from above the shell gap are proposed to descend and dominate the low-lying configurations similar to those in the Island of Inversion Brown (2001); Lenzi et al. (2010).
Recently, it was shown that the beta-decay half-lives of the neutron-rich Ca isotopes Mantica et al. (2008b) compare favorably with the results of shell-model calculations performed in the full pf model space using the GXPF1 effective interaction Honma et al. (2005). The systematic trend of these half-lives is consistent with the presence of a subshell gap at as predicted by this interaction and confirmed by a variety of experiments. This interaction also predicts an increase of the excitation energy of the first excited state at 54Ca relative to that obtained with the KB3G Poves et al. (2001) interaction, suggesting the appearance of the shell gap in Ca isotopes. Both interactions predict similar structure for light stable nuclei, but give rather different predictions for several cases of neutron-rich nuclei.
Recent measurements at RIKEN of the in 54Ca Steppenbeck found that the experimental value is 0.5 MeV smaller than the GXPF1B prediction, where the GXPF1B Utsuno et al. (2012) Hamiltonian was created from the GXPF1A Hamiltonian by changing five matrix elements and the single-particle energies which involved . A similar trend had already been pointed out by Mantica et al. Mantica et al. (2008b) where they deduce that the effective energy gap between the adjacent neutron single-particle orbitals and is overestimated by the GXPF1 and GXPF1A effective interactions. Based on this, the GXPF1B interaction has been modified to correct this 0.5 MeV shift and is referred to as GXPF1B5 here.
Other evidence supports the modified form of the GXPF1B interaction. The original GXPF1B interaction predicts a 1n-unbound 56K ( MeV); however, this isotope was shown to be bound by observation in our previous experiment with the 76Ge beam. The shift in the interaction makes the isotopes with valence neutrons in the orbital around more bound, such that the modified interaction GXP1FB5 predicts a bound 56K with MeV.
In our previous cross section measurements in the region around 62Ti (76Ge primary beam) Tarasov et al. (2009b) we observed a systematic variation of the production cross sections that might point to nuclear structure effects, such as an onset of collectivity, that are not included in global mass models that were used to construct the basis of the systematics. The present work, since it is based on isotope production from a different primary beam, covering the same region of the nuclear chart, provides an independent check of this interpretation.
| Data | Fragment | Magnetic rigidity, | Target | Stripper | Wedge | Time | Beam | Goal | |||||||
| set | of interest | (%) | particles | ||||||||||||
| 1 | 67Fe | 4.3209 | 4.3209 | 4.3065 | 4.2919 | 4.2867 | Be | 9.7 | - | - | 0.1 | 1.13 | 3.76e12 | ||
| 2 | Be | 68 | - | - | 0.1 | 1.01 | 3.06e12 | ||||||||
| 3 | Be | 138 | - | - | 0.1 | 0.69 | 4.32e13 | momentum | |||||||
| 4 | Be | 230 | - | - | 0.1 | 1.17 | 2.00e14 | distribution | |||||||
| 5 | Be | 314 | - | - | 0.2 | 1.03 | 1.05e14 | study | |||||||
| 6 | Be | 413 | - | - | 0.2 | 1.45 | 2.60e14 | ||||||||
| 7 | Be | 513 | - | - | 0.2 | 1.60 | 4.13e14 | ||||||||
| 8 | 67Fe | 4.3412 | 4.3209 | 4.3065 | 4.2919 | 4.2867 | Be | 190 | - | 20 | 0.2 | 1.99 | 1.14e15 | isomer | |
| 9 | 78Zn | 4.3505 | 4.3267 | 4.3099 | 4.2928 | 4.2867 | Be | 190 | - | 20 | 0.2 | 2.00 | 1.57e15 | production | |
| 10 | 74Fe | 4.3538 | 4.3289 | 4.3111 | 4.2931 | 4.2867 | Be | 557 | - | 20 | 5 | 37.4 | 3.22e16 | ||
| 11 | 75Fe | 4.3560 | 4.3301 | 4.3118 | 4.2933 | 4.2867 | W | 750 | Be | 17.3 | 20 | 5 | 3.86 | 3.66e15 | production |
| 12 | 68V | 4.3515 | 4.3274 | 4.3103 | 4.2929 | 4.2867 | Be | 695 | - | 20 | 5 | 42.6 | 3.77e16 | of new | |
| 13 | 60Ca | 4.3451 | 4.3233 | 4.3079 | 4.2922 | 4.2867 | Be | 849 | - | 20 | 5 | 16.1 | 1.49e16 | isotopes | |
| 14 | 60Ca | 4.3451 | 4.3233 | 4.3079 | 4.2922 | 4.2867 | Be | 695 | - | 20 | 5 | 14.8 | 1.18e16 | ||
| 15 | 45Ca | 3.6331 | 3.6177 | 3.6055 | 3.5932 | 3.5888 | Be | 190 | - | 20 | 0.1 | 0.92 | 2.86e11 | stable | |
| 16 | 48Ca | 3.6396 | 3.6219 | 3.6080 | 3.5939 | 3.5888 | Be | 190 | - | 20 | 0.1 | 1.55 | 2.50e11 | Ca isotopes | |
II Experiment
II.1 Setup
A newly developed 139 MeV/u 82Se beam with an intensity of 35 pnA, accelerated by the coupled cyclotrons at the NSCL, was fragmented in a series of beryllium targets and a tungsten target, each placed at the object position of the A1900 fragment separator Morrissey et al. (2003). In this work we used an identical configuration to our previous experiment with a 76Ge beam Tarasov et al. (2009a), where the combination of the A1900 fragment separator with the S800 analysis beam line Bazin et al. (2003) formed a two-stage separator system, that allowed a high degree of rejection of unwanted reaction products. At the end of the S800 analysis beam line, the particles of interest were stopped in a telescope of eight silicon PIN diodes (5050 mm2 each) with a total thickness of 8.0 mm. A 50 mm thick plastic scintillator positioned behind the Si-telescope served as a veto detector against reactions in the Si-telescope and provided a measurement of the residual energy of lighter ions that were not stopped in the Si-telescope. A position sensitive parallel plate avalanche counter (PPAC) was located in front of the Si-telescope. All experimental details and a sketch of the experimental setup can be found in Ref. Tarasov et al. (2009a). In this paper, we describe the details of our experimental approach and discuss the results.
II.2 Experimental runs
The present experiment consisted of four segments that are summarized in Table 1. Except for the last segment, the present experimental program is similar to the previous 76Ge experiment Tarasov et al. (2009a). During all runs, the magnetic rigidity of the last two dipoles of the analysis line was kept constant at a value of 4.2867 Tm while the production target thickness was varied to map the fragment momentum distributions. This approach greatly simplifies the particle identification during the scans of the parallel momentum distributions.
The momentum acceptance of the A1900 fragment separator was restricted to (first four runs with thin targets), and to (other targets) for the measurement of differential momentum distributions in the first part of the experiment. The use of different beryllium target thicknesses (9.7, 68, 138, 230, 314, 413, 513 mg/cm2) allowed coverage of the fragment momentum distributions necessary to extract production cross sections and also resulted in more isotopes in the particle identification spectrum.
For the second part of the experiment, a Kapton wedge with a thickness of 20.0 mg/cm2 was used at the dispersive image of the A1900 with a 10 mm aperture in the focal plane to reject less exotic fragments while the separator was set for 67Fe and 78Zn ions. The goal of this setting was to confirm the particle identification by isomer tagging as described in Ref. Grzywacz et al. (1995) with 67mFe ( keV, s) and 78mZn ( keV, s).
In the third part of the experiment, dedicated to the search for new isotopes, five settings were used to cover the most neutron-rich isotopes with , as it was impossible to find a single target thickness and magnetic rigidity to observe all of the fragments of interest. Each setting was characterized by a fragment for which the separator was optimized. A search for the most exotic nuclei in each setting was carried out with Be and W targets. The settings were centered on 60Ca, 68V and 74,75Fe respectively, based on LISE++ Tarasov and Bazin (2008) calculations using the parameterizations of the momentum distributions obtained in the first part of the experiment (see Section IV.1). The momentum acceptance of the A1900 was set to the maximum of for these production runs. It should be noted that the momentum acceptance of the S800 beamline is about 4% according to LISE++ Monte Carlo simulations using a new extended configuration with 5 order optics. This calculated acceptance has been used for the cross section analysis using the method described below.
The fourth part of the experiment was devoted to two short runs measuring the yields of more stable isotopes by centering on 45,48Ca.
III Analysis of experimental data
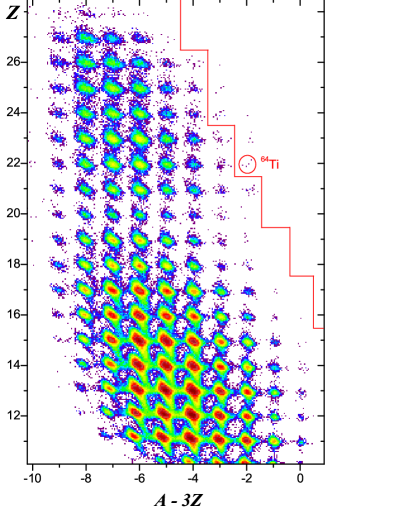
The result of our approach of keeping the last dipoles magnetic rigidities constant while varying the target thickness — as was done in the previous experiment — can be seen in Fig. 2, which shows the total distribution of fully-stripped reaction products observed in the production runs of this work. The range of fragments is shown as a function of the measured atomic number, , versus the quantity deduced from measured values, where is the mass number. The identification of the individual isotopes in Fig. 2 was confirmed via isomer tagging using the known isomeric decays in 67Fe and 78Zn. The standard deviations of ionic charge () and elemental () spectra were found to be similar to those in the previous experiment, therefore the probabilities of one event being misidentified as a neighboring charge state or element as before Tarasov et al. (2009a). The details of the calculation of the particle identification are given in the appendix to the previous work Tarasov et al. (2009a).
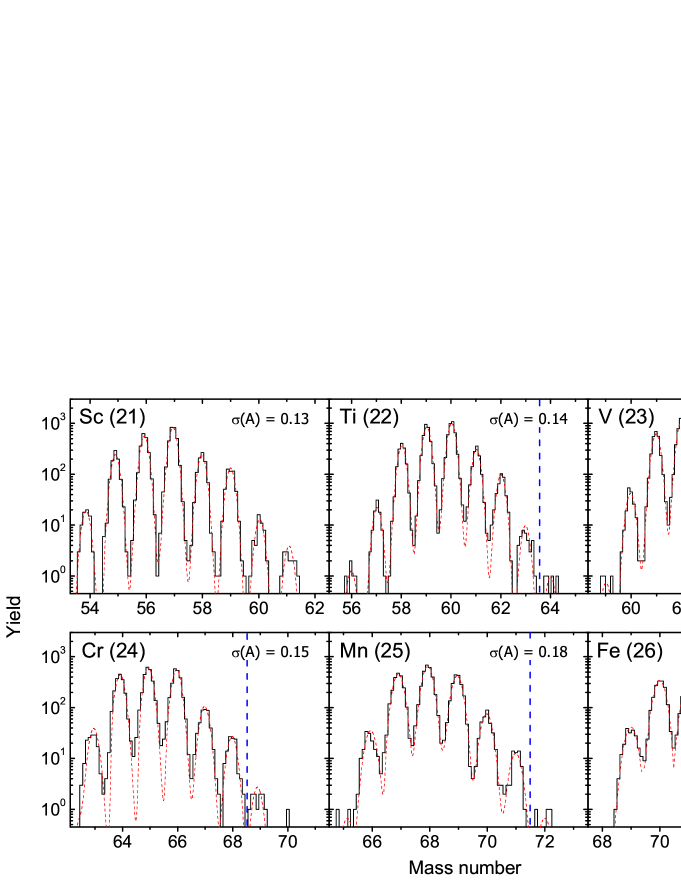
The mass spectra for the isotopic chains from scandium to iron measured during the production runs are shown in Fig. 3. Only nuclei that stopped in the Si telescope are included in this analysis. The observed fragments include several new isotopes that are the most neutron-rich nuclides yet observed of elements (64Ti, 67V, 69Cr, 72Mn). One event was found to be consistent with 70Cr, and another one with 75Fe. The new neutron-rich nuclei observed in this work lie to the right of the solid line in Fig. 2 and to the right of the vertical dashed lines in Fig. 3.
IV Results and Discussion
IV.1 Parallel momentum distributions
The prediction of the momentum distributions of residues is important when searching for new isotopes in order to set the fragment separator at the maximum production rate. Also, the accurate prediction of the momentum distributions allows for a precise estimate of the transmission and efficient rejection of strong contaminants. In this experiment the “target scanning” approach Tarasov et al. (2010), developed in the previous experiment, was used to obtain parameters for the neutron-rich isotope momentum distribution models such as Goldhaber (1974); Morrissey (1989). This method is particularly well suited to survey neutron-rich nuclei since the less exotic nuclei are produced with the highest yields and their momentum distributions can be readily measured with thin targets.
The data analysis of this approach has been improved, and a detailed description is in preparation Tarasov and et al. (2013). Important improvements include: first, the most probable velocity for a fragment is not that at the center of the target when the yield is sharply rising or falling with momentum, and second, asymmetric Gaussian distributions have been used with asymmetry coefficients taken from the convolution model Tarasov (2004) implemented in the LISE++ code Tarasov and Bazin (2008). Note that, at the bombarding energy used in these experiments, the shape of the fragment momentum distribution is asymmetric with a low-energy exponential tail stemming from dissipative processes Tarasov (2004).
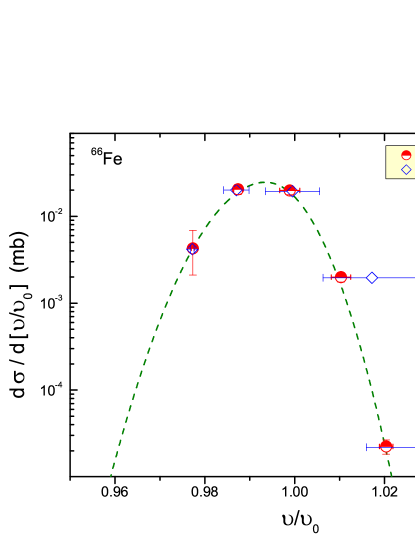
Seven targets were used to measure the momentum distributions (see Table 1). The yield of one example fragment, 66Fe, is shown in Fig. 4 as a function of the ratio of fragment and beam velocities. This figure illustrates the impact of the new data analysis where the most probable values taken are shown by the circles and the average values by the diamonds. Momentum distributions for 126 isotopes were derived (indicated by the colored boxes in Fig. 1) and integrated to deduce the production cross sections.
A survey of all of the fitted results showed that fragments in the heavy mass region were produced similar to our previous measurements Tarasov et al. (2010) with significantly higher velocities than the momentum distribution models Morrissey (1989); Borrel et al. (1983) predict. The difference is most likely due to the fact that the models were developed for fragments close to stability, where the energy required to remove each nucleon was set to 8 MeV, while the actual nucleon binding energy for the neutron rich isotopes under investigation is lower. An analysis with asymmetric distributions to reproduce the mean velocity of fragments has shown that the neutron-rich separation energy parameter in the model Morrissey (1989) for the nuclei observed in the present work in the region can be represented by a linear decrease with the number of removed nucleons:
| (1) |
where , is the projectile mass number, and is the fragment mass number. In the fourth part of the experiment, where stable isotopes were measured (see Table 1), no deviations from the default parameters of the model for the velocities were observed.
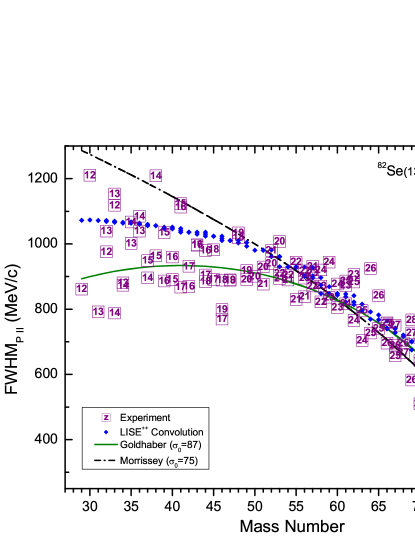
The width obtained for each fragment’s parallel momentum distribution is presented in Fig. 5 for fragments produced from the interaction of 82Se (139 MeV/u) with 9Be targets. The predictions with best fits of reduced widths MeV/ for the Goldhaber Goldhaber (1974) and MeV/ for the Morrissey Morrissey (1989) models are presented in this figure.
IV.2 Production cross sections
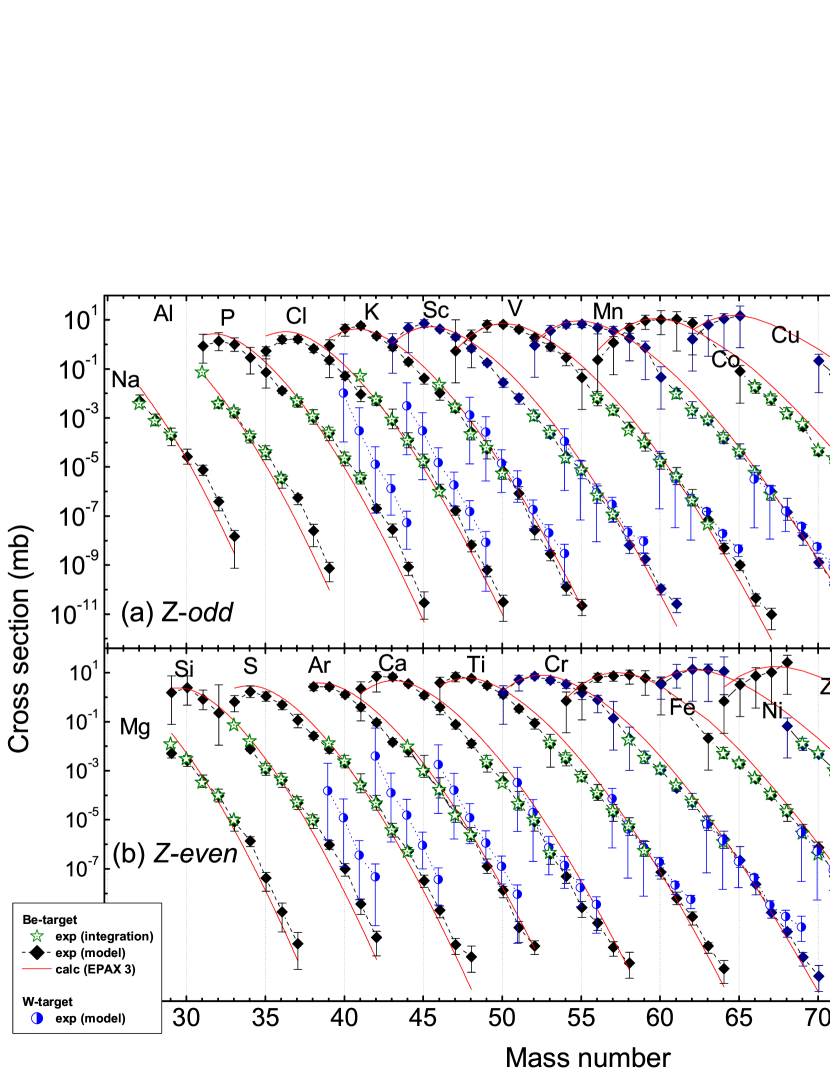
The inclusive production cross sections for the observed fragments were calculated by correcting the measured yields for the finite momentum and angular acceptances of the separator system. A total of 126 cross sections with beryllium targets were obtained from the Gaussian fits to the longitudinal momentum distributions; these nuclei are indicated by stars in Fig. 6. The cross sections for all of the remaining fragments with incompletely measured longitudinal momentum distributions were obtained with estimated transmission corrections as in our previous work Tarasov et al. (2009a). The parameters for the transmission corrections were assumed to be smoothly varying with and .
The cross sections obtained for all the fragments observed in this experiment are shown in Fig. 6 along with the predictions of the recent EPAX parameterization Sümmerer (2012). For those isotopes that relied on transmission calculations, the weighted mean of all measured yields was used to obtain the cross section (shown by solid diamonds in Fig. 6). The uncertainties in these cases include the statistical, the systematic and the transmission correction uncertainties. For more details see ref. Tarasov et al. (2010). As can be seen in Fig. 6, the cross sections are in good agreement with those produced by integrating the measured longitudinal momentum distributions in the cases where there is an overlap.
It is important to note that the predictions of the recent EPAX parameterization for reactions with beryllium, shown by the solid lines in Fig. 6, reproduces the measured cross sections for isotopes much better than the previous EPAX predictions Sümmerer and Blank (2000).
IV.3 Qg systematics
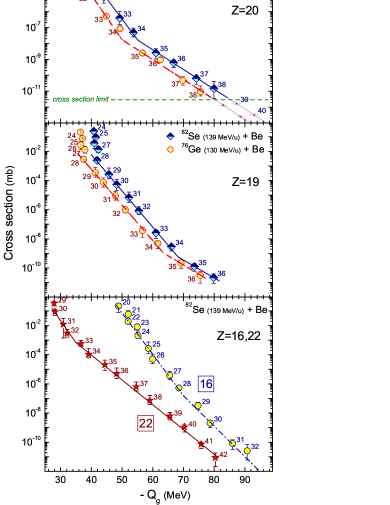
The production cross sections for the most neutron-rich projectile fragments have been previously shown to have an exponential dependence on , where is defined as the difference in mass-excess between the beam particle and the observed fragment Tarasov et al. (2007, 2009b). To test this behavior, the cross sections for each isotopic chain were fitted with the simple expression:
| (2) |
where represents an inverse slope parameter, and is a normalization.
Most of the data from the reactions of 82Se on Be targets in this experiment could be fitted by two inverse slopes with a floating connection point. The trends of the general increase in for all of the heavy isotopes of elements 19, 20, and 21 observed with a 76Ge beam in our previous experiment is reproduced here with the 82Se beam. The cases of 16, 19, 20, and 22 are illustrated in Fig. 7 showing the measured cross sections versus calculated using the masses deduced from the shell model with the GXPF1B5 interaction Utsuno et al. (2012). As in the previous experiment, the heaviest isotopes of elements in the vicinity of 20 appear to deviate from an exponential dependence. The change of slope is most dramatic at . At , the trends show little change in slope for heaviest isotopes. As was pointed out in our previous study Tarasov et al. (2009b), a possible explanation for the exponential slope reduction at larger masses for these elements is a change in binding energy relative to predictions. It should be noted that the systematic variation of the production cross sections of the calcium isotopes as a function of was checked in our previous work with several other well-known mass models and essentially the same behavior was observed (for details, see Fig.10 in Tarasov et al. (2009a)).
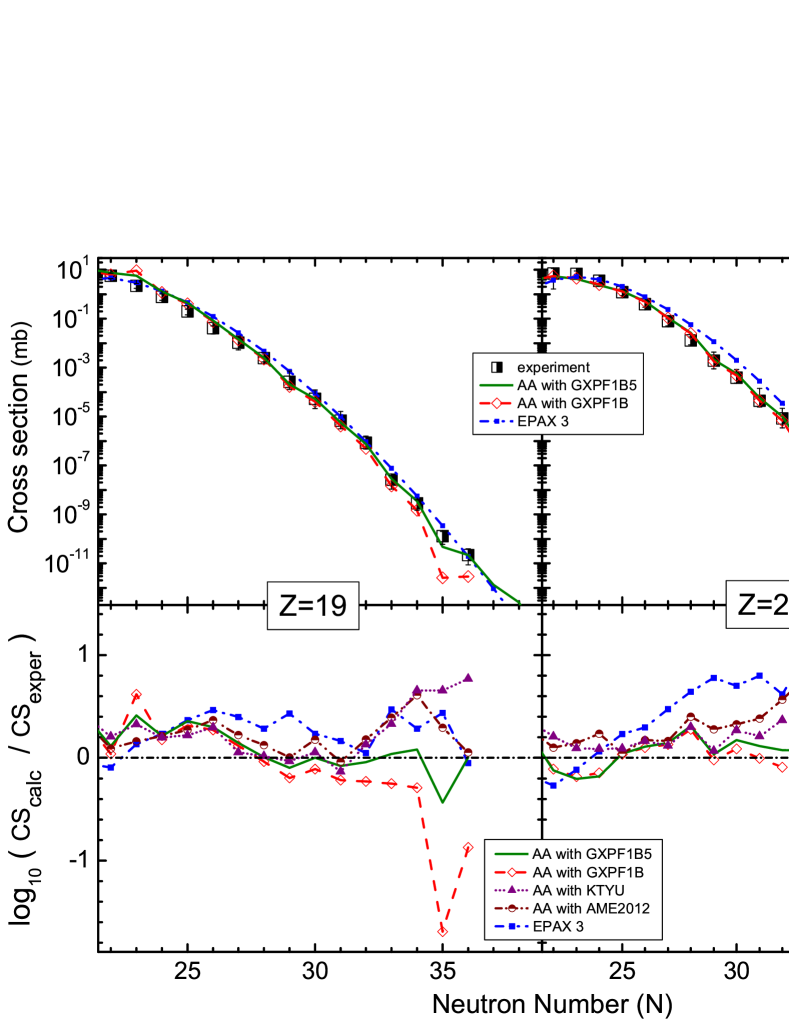
Bottom: Logarithm ratios of calculated and experimental cross sections shown for clearer presentation differences between experimental and calculated values. This presentation includes results from the KTYU model Koura et al. (2005) (solid triangles with dot lines) and the AME2012 table Wang et al. (2012) (semi-solid circles with dash-dot lines).
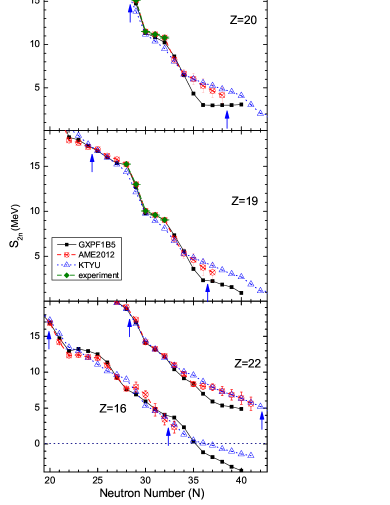
A hint at the origin of the cross section systematics may be seen in the binding energy trends demonstrated in Fig. 8, where the dependence of is shown as a function neutron number in the neutron-rich region for sulfur, potassium, calcium and titanium based on masses from models and experimentally measured values. There is no abrupt behavior for potassium and calcium in the KTYU model Koura et al. (2005) or the AME2012 mass table Wang et al. (2012). The slopes of the trends for both elements in the region do not change significantly. On the other hand for two-neutron separation energy lines calculated with the full -shell phenomenological GXPF1B5 Honma et al. (2005) interactions, changes in the slope are observed between and for potassium and calcium isotopes near the same neutron number where the cross section systematics change. Because 55Ca (=35) is predicted by the shell-model with the GXPF1B5 effective interaction Utsuno et al. (2012) to have a low one-neutron separation energy of 0.75 MeV, we might expect that the change of slope in Fig. 7 would correspond to instead of . Thus, it is possible that the trends seen in our cross section data reflect the subshell closure predicted by the GXPF1B5 shell model Utsuno et al. (2012). Similar breaks in the slopes are seen in the data at , but they are not as dramatic as at .
IV.4 Global trends of cross sections
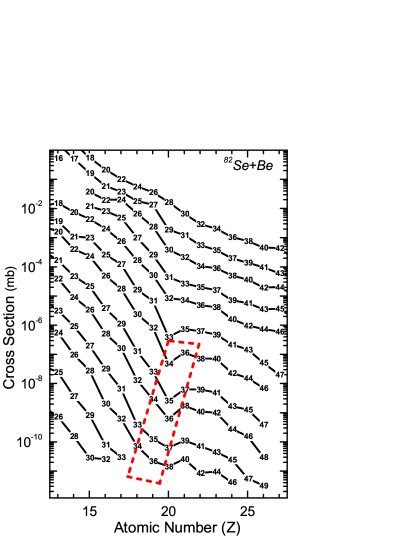
A way to visualize the possible effect of the subshell closure is to plot the production cross sections versus atomic number. Fig. 9 shows the data connected by lines of constant , which represent changes between nuclei different by a triton, and the label at each point is the neutron number (). This ensemble of lines exhibits a large dip at the shell closure at 20 in the region of 54-56Ca highlighted by the red-dashed quadrangle. The same dip can be observed in a similar figure generated from the cross sections measured in the 76Ge measurements Tarasov et al. (2009a).
A reason that these trends may be visible in lines of in Fig. 9 is that such nuclei have approximately the same neutron separation energy and the drip-line lies close to an line for . Further, each line connects nuclei with either an odd or even number of neutrons; hence, the large odd-even difference in nuclear binding due to pairing is not present along each line. For a constant separation energy we expect the cross section to fall smoothly with in Fig. 9. At , the (sub)shell closures correspond to a lower and and might be responsible for the dip in the trends, highlighted by the red box.
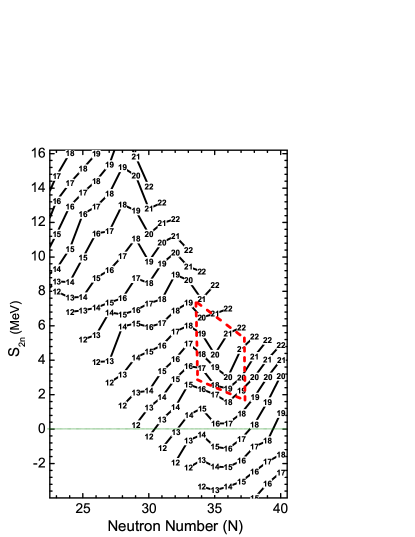
To illustrate this, two-neutron separation energy versus neutron number () of elements calculated with the full -shell GXPF1B5 interactions Utsuno et al. (2012) is shown in Fig. 10. The label at each point is the atomic number () and the red-dashed quadrangle encompasses the same region as the one in Fig. 9 for isotopes with and . The subshell closure results in a lowering of the values for as seen in the figure, corresponding to the same nuclei that have relatively low production cross sections compared to the trends in Fig. 9.
Based on the observations discussed above, it seems possible that the production cross section systematics provide a hint of a change of the nuclear mass surface. The effect is most pronounced close to the drip-line. Plotting the cross section of elements against can exhibit sudden changes in slope that are correlated with regions of changes in the nuclear structure, such as (sub)shell closures.
IV.5 Abrasion-Ablation model
In order to test the relationship between cross sections and separation energies, the production cross sections obtained in this experiment were compared with those from calculations with the Abrasion-Ablation model Tarasov and Bazin (2003) implemented in the LISE++ code Tarasov and Bazin (2008). Results for neutron-rich isotopes of potassium and calcium using different mass models are shown in Fig. 11. Predictions of the EPAX systematics are shown on the plots for comparison. An excitation energy of 15 MeV per abraded nucleon was deduced from an experimental data fit of the Abrasion-Ablation (AA) model with AME2012 masses Wang et al. (2012) and masses deduced from the shell model using the GXPF1B interactions Honma et al. (2005), whereas a value 18 MeV has been obtained with KTYU masses Koura et al. (2005). The LISE++ LDM1 paramaterization was used to extrapolate masses of very neutron-rich nuclei absent in AME2012 and GXPF1B mass predictions. The AA model with GXPF1B masses significantly underestimates cross sections for isotopes with such as 54,55K and 55-57Ca, whereas fair agreement is observed using GXPF1B5 masses. Decreasing the effective energy gap between adjacent neutron single-particle orbitals and in GXPF1B makes isotopes with around calcium more particle bound, therefore the result of the 54Ca measurement Steppenbeck is in good agreement with the measured cross sections and whose calculated using the AA model with GXPF1B5 masses.
IV.6 Estimation of 60Ca production cross section
| Primary | Estimation | 59Ca | 60Ca |
|---|---|---|---|
| beam | method | cross section | cross section |
| (mb) | (mb) | ||
| 82Se | AA | 1.39e-12 | 4.83e-13 |
| 82Se | 1.62e-12 | 3.19e-13 | |
| 76Ge | 1.36e-12 | 2.47e-13 | |
| 82Se | EPAX | 3.73e-13 | 1.65e-14 |
| 76Ge | EPAX | 3.68e-13 | 1.71e-14 |
Based on experimental -systematics (Fig.7) and Abrasion-Ablation model calculations (Fig. 11) using GXPF1B5 masses, it is possible to estimate the production cross sections for the next unobserved calcium isotopes using a 82Se beam (See Table 2). According to this extrapolation, to observe one event of 59Ca, the beam intensity has to be increased by a factor of 2 compared to this experiment. For the case of 60Ca, at least an order magnitude higher beam intensity is needed. It is important to note, that the EPAX systematics Sümmerer (2012) predict a factor of 20 less production for the 60Ca isotope, compared to both -systematics and AA calculations ( mb), that makes the search for 60Ca more likely to be successful in the near future.
V Summary
The present study of fragmentation of a 82Se beam at 139 MeV/u found evidence for four previously unobserved neutron-rich isotopes (64Ti, 67V, 69Cr, 72Mn). The longitudinal momentum distributions and cross sections for a large number of neutron-rich nuclei produced by the 82Se beam were measured by varying the target thickness in a two-stage fragment separator using a narrow momentum selection. The momentum distributions of 126 neutron-rich isotopes of elements with were compared to models that describe the shape and centroid of momentum distributions. From these measurements we have obtained a new set of parameters for the semiempirical momentum distribution models Morrissey (1989); Goldhaber (1974).
The most neutron-rich nuclei of elements with 19 to 21 have been produced with an enhanced rate compared to the systematics of the production cross sections from the systematics. This trend was previously reported for the fragmentation of a 76Ge beam Tarasov et al. (2009b), and therefore the current results confirm those of our previous experiment. This is an indication of a change in the nuclear mass surface near for very neutron-rich nuclei. This result has been explained with a shell model that predicts a subshell closure at 34 and a more pronounced one at 20. We have shown that production cross section systematics can provide a hint of a change of the nuclear mass surface close to the drip-line. Plotting the cross section of elements against can exhibit sudden changes in slope that are correlated with regions of changes in the nuclear structure, such as (sub)shell closures. A correlation to the nuclear mass models has been shown via plots of the two-neutron separation energy.
It has been shown that the Abrasion-Ablation model is very sensitive to the input mass values for the most exotic nuclei. The measured cross sections were best reproduced by using masses derived from the full pf shell model space with the GXPF1B5 Honma et al. (2005) effective interaction modified to a recent 54Ca measurement Steppenbeck .
The cross section for production of 60Ca using a 82Se beam on beryllium has been estimated at barn. This estimate is based on both -systematics and Abrasion-Ablation calculations using masses derived from the shell-model effective interaction GXPF1B5 Utsuno et al. (2012).
Acknowledgements.
The authors would like to acknowledge the operations staff of the NSCL for developing the intense 82Se beam necessary for this study. This work was supported by the U.S. National Science Foundation under grants PHY-06-06007, PHY-10-68217, and PHY-11-02511. Discussions with Prof. V. G. Zelevinsky are very appreciated.References
- Tarasov et al. (2009a) O. B. Tarasov, M. Portillo, A. M. Amthor, T. Baumann, D. Bazin, A. Gade, T. N. Ginter, M. Hausmann, N. Inabe, T. Kubo, D. J. Morrissey, A. Nettleton, J. Pereira, B. M. Sherrill, A. Stolz, and M. Thoennessen, Phys. Rev. C 80, 034609 (2009a).
- Tarasov et al. (2009b) O. B. Tarasov, D. J. Morrissey, A. M. Amthor, T. Baumann, D. Bazin, A. Gade, T. N. Ginter, M. Hausmann, N. Inabe, T. Kubo, A. Nettleton, J. Pereira, M. Portillo, B. M. Sherrill, A. Stolz, and M. Thoennessen, Phys. Rev. Lett. 102, 142501 (2009b).
- Ohnishi et al. (2010) T. Ohnishi, T. Kubo, K. Kusaka, A. Yoshida, K. Yoshida, M. Ohtake, N. Fukuda, H. Takeda, D. Kameda, K. Tanaka, N. Inabe, Y. Yanagisawa, Y. Gono, H. Watanabe, H. Otsu, H. Baba, T. Ichihara, Y. Yamaguchi, M. Takechi, S. Nishimura, H. Ueno, A. Yoshimi, H. Sakurai, T. Motobayashi, T. Nakao, Y. Mizoi, M. Matsushita, K. Ieki, N. Kobayashi, K. Tanaka, Y. Kawada, N. Tanaka, S. Deguchi, Y. Satou, Y. Kondo, T. Nakamura, K. Yoshinaga, C. Ishii, H. Yoshii, Y. Miyashita, N. Uematsu, Y. Shiraki, T. Sumikama, J. Chiba, E. Ideguchi, A. Saito, T. Yamaguchi, I. Hachiuma, T. Suzuki, T. Moriguchi, A. Ozawa, T. Ohtsubo, M. A. Famiano, H. Geissel, A. S. Nettleton, O. B. Tarasov, D. P. Bazin, B. M. Sherrill, S. L. Manikonda, and J. A. Nolen, J. Phys. Soc. Jpn. 79, 073201 (2010).
- Baumann et al. (2007) T. Baumann, A. M. Amthor, D. Bazin, B. A. Brown, C. M. Folden III, A. Gade, T. N. Ginter, M. Hausmann, M. Matos, D. J. Morrissey, M. Portillo, A. Schiller, B. M. Sherrill, A. Stolz, O. B. Tarasov, and M. Thoennessen, Nature 442, 1022 (2007).
- Tarasov et al. (2007) O. B. Tarasov, T. Baumann, A. M. Amthor, D. Bazin, C. M. Folden III, T. N. Ginter, M. Hausmann, M. Matos, D. J. Morrissey, A. Nettleton, M. Portillo, A. Schiller, B. M. Sherrill, A. Stolz, and M.Thoennessen, Phys. Rev. C 75, 064613 (2007).
- Mantica et al. (2008a) P. F. Mantica, H. L. Crawford, J. Pereira, J. S. Pinter, J. B. Stoker, R. Broda, B. Fornal, R. V. F. Janssens, X. Wang, S. Zhu, N. Hoteling, W. B. Walters, C. R. Hoffman, and S. L. Tabor, Bull. Am. Phys. Soc. 53, 64 (2008a).
- Koura et al. (2005) H. Koura, T. Tachibana, M. Uno, and M. Yamada, Prog. Theo. Phys. 113, 305 (2005).
- Thibault et al. (1975) C. Thibault, R. Klapisch, C. Rigaud, A. M. Poskanzer, R. Prieels, L. Lessard, and W. Reisdorf, Phys. Rev. C 75, 644 (1975).
- Campi et al. (1975) X. Campi, H. Flocard, A. K. Kerman, and S. Koonin, Nucl. Phys. A 251, 193 (1975).
- Warburton et al. (1990) E. K. Warburton, J. A. Becker, and B. A. Brown, Phys. Rev. C 41, 1147 (1990).
- Guillemaud-Mueller et al. (1984) D. Guillemaud-Mueller, C. Detraz, M. Langevin, F. Naulin, M. D. Saint-Simon, C. Thibault, F. Touchard, and M. Epherre, Nucl. Phys. A 426, 37 (1984).
- Motobayashi et al. (1995) T. Motobayashi, Y. Ikeda, Y. Ando, K. Ieki, M. Inoue, N. Iwasa, T. Kikuchi, M. Kurokawa, S. Moriya, S. Ogawa, H. Murakami, S. Shimoura, Y. Yanagisawa, T. Nakamura, Y. Watanabe, M. Ishihara, T. Teranishi, H. Okuno, and R. F. Casten, Phys. Lett. B 346, 9 (1995).
- Yoneda et al. (2001) K. Yoneda, H. Sakurai, T. Gomi, T. Motobayashi, N. Aoi, N. Fukuda, U. Futakami, Z. Gacsi, Y. Higurashi, N. Imai, N. Iwasa, H. Iwasaki, T. Kubo, M. Kunibu, M. Kurokawa, Z. Liu, T. Minemura, A. Saito, M. Serata, S. Shimoura, S. Takeuchi, Y. X. Watanabe, K. Yamada, Y. Yanagisawa, K. Yogo, A. Yoshida, and M. Ishihara, Phys. Lett. B 499, 233 (2001).
- Yanagisawa et al. (2003) Y. Yanagisawa, M. Notani, H. Sakurai, M. Kunibu, H. Akiyoshi, N. Aoi, H. Baba, K. Demichi, N. Fukuda, H. Hasegawa, Y. Higurashi, M. Ishihara, N. Iwasa, H. Iwasaki, T. Gomi, S. Kanno, M. Kurokawa, Y. U. Matsuyama, S. Michimasa, T. Minemura, T. Mizoi, T. Nakamura, A. Saito, M. Serata, S. Shimoura, T. Sugimoto, E. Takeshita, S. Takeuchi, K. Ue, K. Yamada, K. Yoneda, and T. Motobayashi, Phys. Lett. B 566, 84 (2003).
- Church et al. (2005) J. A. Church, C. M. Campbell, D.-C. Dinca, J. Enders, A. Gade, T. Glasmacher, Z. Hu, R. V. F. Janssens, W. F. Mueller, H. Olliver, B. C. Perry, L. A. Riley, and K. L. Yurkewicz, Phys. Rev. C 72, 054320 (2005).
- Hannawald et al. (1999) M. Hannawald, T. Kautzsch, A. Wohr, W. B. Walters, K.-L. Kratz, V. N. Fedoseyev, V. I. Mishin, W. Bohmer, B. Pfeiffer, V. Sebastian, Y. Jading, U. Koster, J. Lettry, H. L. Ravn, and the ISOLDE Collaboration, Phys. Rev. Lett. 82, 1391 (1999).
- Sorlin et al. (2003) O. Sorlin, C. Donzaud, F. Nowacki, J. C. Angelique, F. Azaiez, C. Bourgeois, V. Chiste, Z. Dlouhy, S. Grevy, D. Guillemaud-Mueller, F. Ibrahim, K.-L. Kratz, M. Lewitowicz, S. M. Lukyanov, J. Mrazek, Y. E. Penionzhkevich, F. de Oliveira Santos, B. Pfeiffer, F. Pougheon, A. Poves, M. G. Saint-Laurent, and M. Stanoiu, Eur. Phys. J. A 16, 55 (2003).
- Adrich et al. (2008) P. Adrich, A. M. Amthor, D. Bazin, M. D. Bowen, B. A. Brown, C. M. Campbell, J. M. Cook, A. Gade, D. Galaviz, T. Glasmacher, S. McDaniel, D. Miller, A. Obertelli, Y. Shimbara, K. P. Siwek, J. A. Tostevin, and D. Weisshaar, Phys. Rev. C 77, 054306 (2008).
- Aoi et al. (2009) N. Aoi, E. Takeshita, H. Suzuki, S. Takeuchi, S. Ota, H. Baba, S. Bishop, T. Fukui, Y. Hashimoto, H. J. Ong, E. Ideguchi, K. Ieki, N. Imai, M. Ishihara, H. Iwasaki, S. Kanno, Y. Kondo, T. Kubo, K. Kurita, K. Kusaka, T. Minemura, T. Motobayashi, T. Nakabayashi, T. Nakamura, T. Nakao, M. Niikura, T. Okumura, T. Ohnishi, H. Sakurai, S. Shimoura, R. Sugo, D. Suzuki, M. K. Suzuki, M. Tamaki, K. Tanaka, Y. Togano, and K. Yamada, Phys. Rev. Lett. 102, 012502 (2009).
- Gade et al. (2010) A. Gade, R. V. F. Janssens, T. Baugher, D. Bazin, B. A. Brown, M. P. Carpenter, C. J. Chiara, A. N. Deacon, S. J. Freeman, G. F. Grinyer, C. R. Hoffman, B. P. Kay, F. G. Kondev, T. Lauritsen, S. McDaniel, K. Meierbachtol, A. Ratkiewicz, S. R. Stroberg, K. A. Walsh, D. Weisshaar, R. Winkler, and S. Zhu, Phys. Rev. C 81, 051304 (2010).
- Rother et al. (2011) W. Rother, A. Dewald, H. Iwasaki, S. M. Lenzi, K. Starosta, D. Bazin, T. Baugher, B. A. Brown, H. L. Crawford, C. Fransen, A. Gade, T. N. Ginter, T. Glasmacher, G. F. Grinyer, M. Hackstein, G. Ilie, J. Jolie, S. McDaniel, D. Miller, P. Petkov, T. Pissulla, A. Ratkiewicz, C. A. Ur, P. Voss, K. A. Walsh, D. Weisshaar, and K.-O. Zell, Phys. Rev. Lett. 106, 022502 (2011).
- Zhu et al. (2006) S. Zhu, A. N. Deacon, S. J. Freeman, R. V. F. Janssens, B. Fornal, M. Honma, F. R. Xu, R. Broda, I. R. Calderin, M. P. Carpenter, P. Chowdhury, F. G. Kondev, W. Krolas, T. Lauritsen, S. N. Liddick, C. J. Lister, P. F. Mantica, T. Pawlat, D. Seweryniak, J. F. Smith, S. L. Tabor, B. E. Tomlin, B. J. Varley, and J. Wrzesinski, Phys. Rev. C 74, 064315 (2006).
- Brown (2001) B. A. Brown, Prog. Part. Nucl. Phys. 47, 517 (2001).
- Lenzi et al. (2010) S. M. Lenzi, F. Nowacki, A. Poves, and K. Sieja, Phys. Rev. C 82, 054301 (2010).
- Mantica et al. (2008b) P. F. Mantica, R. Broda, H. L. Crawford, A. Damaske, B. Fornal, A. A. Hecht, C. Hoffman, M. Horoi, N. Hoteling, R. V. F. Janssens, J. Pereira, J. S. Pinter, J. B. Stoker, S. L. Tabor, T. Sumikama, W. B. Walters, X. Wang, and S. Zhu, Phys. Rev. C 77, 014313 (2008b).
- Honma et al. (2005) M. Honma, T. Otsuka, B. A. Brown, and T. Mizusaki, Eur.Phys.J. A 25, Supplement 1, 499 (2005).
- Poves et al. (2001) A. Poves, J. Sánchez-Solano, E. Caurier, and F. Nowacki, Nucl. Phys. A 694, 157 (2001).
- (28) D. Steppenbeck, talk given at the International Symposium ’Exotic Nuclear Structure From Nucleons’ (ENSFN 2012) Tokyo, Japan, October 10-12, 2012 .
- Utsuno et al. (2012) Y. Utsuno, T. Otsuka, B. A. Brown, M. Honma, T. Mizusaki, and N. Shimizu, Phys. Rev. C 86, 051301(R) (2012).
- Morrissey et al. (2003) D. J. Morrissey, B. M. Sherrill, M. Steiner, A. Stolz, and I. Wiedenhöver, Nucl. Instrum. Meth. Phys. Res. B 204, 90 (2003).
- Bazin et al. (2003) D. Bazin, J. Caggiano, B. M. Sherrill, J. Yurkon, and A. Zeller, Nucl. Inst. Meth. B 204, 629 (2003).
- Grzywacz et al. (1995) R. Grzywacz, R. Anne, G. Auger, D. Bazin, C. Borcea, V. Borrel, J. M. Corre, T. Dorfler, A.Fomichov, M. Gaelens, D. Guillemaud-Mueller, R. Hue, M. Huyse, Z. Janas, H. Keller, M. Lewitowicz, S. Lukyanov, A. C. Mueller, Y. Penionzhkevich, M. Pfutzner, F. Pougheon, K. Rykaczewski, M. G. Saint-Laurent, K. Schmidt, W.-D. Schmidt-Ott, O. Sorlin, J. Szerypo, O. Tarasov, J. Wauters, and J. Zylicz, Phys. Lett. B 355, 439 (1995).
- Tarasov and Bazin (2008) O. B. Tarasov and D. Bazin, Nucl. Inst. Meth. B 266, 4657 (2008), http://lise.nscl.msu.edu.
- Tarasov et al. (2010) O. B. Tarasov, D. Bazin, T. Baumann, A. Gade, T. N. Ginter, M. Hausmann, D. J. Morrissey, J. Pereira, M. Portillo, B. M. Sherrill, A. Stolz, and M. Thoennessen, Nucl. Inst. Meth. A 620, 578 (2010).
- Goldhaber (1974) A. S. Goldhaber, Phys. Lett. B 53, 306 (1974).
- Morrissey (1989) D. J. Morrissey, Phys. Rev. C 39, 460 (1989).
- Tarasov and et al. (2013) O. B. Tarasov and et al., in preparation (2013).
- Tarasov (2004) O. Tarasov, Nucl. Phys. A 734, 536 (2004).
- Borrel et al. (1983) V. Borrel, D. Guerreau, J. Galin, B. Gatty, D. Jacquet, and X. Tarrago, Z. Phys. A 314, 191 (1983).
- Sümmerer (2012) K. Sümmerer, Phys. Rev. C 86, 014601 (2012).
- Sümmerer and Blank (2000) K. Sümmerer and B. Blank, Phys. Rev. C 61, 034607 (2000).
- Gallant et al. (2012) A. T. Gallant, J. C. Bale, T. Brunner, U. Chowdhury, S. Ettenauer, A. Lennarz, D. Robertson, V. V. Simon, A. Chaudhuri, J. D. Holt, A. A. Kwiatkowski, E. Mané, J. Menéndez, B. E. Schultz, M. C. Simon, C. Andreoiu, P. Delheij, M. R. Pearson, H. Savajols, A. Schwenk, and J. Dilling, Phys. Rev. Lett. 109, 032506 (2012).
- Wang et al. (2012) M. Wang, G. Audi, A. H. Wapstra, F. G. Kondev, M. MacCormick, X. Xu, and B. Pfeiffer, Chinese Physics C 36, 1603 (2012).
- Tarasov and Bazin (2003) O. B. Tarasov and D. Bazin, Nucl. Inst. Meth. B 207, 174 (2003).