The Clusters AgeS Experiment (CASE):
The blue straggler Star M55-V60 caught amidst rapid mass exchange***This paper
uses data obtained with the Magellan 6.5 m telescopes located at Las Campanas Observatory, Chile.
M. R o z y c z k a1,
J. K a l u z n y1,
I. B. T h o m p s o n2,
S. M. R u c i n s k i3,
W. P y c h1
and W. K r z e m i n s k i1
1Nicolaus Copernicus Astronomical Center, ul. Bartycka 18, 00-716 Warsaw, Poland
e-mail: (jka, mnr, wk, wp)@camk.edu.pl
2The Observatories of the Carnegie Institution of Washington, 813 Santa Barbara Street, Pasadena, CA 91101, USA
e-mail: ian@obs.carnegiescience.edu
3Department of Astronomy and Astrophysics, University of Toronto, 50 St. George Street, Toronto, ON M5S 3H4, Canada
e-mail: rucinski@astro.utoronto.ca
ABSTRACT
We analyze light and velocity curves of the eclipsing blue straggler V60 in the field of the globular cluster M55. We derive , , mag for the primary and , , mag for the secondary. We measure an apparent distance modulus mag. Based on the systemic velocity, distance, and proper motion of V60 we conclude that the system is a member of the cluster and argue that its present state is a result of rapid but conservative mass exchange which the binary is still undergoing. We report a peculiar blue excess on the ascending branch of the primary eclipse of V60 and discuss its possible origin.
globular clusters: individual: M55 – blue stragglers – stars: individual: V60-M55
1 Introduction
The eclipsing variable M55-V60 (henceforth V60) was discovered in 1997 within the CASE project (Kaluzny et al. 2010). Located 27 arcsec from the center of M55, it is a proper motion member of the cluster (Zloczewski et al. 2011). At mag and mag the system belongs to the population of blue stragglers. Kaluzny et al. (2010) compiled photometric data from several seasons and found that the light curve was characteristic of short-period low-mass Algols: deep primary eclipses with mag were followed by shallow secondary ones with mag. The orbital period, equal to 1.183 d, was found to systematically increase. Such properties indicate a semidetached binary in the mass-transfer phase, with the donor being the less massive (secondary) component filling its Roche lobe.
2 Photometric observations
The photometric data collected between 1997 and 2009 were discussed in Kaluzny et al. (2010), but for completeness we repeat here the most important points of their discussion.
According to their findings, season-to-season variations of the light curve in quadratures and in the secondary eclipse do not exceed 0.010-0.015 mag in -band. A significantly stronger variability is observed in the primary minimum, whose depth ranged from mag in 1999 to mag in 2007 and 2009. The primary minimum is symmetric in , allowing for a precise determination of times of minimum (however, as we show and discuss in Sect. 4, the symmetry is broken in ). The diagram of the times of minimum (see Fig 3. in Kaluzny et al. 2010) indicates that the orbital period of V60, which in 2008 was equal to 1.18302140.0000007 d, is increasing at a rate ; i.e. it would be doubled in just 106 years.
A preliminary photometric solution favors a semi-detached configuration with the secondary filling its Roche lobe, consistent with the observed behavior of the period. The luminosity ratios of the components in and bands (obtained from the same solution at quadratures) yield apparent colors mag and mag, respectively for the primary and the secondary. With mag the primary of V60 is located among the SX Phoenicis pulsating variables on the color-magnitude diagram (CMD) of M55. A sinusoidal variation with an amplitude of 0.005 mag and a period of 0.030870.00007 d is indeed observed in out-of eclipse sections of the nightly -light curves.
For the present analysis we use observations from five seasons in which both eclipses were covered (i.e. 1999, 2006, 2007, 2008 and 2009). The data were phased according to the times of minima given in Table 4 of Kaluzny et al. (2010) and merged into the composite and light curves (with 663 and 2666 points, respectively) shown in Fig. 1.
3 Spectroscopic observations and orbital parameters of V60
Our radial velocity data are based on eight observations obtained with the MIKE Echelle spectrograph (Bernstein et al. 2003) on the Magellan II (Clay) telescope at the Las Campanas Observatory. Seven of them were made in 2004 between June 27th and October 3rd, and the eight one in 2005 on September 11th. Each observation consisted of two 1200–1800 s exposures interlaced with an exposure of a Th/Ar lamp. For all observations a arcsec slit was used, and pixel binning was applied. At 438 nm the resolution was 2.7 pixels at a scale of 0.0043 nm/pixel. The spectra were processed using a pipeline developed by Dan Kelson following the formalism of Kelson (2003). In the blue channel of MIKE (380 – 500 nm) the average S/N ratio ranged between 21 and 25. As in the red channel (490 – 1000 nm) it was markedly worse, for radial velocity measurements data from the blue channel only were used.
The original data had a high resolving power (about 40,000), but because the S/N per pixel was rather low, we rebinned the continuum-rectified spectra to a log() scale, convolved them with a Gaussian with FWHM=15 km/s, and rebinned them to 3 km/s steps (i.e. 5 pixels per a resolution interval or 2.5 times over-sampling). This procedure improved the quality of the spectra and adjusted the resolution to better reflect the actual rotational broadening of the lines. The final spectra have 22,300 data points in the wavelength interval of 400 - 500 nm, where the S/N ratio was the highest. The data reprocessed in this way were analyzed with the help of a code based on the broadening function (BF) formalism of Rucinski (2002). The BFs were determined over 261 steps of 3 km/s in a process which is effectively a least squares solution of 22,300 linear equations with a 22,300/261 = 85 times over-determinacy. Templates with , almost exactly matching the value of -1.94 given by Harris (1996; 2010 edition), were selected from the Synthetic Stellar Library of Coelho . (2005). Measurement errors, estimated based on the residuals from the fit described in the next paragraph, amount to 3.6 km s-1 (primary) and 1.9 km s-1 (secondary). Rotational profile fits which are performed automatically within the BF formalism yielded equal to km s-1 for the primary and km s-1 for the secondary (corrections for the assumed Gaussian smoothing with FWHM = 15 km/s were taken into account).
The velocity curve was fitted with the help of the spectroscopic data solver written and kindly provided by Guillermo Torres. On the input to the solver the observed velocities had to be transformed into mass-center velocities of the components in order to account for their asphericity. This was done iteratively by applying the solver to the uncorrected velocities, feeding the solution into PHOEBE31a implementation (Prša & Zwitter 2005) of the Wilson-Devinney model (Wilson & Devinney 1971; Wilson 1979), finding the corrections, and applying the solver again to the corrected velocities. The advantage of this procedure is that Torres’s code automatically calculates the errors of the fitted orbital parameters, which otherwise would have to be estimated with PHOEBE by Monte-Carlo techniques. The measured orbital velocities are listed in Table 1 together with mass-center corrections and residuals from the fit. The fitted velocity curve generated by PHOEBE is shown in Fig. 2, and the orbital parameters obtained from the fit are listed in Table 2 together with formal 1- errors returned by the fitting routine.
4 Photometric solution and system parameters
A closer look at the primary eclipse in reveals a significant asymmetry identifiable in each observing season: the ascending branch is by up to 0.2 mag bluer than the descending one (see Fig. 3). As such an excess is not possible to model within the standard approach, we were forced to discard the affected observational points between phases 0.0 and 0.07. In principle, the pulsational modulation with an amplitude of0.005 mag in mentioned in Sect. 2, which is at least partly responsible for the vertical scatter of points in Fig. 1 should also be removed. However, an amplitude this low is suggestive of nonradial pulsations which are commonly observed in SX Phe stars (e.g. Pych et al. 2001; Olech et al. 2005), and the results of such a procedure applied to the primary eclipse would be unreliable.
The photometric solution was also found with the help of PHOEBE utility which employs the Roche geometry to approximate the shapes of the stars, uses Kurucz model atmospheres, treats reflection effects in detail, and, most importantly, allows for the simultaneous analysis of and data. For the radiative envelope of the primary we adopted a gravity brightening coefficient and a bolometric albedo . The same coefficients for the convective envelope of the secondary were set to and . The effects of reflection were included. Limb darkening coefficients were interpolated from the tables of Claret (2000) with the help of the JKTLD code.†††Written by John Southworth and available at www.astro.keele.ac.uk/jkt/codes/jktld.html Full synchronization of both components was assumed.
An approximate temperature of the primary was calculated from the dereddened index obtained by Kaluzny et al. (2010), using a color-temperature calibration based on the data from the Dartmouth Stellar Evolution Database (Dotter et al. 2008). We decided to employ the synthetic calibration because the starting value mag was too close to the applicability limit of the empirical calibration compiled by Casagrande et al. (2010) which is formally valid for 0.18 mag 1.29 mag (this issue is further discussed in the last paragraph of this Section). For dereddening a value mag with an assumed error of 0.01 mag was used (Harris 1996, 2010 edition). The next approximation was found based on PHOEBE-provided contributions of each component to the total light at quadratures in and bands which allow to calculate the updated observed . The updated was dereddened and translated into temperature the same way as before. The procedure was repeated until the convergence was reached at K (the error is due to uncertainties in calibration, reddening and zero points of and photometry). The temperature of the secondary, , was automatically adjusted by PHOEBE.
The fitted photometric parameters of V60 are listed in Table 3 together with the errors estimated based on additional fits to each of the seasonal and light curves (the ascending branch of the primary eclipse was removed from each -curve while fitting). Table 4 contains the final absolute parameters of the system, hereafter referred to as the standard solution. The residuals from the final fit are shown in Fig. 4. The blue excess on the ascending branch of the main eclipse is clearly visible; it is also evident that the largest -residuals occur within the main eclipse. Apparently, the stream(s) of gas between the components generate an additional light in the system which PHOEBE is not able to account for. The likely variability of such a light source might be responsible for the enhanced scatter observed in -band at the bottom of the main eclipse.
For K and the primary’s gravitational acceleration obtained from our solution, the bolometric correction amounts to -0.07 mag (Dotter et al. 2008; on-line version of Dartmouth Stellar Evolution Database). With mag (Table 4), the absolute magnitude of the primary is mag. From the light curve solution we obtained mag, where the error includes uncertainty of the zero point of the photometry. The apparent distance modulus of V60 is then mag. This is consistent with the value of 13.89 listed by Harris (1996; 2010 edition). With mag, the foreground absorption in -band is mag, corresponding to an absolute distance modulus mag. A very similar value follows from the result obtained by isochrone fitting (Dotter et. al. 2010), who derived an apparent distance modulus of 13.88 mag for the ACS/F814W filter. Since from the calibration of Girardi et al. (2008) one gets mag, the absolute distance modulus becomes mag.
We would like to note, however, that the primary’s bolometric luminosity we derive strongly depends on the effective temperature deduced from the color index. If instead of K we used K resulting from the empirical calibration of Casagrande et al. (2010), we would obtain an unacceptably low value of the absolute distance modulus mag. This casts come doubts on the validity of that calibration for blue low-metallicity stars, and indeed, a closer inspection of Fig. 14 in Casagrande et al. (2010) strongly suggests that for and mag their relation is but an extrapolation.
5 Discussion
The important conclusion following from our analysis is that the mass transfer in V60 must be to a good approximation conservative. This is because the total mass of the system, , is almost exactly two times larger than the M55 turnoff mass of 0.8 (e.g. Zaggia et al. 1997). This, together with the rate of period lengthening and system parameters found in Sect. 4, implies an orbital expansion rate and a mass transfer rate . Thus, V60 is in a phase of a rapid mass exchange, which, given the low mass of the H-shell burning secondary, cannot last longer than a few hundred thousand years. With this in mind, it is interesting to see that the present primary must be quite far from thermal equilibrium, as its temperature is over a thousand K lower than the temperature of a star on the evolutionary track, which according to Dotter et al. (2008) should be equal to 9350 K. We also note that the original mass ratio must have been close to unity – otherwise the original primary would have left the main sequence much earlier, and the system would be in a more advanced evolutionary state (e.g. detached, or semidetached with the present primary filling its Roche lobe).
The blue excess of the system between phases 0.0 and 0.07 (hereafter BEx) is a puzzling feature which to our knowledge has no counterpart in other Algols. Suspecting it might be spurious, we checked if there was a systematic shift between phases calculated for and data points. None was detected. We then tried various means to remove BEx or at least to make it weaker. First, we fitted the complete curve allowing PHOEBE to find a global phase shift that would center the main -minimum at phase 0. Subsequently, with kept fixed, both and curves were fitted. This procedure indeed made the blue excess smaller, but the -fit became significantly worse both in the primary and the secondary minimum. In a second series of experiments we fitted the curves with the descending branch removed from either or and primary minima, allowing for a global phase shift or keeping it fixed at 0. Since the residuals did not look any better in any of those fits, we had to accept the standard solution as the best one we were able to obtain. The encouraging finding was that the parameters of all the trial fits did not differ from the standard ones by more than a factor of 1.5 times the errors given in Table 4. In particular, this means that the masses of the components are determined sufficiently accurately for the conclusion concerning the conservative mass transfer to be firmly footed. We note, however, that while the mass exchange was conservative or nearly conservative, the system must have lost an appreciable amount of the orbital angular momentum , possibly by magnetic braking (see e.g. Eggleton and Kiseleva-Eggleton 2002). At the present value of the minimum orbital separation (which is achieved when ) would be 0.94 – far too small to accommodate two 0.8 stars. Of course, the loss of must have occurred after the equalization of masses, i.e. when the original mass ratio was reversed and the orbital separation began to increase.
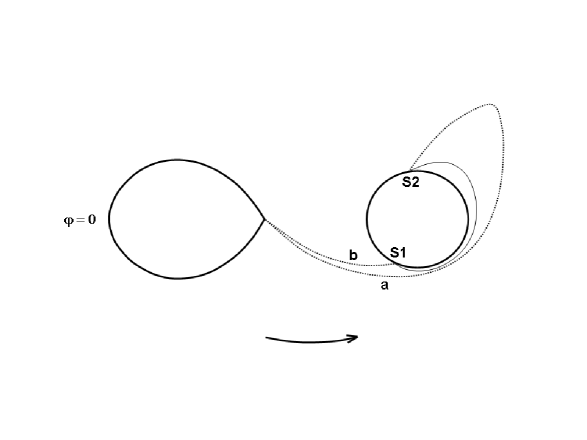
Numerous spectroscopic and photometric effects observed in Algol-like systems are attributed to three dynamical agents: a stream of matter flowing out of the secondary, a regular or transient accretion disk formed by the stream around the primary, and shock waves excited where the stream hits the disk or directly impacts the primary. V60 is a compact system in which there is no space for a regular accretion disc (e.g. Richards 1992), so that the stream directly hits the primary and induces shock waves(s) in its atmosphere. BEx, if real, must also originate in a shock. The problem is that the shock cannot be localized in the standard place where the trailing hemisphere of the secondary is hit by the stream (S1 in Fig. 5): if that were the case, then BEx would show up on the descending branch of the main minimum. We calculate that if a particle leaving the L1 point is to miss the trailing hemisphere and land onto the leading one (path a ending at S2 in Fig. 5) an initial velocity of 0.5 is needed, where is the orbital velocity of the secondary around the mass center. Since in reality the initial velocity is on the order of the thermal velocity, i.e. about a tenth of , the stream must follow path b in Fig. 5 and hit the star at S1. Another shock at S2 can only be formed by the matter reflected off the primary and flowing along the continuous line in Fig. 5. Such an interpretation is not a new one – in fact, it closely resembles the schematic Algol model derived from spectroscopic observations by Gillet et al. (1989) and shown in their Fig. 3. Unfortunately, V60 is too faint for a detailed spectroscopic study, and the only observational proof for the existence of S2 would be a UV emission coinciding in phase with BEx.
We note that speculations about the possibility of stream reflection are not entirely unrealistic: a partial reflection was observed in models of flows in a cataclysmic binary obtained by Rozyczka (1987). Admittedly, in those simulations the stream reflected off the accretion disk, but the physics involved was sufficiently simple that the results may be safely applied to a stellar atmosphere. It should also be mentioned that a reflection from the primary component in an Algol-type system was observed in simulations performed by Richards (1998), however it was to a large extent predetermined by boundary conditions.
Assuming the above explanation of the origin of BEx is feasible we still have to explain why the emission from S2 is only visible in a narrow range of phases, and why the emission from S1 is not visible at all. The only possibility we see is that both shocks are hidden behind gas stream(s): S1 entirely, and S2 partly. This speculation can be verified by detailed hydrodynamical simulations which are beyond the scope of this paper.
Acknowledgements. We thank Joe Smak for helpful discussions and for the permission to use his code for integration of particle trajectories. JK and MR were supported by the grant 2012/05/B/ST9/03931 from the Polish National Science Centre.
REFERENCES
-
Bernstein, R., Shectman, S. A., Gunnels, S. M., Mochnacki, S., and Athey, A. E. 2003, Instrument Design and Performance for Optical/Infrared Ground-based Telescopes, eds. Masanori Iye and Alan F. M. Moorwood. Proceedings of the SPIE, 4841, 1694.
-
Casagrande, L., Ramírez, I., Melńdez, J., Bessell, M., and Asplund, M. 2010, A&A, 512, 54.
-
Claret, A. 2000, A&A, 363, 1081.
-
Coelho, P., Barbuy, B., Meléndez, J., Schiavon, R. P., Castilho, B. V. 2005, A&A, 443, 735.
-
Dotter, A., Chaboyer, B., Jevremović, D., Kostov, V., Baron, E., Ferguson, J. W. 2008, ApJS, 178, 89.
-
Dotter, A. et al. 2010, AJ, 708, 698.
-
Eggleton, P. P., Kiseleva-Eggleton, L. 2002, ApJ, 575, 461.
-
Gillet, D., Mouchet, M., North, P. 1989, A&A, 219, 219.
-
Girardi, L. et al. 2008, PASP, 120, 583.
-
Harris, W. E. 1996, AJ, 112, 1487.
-
Kaluzny, J., Thompson, I. B., Krzeminski, W., and Zloczewski, K. 2010, Acta Astron., 60, 245.
-
Kelson, D. D. 2003, P.A.S.P., 1125, 688.
-
Olech, A., Dziembowski, W. A., Pamyatnykh, A. A., Kaluzny, J., Schwarzenberg-Czerny, A., and Thompson, I. B. 2005, MNRAS, 363, 40.
-
Prša, A., and Zwitter, T. 2005, ApJ, 628, 426.
-
Pych, W., Kaluzny, J., Krzeminski, W., Schwarzenberg-Czerny, A., and Thompson, I. B. 2001, A&A, 367, 148.
-
Richards, M. 1992, ApJ, 387, 329.
-
Richards, M. 1998, ApJ, 493, 326.
-
Rozyczka, M. 1988, Acta Astron., 38, 105.
-
Rucinski, S. M. 2002, AJ, 124, 1746.
-
Wilson, R. E. 1979, ApJ, 234, 1054.
-
Wilson, R. E., and Devinney, E. J. 1971, ApJ, 166, 605.
-
Zaggia, S. R., Piotto, G., and Capaccioli, M. 1997, A&A, 327, 1004.
-
Zloczewski, K., Kaluzny, J., Rozyczka, M., Thompson, I. B. 2011, MNRAS, 414, 3711.
-
Zucker, S., and Mazeh, T. 1994, AJ, 420, 806.
| HJD | Phase | ||||||
|---|---|---|---|---|---|---|---|
| -2453000 | [km/s] | [km/s] | [km/s] | [km/s] | [km/s] | [km/s] | |
| 183.79260 | 0.7523 | 221.66 | -8.87 | 0.07 | -3.49 | 0.27 | 0.44 |
| 206.73462 | 0.1451 | 133.18 | 319.61 | -0.07 | 1.72 | -1.84 | 1.21 |
| 272.53145 | 0.7626 | 226.01 | -7.92 | 0.07 | -3.46 | 4.77 | 0.85 |
| 275.56501 | 0.3269 | 129.41 | 337.27 | -0.03 | 1.23 | -0.98 | 0.70 |
| 276.57721 | 0.1825 | 126.29 | 336.59 | -0.07 | 2.54 | -2.88 | -3.51 |
| 281.51625 | 0.3574 | 138.33 | 317.70 | -0.02 | -0.66 | 2.89 | -1.28 |
| 282.51218 | 0.1994 | 134.86 | 348.79 | -0.07 | 2.92 | 7.54 | 1.94 |
| 989.57690 | 0.8788 | 206.18 | 41.17 | 0.06 | -1.34 | -0.78 | -2.95 |
Columns and contain corrections which have to be added to velocities and in order to transform them into mass-center velocities of the primary () and the secondary ().
| Parameter | Unit | Value |
|---|---|---|
| d | ||
| km s-1 | 173.140.68 | |
| km s-1 | 48.321.59 | |
| km s-1 | 185.960.87 | |
| 0.0b | ||
| km s-1 | 3.56 | |
| km s-1 | 1.91 | |
| Derived quantities: | ||
| 5.4760.046 | ||
| 1.2510.025 | ||
| 0.3250.017 |
aObtained from photometry
bAssumed in fit
| Parameter | Unit | Value |
|---|---|---|
| deg | 86.40.5 | |
| 0a | ||
| K | 8160b | |
| K | 540077 | |
| 1.1020.019 | ||
| 1.480c | ||
| % | 76.51.8 | |
| % | 85.31.5 | |
| mmag | 18 | |
| mmag | 12 |
aAssumed in fit
bObtained from the synthetic calibration
based on the Dartmouth Stellar Evolution Database
cFor fixed = 5.487
| Parameter | Unit | Value |
|---|---|---|
| d | ||
| 5.4870.047 | ||
| deg | 86.40.5 | |
| 0a | ||
| 1.2590.025 | ||
| 0.3270.017 | ||
| 1.1020.021b | ||
| 1.4800.011b | ||
| K | 8160140c | |
| K | 5400160d | |
| mag | 3.030.09 | |
| mag | 4.180.12 |
aAssumed in fit
bErrors include uncertainty in
cCombined error of calibration, reddening
and zero points of and photometry
dError includes uncertainty in