Effect of interface phase transformations on diffusion and segregation in high-angle grain boundaries
Abstract
Recent experimental measurements of Ag impurity diffusion in the grain boundary (GB) in Cu revealed an unusual non-Arrhenius behavior suggestive of a possible structural transformation [Divinski et al., Phys. Rev. B 85, 144104 (2012)]. On the other hand, atomistic computer simulations have recently discovered phase transformations in high-angle GBs in metals [Frolov et al., arXiv:1211.1756v2 (2013)]. In this paper we report on atomistic simulations of Ag diffusion and segregation in two different structural phases of the Cu GB which transform to each other with temperature. The obtained excellent agreement with the experimental data validates the hypothesis that the unusual diffusion behavior seen in the experiment was caused by a phase transformation. The simulations also predict that the low-temperature GB phase exhibits a monolayer segregation pattern while the high-temperature phase features a bilayer segregation. Together, the simulations and experiment provide the first convincing evidence for the existence of structural phase transformations in high-angle metallic GBs and demonstrate the possibility of their detection by GB diffusion measurements and atomistic simulations.
1 Department of Materials Science and Engineering, University of California, Berkeley, California 94720, USA
2 Institute of Materials Physics, University of Münster, Wilhelm-Klemm-Str. 10, D-48149 Münster, Germany
3 School of Physics, Astronomy and Computational Sciences, George Mason University, Virginia, 22030, USA
Motivation. Structural transformations at grain boundaries (GBs) are of fundamental interest as a case of phase transitions in low-dimensional systems. In addition, GB phase transformations can have a significant impact on microstructure, mechanical behavior and transport properties of polycrystalline materials [1, 2]. A number of GB phases have been found in ceramic materials [3, 4], where they often appear in the form of intergranular thin films and are referred to as “complexions” [5]. In metallic alloys, several phases with discrete thickness have been observed, such as the segregated bilayer structure believed to be responsible for the liquid-layer embrittlement effect [6]. However, despite decades of research little is known about GB phase transformations in single-component metals, apart from the recently found dislocation pairing transition in low-angle GBs composed of discrete dislocations [7] and the prediction of temperature-induced phase transformations in high-angle GBs [8]. Presently, there is no direct experimental evidence for structural transformations in metallic GBs. The main reason lies in the extreme difficulty of GB structure characterization by high-resolution transmission electron microscopy (HRTEM) at high temperatures [9, 10].
Several indirect methods have been applied to probe the structural state of GBs, including GB diffusion [11], GB mobility [12] and GB sliding resistance [13]. Recently, impurity diffusion of Ag in a Cu bicrystal with a well-characterized GB has been measured using a radioactive isotope of Ag ( being the reciprocal density of coincidence sites and (310) the GB plane) [14]. At high temperatures, the GB diffusivity was characterized by the diffusion flux , where is the GB diffusion coefficient, is the impurity segregation factor and the thickness of the GB core considered as a uniform layer. The Arrhenius plot shown in Fig. 1 reveals a distinct break in the slope at temperatures around 800 to 850 K. This observation correlates with the similar break found previously for Au diffusion in a similar GB [15]. Such breaks in the slopes of Arrhenius plots usually signify an abrupt change in the diffusion mechanism [11, 16]. On this ground, it was suggested [14, 15] that the GB undergoes a structural phase transformation at about 800-850 K. While a plausible explanation, its confirmation by direct experimental observations is hampered by the mentioned difficulties in HRTEM characterization of GBs at high temperatures.
Much of the current knowledge about GB structures comes from atomistic computer simulations [1, 2]. Many previous simulations have shown a behavior where GBs exhibit structural disorder at high temperatures and eventually melt by either turning into a continuously growing liquid film or triggering bulk melting [1, 2, 14, 17, 18]. However, until the recent report [8] there was no compelling simulation evidence for transformations between different ordered structures in high-angle metallic GBs. Observation of such transformations had been precluded by inadequate simulation methodology which prohibited variations in atomic density in the GB core. When such variations were allowed, several alternate structures and first-order phase transitions between them were found in the and GBs in FCC metals [8]. For the Cu GB, a transformation between two structures was found, with split-kite structural units stable above 800 K and kite units stable at lower temperatures (Fig. 2). The kite structure had been known previously, whereas the split-kite structure is new and was first discovered in [8].
The finding of this phase transformation [8] and the correlation between its temperature and the experimental temperature of the change in the diffusion activation energy [14] lend more credence to the hypothesis that the observed diffusion behavior was caused by a GB phase transformation. However, a convincing proof requires a calculation of the diffusivity in impurity-segregated boundaries in the vicinity of the transformation temperature and demonstration that it indeed reproduces the experiment. It is the goal of this paper to conduct such calculations and validate the proposed hypothesis. We also wish to understand the effect of the transformation on Ag segregation and the role of this segregation in the diffusion behavior.
Methodology. The molecular dynamics (MD) simulations were performed in the canonical (NVT) ensemble and employed the LAMMPS code [19] and the embedded-atom potential for copper [20]. The simulation block with a plane GB with the standard kite structure was created by the usual geometric construction [21] and contained around 47,000 atoms. The block had the approximate dimensions of 6.612.57.00 nm3 with periodic boundary conditions parallel to the GB plane - and free surfaces in the direction normal to the GB plane. The split-kite GB structure was first created by an isothermal 800 K anneal of a GB terminated at free surfaces. The central part of this block was then carved out to create a new simulation block with the same dimensions and the same boundary conditions as for the standard kite structure. The obtained GBs (one with kites and the other with split kites) were disconnected from sinks and sources of atoms and unable to vary their density. Consequently, their structures remained unaltered during the subsequent anneals. Using these simulation blocks, diffusivities of the two GB structures could be studied separately over the same temperature interval.
For each GB structure, a series of isothermal anneals was performed at temperatures from 750 to 1000 K. The simulation time increased from 10 ns at 1000 K to 70 ns at 750 K. Multiple snapshots saved during the simulations were used to analyze the trajectories of atoms diffusing within the GB core. The GB self-diffusion coefficient was computed from the Einstein relation for the direction parallel to the tilt axis and for the perpendicular direction. To validate this methodology, we verified that the mean-squared displacements indeed increased linearly with time as prescribed by the Einstein equation.
While the obtained self-diffusion coefficients are useful as a guide for future research (see discussion below), the experimental measurements [14] were made for Ag impurity diffusion. The generalized Fisher model [11] employed in [14] for the processing and interpretation of the experimental concentration curves assumes that the impurity atoms segregate to the GB and remain in thermodynamic equilibrium with adjacent lattice regions. It was therefore necessary to create equilibrium segregation of Ag in the simulated models. To this end, we used the semi-grand canonical Monte Carlo method [22] with Cu-Ag interactions modeled with the embedded-atom potential [23]. At each temperature , the desired equilibrium chemical composition inside the grains was established by adjusting the imposed chemical potential difference between Ag and Cu. The lattice constant was chosen to eliminate mechanical stresses inside the grains. At each and , an equilibration anneal was performed followed by a production run comprising to Monte Carlo steps per atom. Several dilute grain compositions ranging from 0.001 to 0.1 atomic percent of Ag were implemented at each temperature. At the temperature of 800 K, a more detailed calculation of the segregation isotherm was performed with varying from 0.001% to 0.6%.
The blocks with the equilibrium Ag segregation corresponding to the temperatures between 750 and 1000 K and the same grain composition % were taken as initial configurations for MD simulations of Ag impurity diffusion. As for self-diffusion, was extracted from mean-squared atomic displacements of Ag atoms in the GB core. Since the number of such atoms was significantly less than for self-diffusion, longer MD simulation times ranging from 50 to 70 ns were implemented.
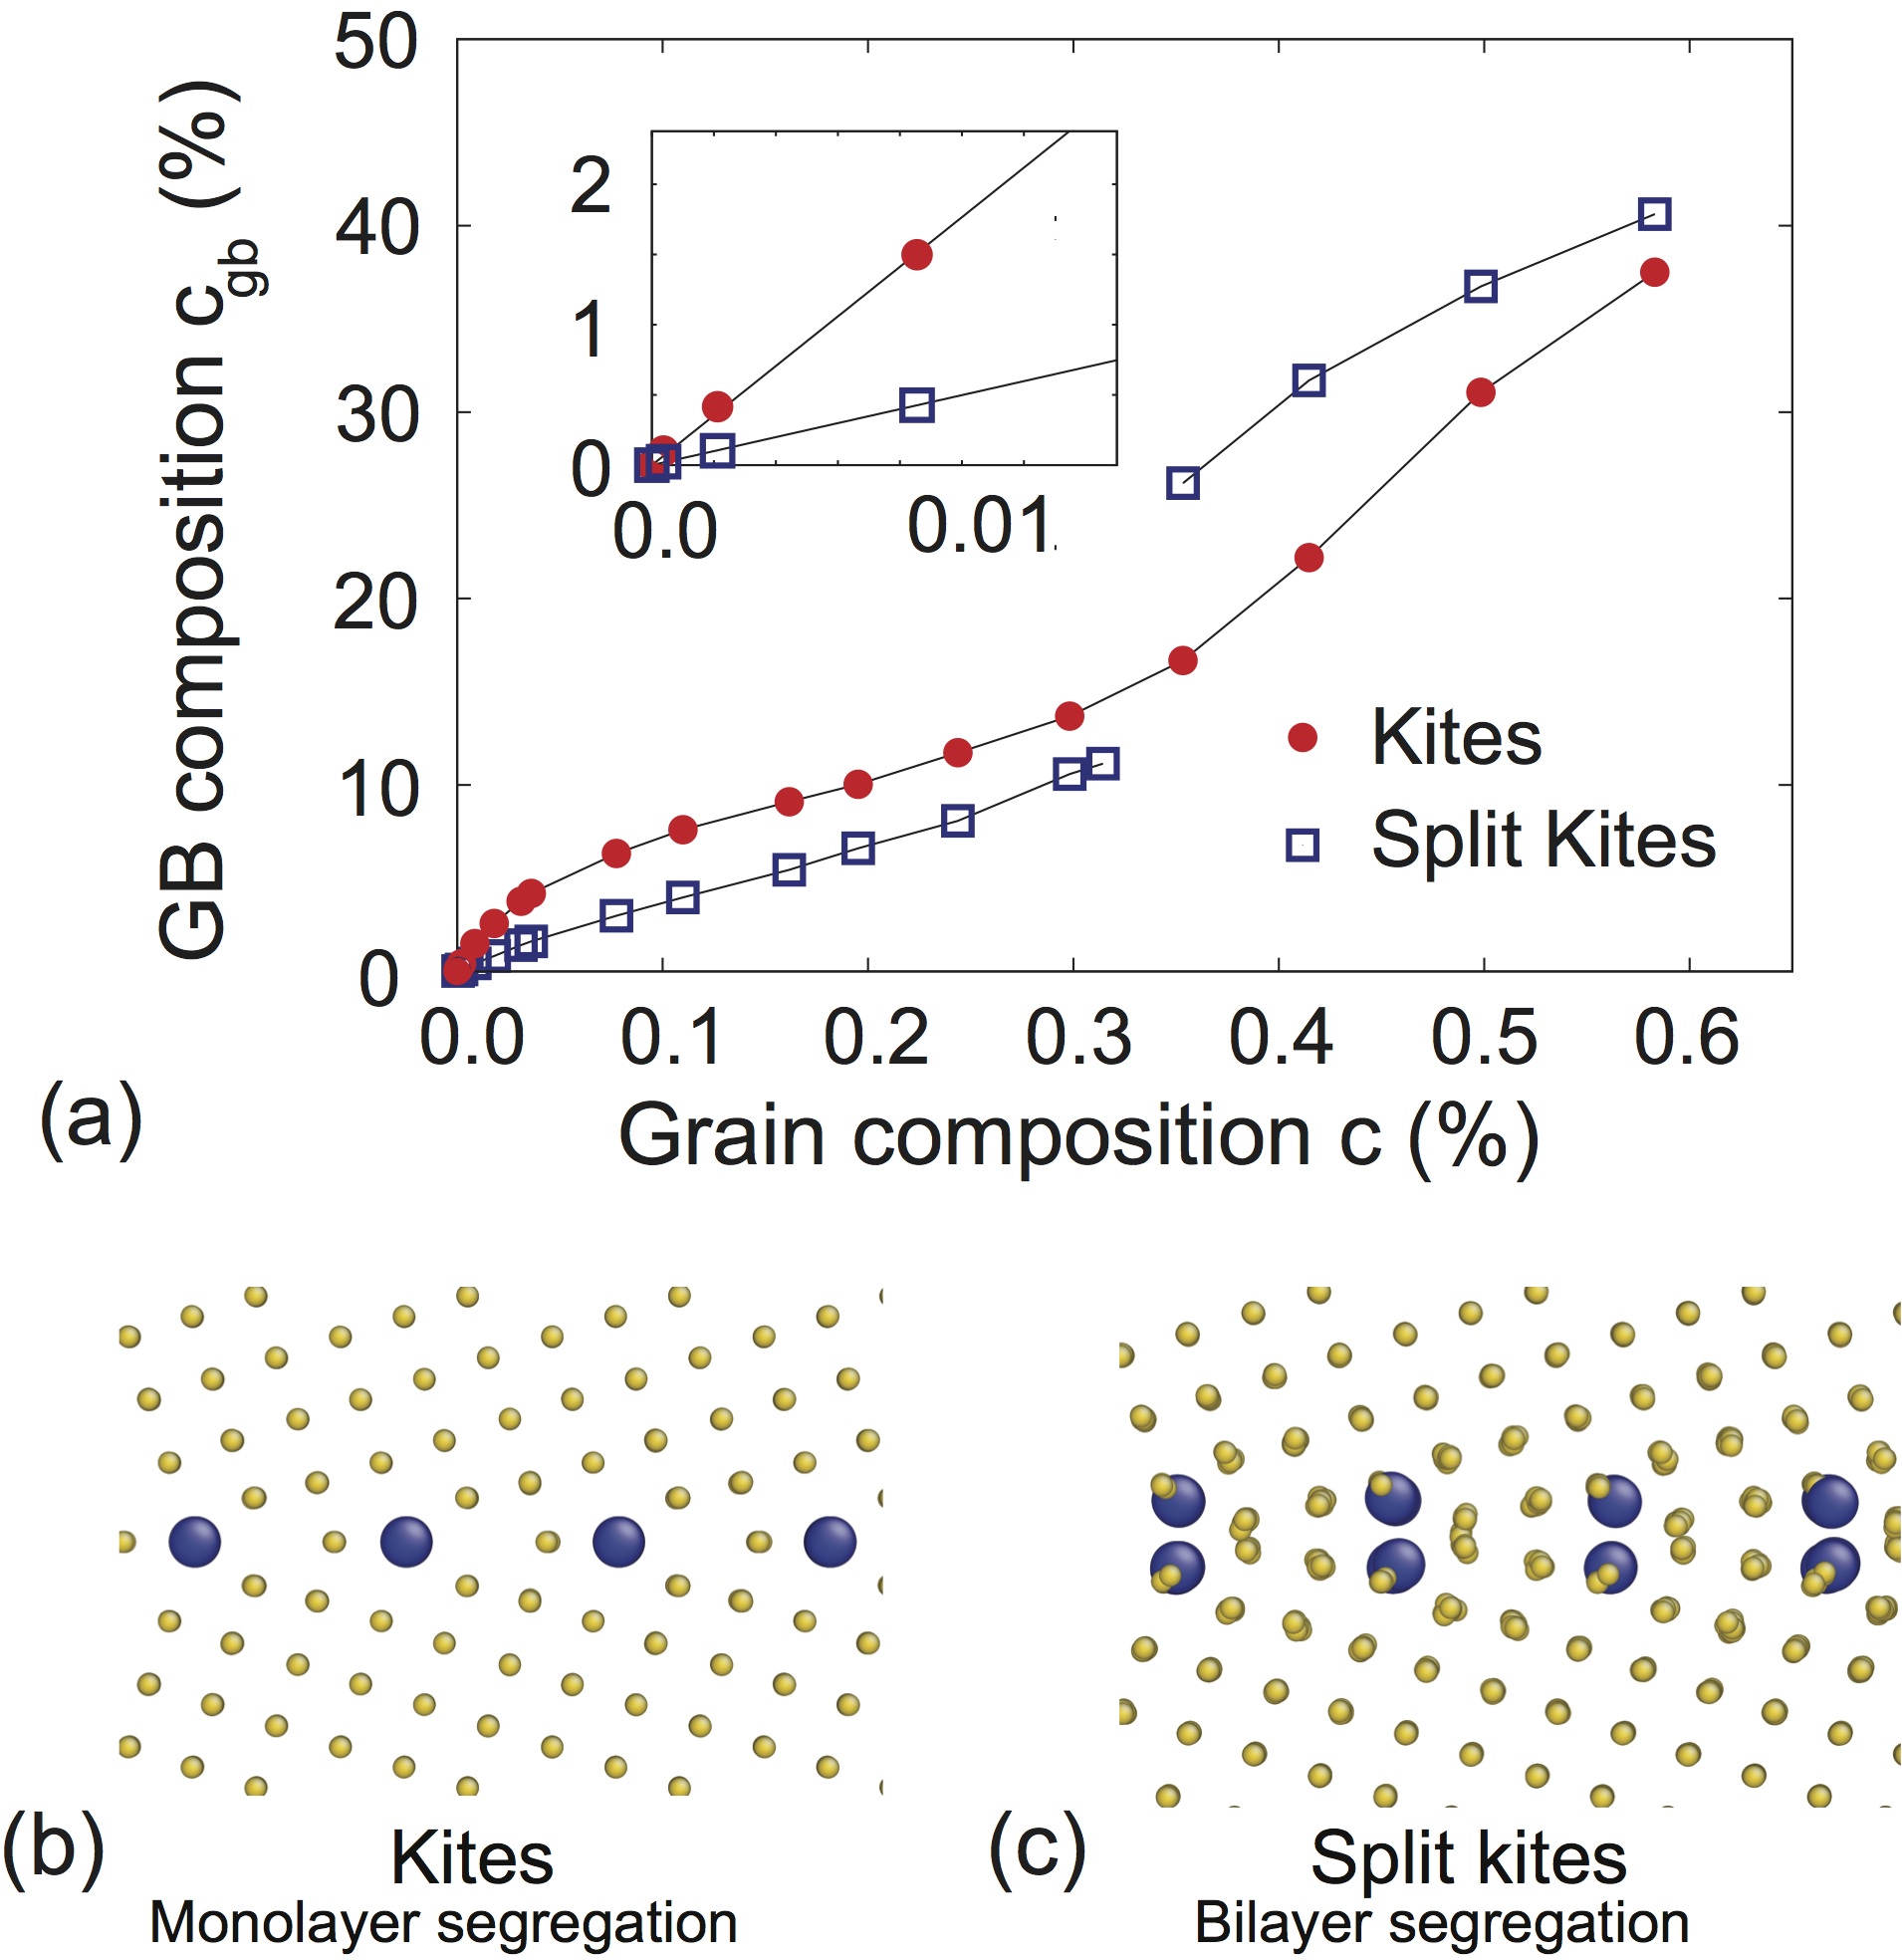
Results. Fig. 3(a) shows the segregation isotherm at 800 K. The GB concentration was obtained by computing the amount of Ag segregation at a constant total number of atoms [24] and assuming the GB thickness 0.5 nm. The segregation factor appearing in the generalized Fisher model [11] must be computed in the dilute regime where it is independent of the grain composition. The dilute regime was also implemented in the diffusion measurements [14], where the radio-tracer Ag atoms only served as a probe of the GB structure. The dilute segregation factor was obtained by a linear fit through the first 3 points near the origin of the plot. Similarly, the segregation factors at all other temperatures were calculated using the first 2-3 points where the isotherm was linear (Henry-type [1, 11]).
It is interesting to examine the segregation behavior beyond the linear regime. As evident from Fig. 3(a), the segregation becomes non-linear and qualitatively consistent with the McLean isotherm [1] between 0.05% and 0.1%. At higher concentrations, however, does not saturate as expected from the McLean isotherm but continues to increase. Furthermore, at about 0.2% the isotherm goes through an inflection point and the increase in accelerates. This behavior is consistent with the experimental isotherms reconstructed from GB diffusion data [25] and is usually indicative of multiple types of segregation sites and/or segregation to multiple layers. Note that the segregation to the standard kite structure is significantly stronger than to the split kites. In addition, the two GB structures exhibit different segregation patterns as illustrated in Fig. 3(b,c). In the case of standard kites, the Ag atoms tend to occupy the tip of the kite, whereas in the split kites they segregate to corners of the kites, creating a bilayer segregation pattern. It should be emphasized that neither the monolayer nor the bilayer are completely filled with Ag atoms. In fact, the total number of atoms segregated into the bilayer is less than for the monolayer. Based on the segregation isotherm one can predict that if the GB structure at a given temperature transforms from standard kites to split kites, the equilibrium Ag segregation must abruptly drop while the segregation type must change from a monolayer to a bilayer. As already mentioned, changes in the segregation type from a monolayer to a bilayer (and possibly three or more layers) were observed experimentally in metallic alloys [6].
It can also be observed that at % the segregation to the split-kite structure abruptly increases. The new GB structure which forms above 0.3% is less ordered and does not follow the bilayer pattern. This segregation jump is suggestive of a segregation-induced structural transformation reminiscent of the one found previously in twist GBs [26]. However, this simulation setup does not permit a conclusive identification of the new phase because the GB is not free to adjust its total atomic density. A more comprehensive study would employ a GB terminated at free surfaces and is beyond the scope of this paper.
The Arrhenius diagram in Fig. 4(a) summarizes the dilute segregation factors for the kite and split-kite structures. Both structures accurately follow the Arrhenius law but with significantly different slopes. The effective segregation energy extracted from the slopes is 74 kJ/mole for the kite structure and 40 kJ/mole for the split-kite structure. Included are also the experimental segregation factors reported in [14]. It should be noted that they were not obtained by direct chemical characterization of the GB but rather back-calculated from the diffusivities measured in different kinetic regimes. Nevertheless, given that the segregation factors span nearly two orders of magnitude, the agreement between the simulations and experiment can be considered favorable.
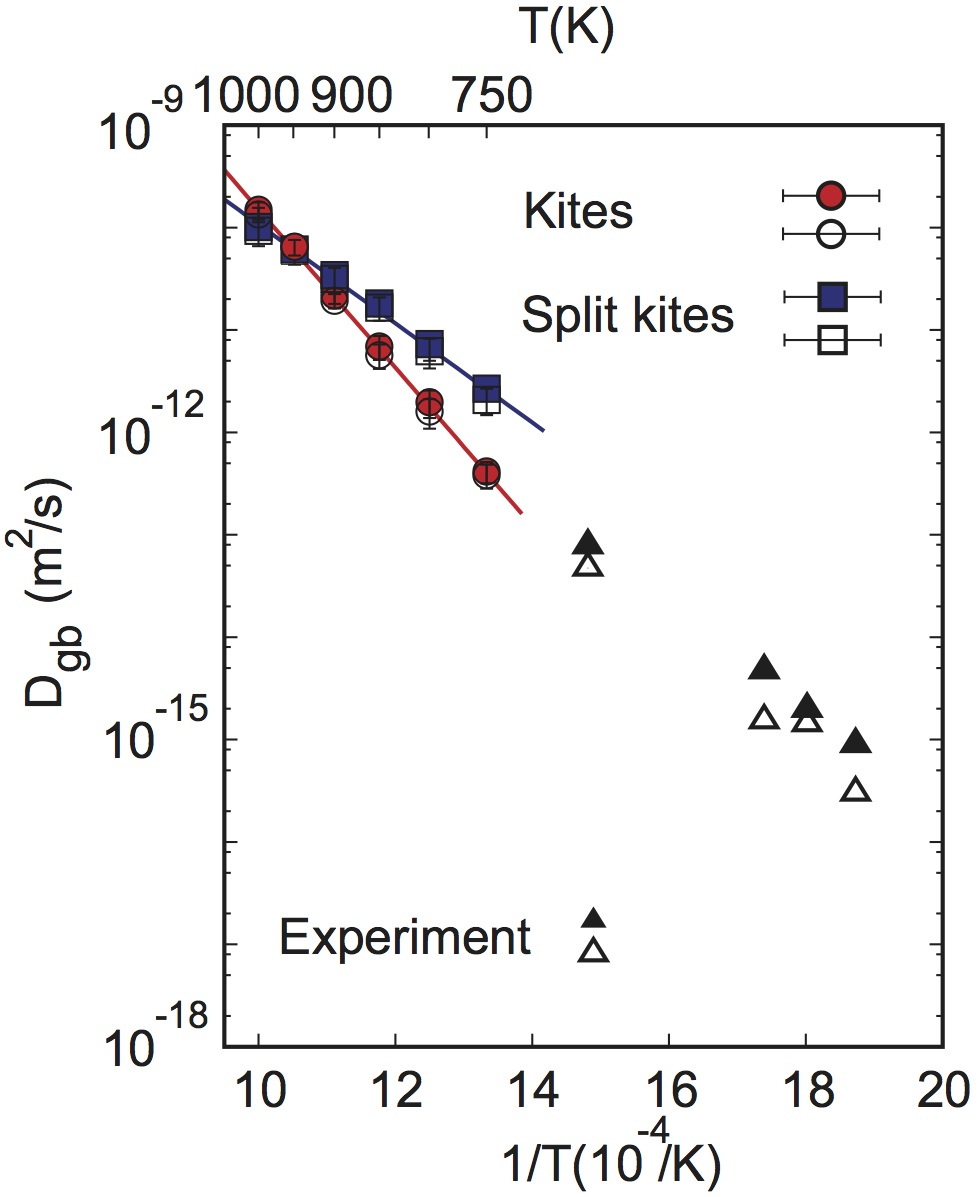
Similarly, the diffusion coefficients of Ag in the two GB structures accurately follow the Arrhenius law [Fig. 4(b)] with the activation energies 149 kJ/mole for the kite structure and 93 kJ/mole for the split-kite structure (averaged over the two diffusion directions). The diffusion coefficient is lower for the split-kite structure at high temperatures and for the standard kite structure at low temperatures. The temperature of the cross-over between the two diffusivities correlates well with the experiment (cf. Fig. 1). Furthermore, extrapolation of the kite diffusivity to lower temperatures gives good agreement with the experimental values measured in the type-C kinetic regime [14].
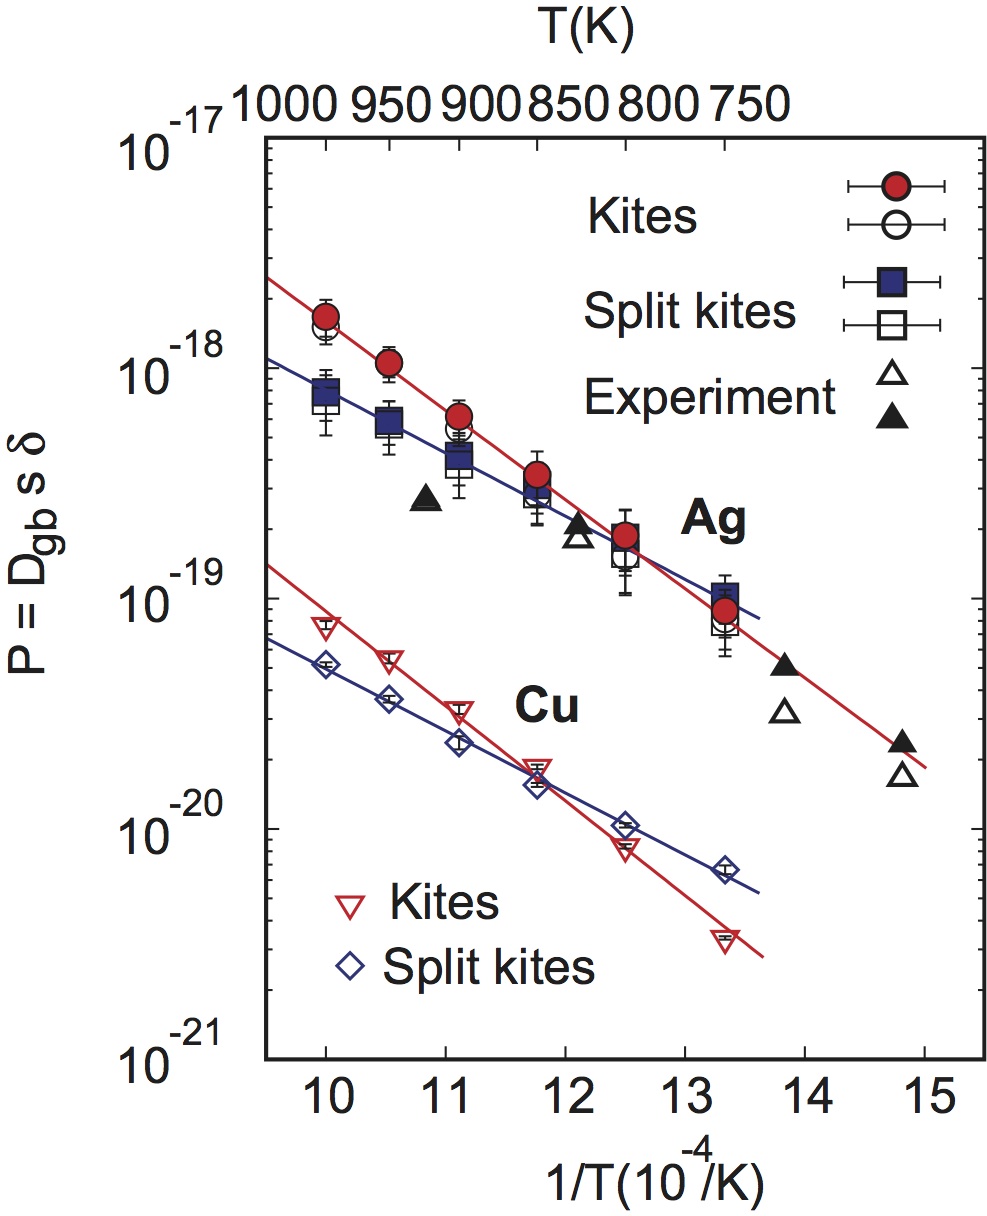
Putting together the diffusion and segregation data, Fig. 5 shows the Arrhenius diagram of the GB flux . The first notable feature of this plot is the overall close agreement between the experimental measurements [14] and independent simulation data. For both GB phases, the computed fluxes accurately follow the Arrhenius law with the activation energies 74 kJ/mole for the kite phase and 52 kJ/mole for the split-kite phase (averaged over both directions). For the kite phase stable at low temperatures, this activation energy compares reasonably well with the experimental values (67 to 75 kJ/mole [14]) extracted from the low-temperature portion of the experimental Arrhenius diagram.
The cross-over between the diffusivities of the two GB phases occurs at the temperature of 800 K, which is in excellent agreement with the experiment. This cross-over creates the characteristic break in the slope of the Arrhenius plot which is strikingly similar to the one reported in [14]. This close agreement strongly suggests that the non-Arrhenius diffusion behavior found in the experiment [14] was caused by the structural phase transformation in this boundary.
Conclusions. One general conclusion from this work is that atomistic simulations are presently capable of predicting GB diffusion and segregation in good agreement with experiment. It has also been demonstrated that our simulation methodology permits diffusion and segregation calculations for individual GB phases. This opens the door for future investigations of the effect of GB phase transformations on thermodynamic (segregation) and kinetic (diffusion) properties of high-angle GBs in metals by means of atomistic modeling. For the particular Cu GB studied here, the simulations predict that the structural transformation must cause a break in the activation energy of Ag impurity diffusion at about 800 K, with a lower activation energy above this temperature. This prediction is in excellent agreement with the recent experimental study [14]. This agreement confirms that the non-Arrhenius diffusion behavior reported in [14] indeed constitutes an experimental observation of a structural phase transformation in a high-angle GB.
Our simulations predict that the phase transformation must cause a similar break in the activation energy for Cu self-diffusion (Fig. 5). This suggests that the non-Arrhenius behavior found for Ag diffusion in Cu [14] was primarily caused by the effect of the phase transformation on the diffusion coefficient rather than on segregation. Nevertheless, segregation also plays an important role as it affects the activation energies of the measured diffusion fluxes in the two phases. Direct segregation measurements may provide additional information on the GB transformation. Our study shows that atomistic simulations are capable of reproducing complex segregation patterns, such as the bilayer, found experimentally in metallic alloys [6] and ceramics [3, 4]. This work motivates future measurements of Cu self-diffusion in the GB to test the predictions shown in Fig. 5. Cu self-diffusion measurements can employ the radioactive isotopes 64Cu or 67Cu and are extremely challenging [27, 28]. Nevertheless, such measurements could be conducted in the near future using bicrystalline samples as it was done in [14].
T.F. was supported by a post-doctoral fellowship from the Miller Institute for Basic Research in Science at University of California, Berkeley. Y.M. was supported by the U.S. Department of Energy, the Physical Behavior of Materials Program, through Grant No. DE-FG02-01ER45871. SVD was supported by the German Science Foundation through Grant No. DI 1419/3-2.
References
- [1] A. P. Sutton and R. W. Balluffi, Interfaces in Crystalline Materials, Clarendon Press, Oxford, 1995.
- [2] Y. Mishin, M. Asta, and J. Li, Acta Mater. 58, 1117 (2010).
- [3] M. Baram, D. Chatain, and W. D. Kaplan, Science 332, 206 (2011).
- [4] M. P. Harmer, Science 332, 182 (2011).
- [5] S. J. Dillon, M. Tang, W. C. Carter, and M. P. Harmer, Acta Mater. 55, 6208 (2007).
- [6] J. Luo, H. Cheng, K. M. Asl, C. J. Kiely, and M. P. Harmer, Science 333, 1730 (2011).
- [7] D. L. Olmsted et al., Phys. Rev. Lett. 106, 046101 (2011).
- [8] T. Frolov, D. L. Olmsted, M. Asta, and Y. Mishin, arXiv:1211.1756v2 (2013).
- [9] K. L. Merkle and D. J. Smith, Phys. Rev. Lett. 59, 2887 (1987).
- [10] G. Duscher, M. F. Chisholm, U. Alber, and M. Ruhle, Nature Mater. 3, 621 (2004).
- [11] I. Kaur, Y. Mishin, and W. Gust, Fundamentals of Grain and Interphase Boundary Diffusion, Wiley, Chichester, West Sussex, 1995.
- [12] G. Gottstein and L. S. Shvindlerman, Grain Boundary Migration in Metals, CRC Press, Bota Raton, 1999.
- [13] T. Watanabe, S. I. Kimura, and S. Karashima, Philos. Mag. A 49, 845 (1984).
- [14] S. V. Divinski, H. Edelhoff, and S. Prokofjev, Phys. Rev. B 85, 144104 (2012).
- [15] E. Budke, T. Surholt, S. Prokofjev, L. Shvindlerman, and C. Herzig, Acta Materialia 47, 385 (1999).
- [16] Y. Mishin and C. Herzig, Mater. Sci. Eng. A 260, 55 (1999).
- [17] A. Suzuki and Y. Mishin, J. Mater. Sci. 40, 3155 (2005).
- [18] T. Frolov and Y. Mishin, Phys. Rev. Lett. 106, 155702 (2011).
- [19] S. Plimpton, J. Comput. Phys. 117, 1 (1995).
- [20] Y. Mishin, M. J. Mehl, D. A. Papaconstantopoulos, A. F. Voter, and J. D. Kress, Phys. Rev. B 63, 224106 (2001).
- [21] A. Suzuki and Y. Mishin, Interface Science 11, 131 (2003).
- [22] D. Frenkel and B. Smit, Understanding molecular simulation: from algorithms to applications, Academic, San Diego, second edition, 2002.
- [23] P. L. Williams, Y. Mishin, and J. C. Hamilton, Modelling Simul. Mater. Sci. Eng. 14, 817 (2006).
- [24] T. Frolov and Y. Mishin, Phys. Rev. B 85, 224107 (2012).
- [25] S. V. Divinski, M. Lohmann, S. I. Prokofjev, and C. Herzig, Int. J. Mater. Res. 10, 1181 (2005).
- [26] D. Udler and D. N. Seidman, Phys. Rev. Letters 77, 3379 (1996).
- [27] T. Surholt, Y. Mishin, and Chr. Herzig, Phys. Rev. B 50, 3577 (1994).
- [28] T. Surholt and Chr. Herzig, Acta Mater. 45, 3817 (1997).


(a) 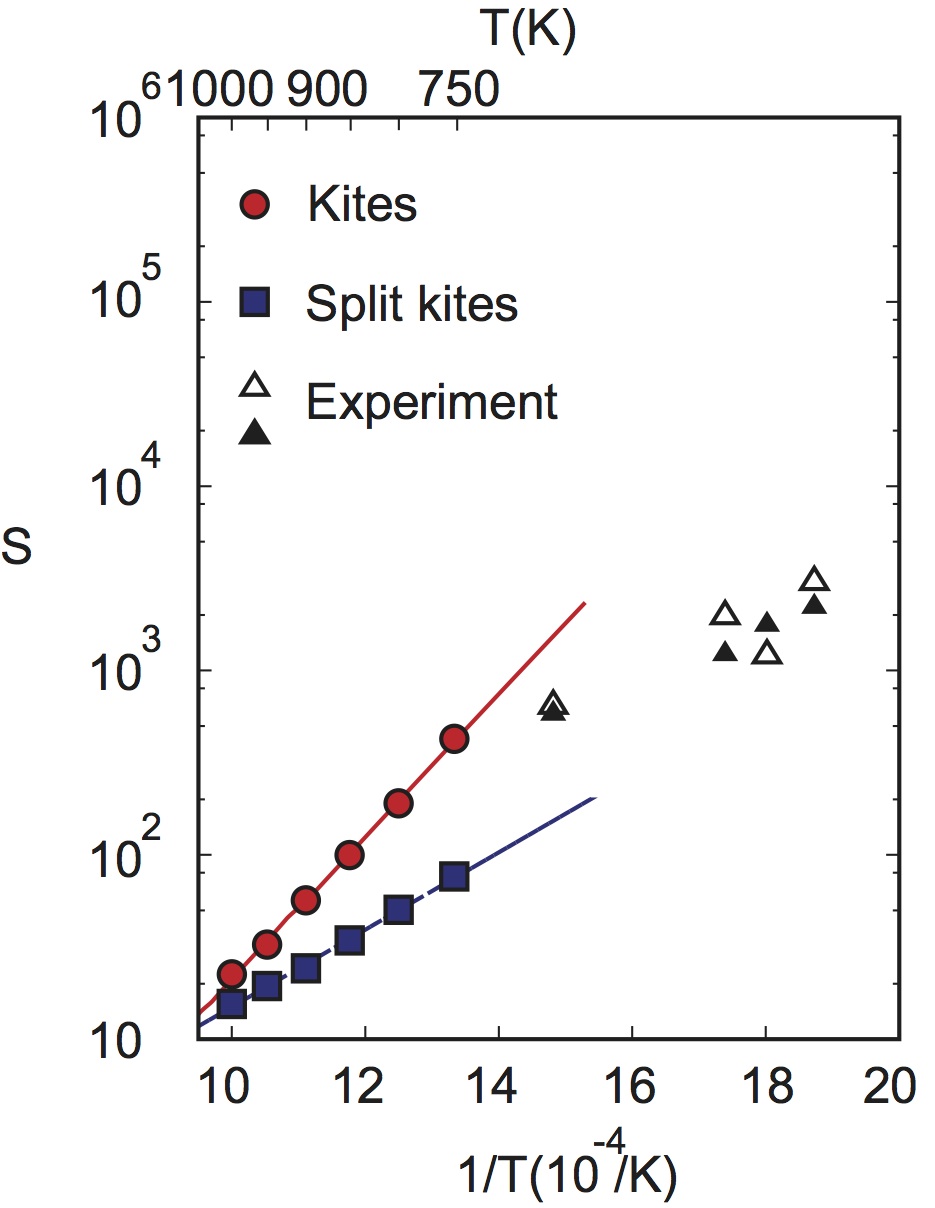
(b)