Second layer of H2 and D2 adsorbed on graphene
Abstract
We report diffusion Monte Carlo calculations on the phase diagrams of -H2 and -D2 adsorbed on top of a first layer of the same substances on graphene. We found that the ground state of the second layer is a triangular incommensurate solid for both isotopes. The densities for promotion to a second layer and for the onset of a two-dimensional solid on that second layer compare favorably to available experimental data in both cases.
pacs:
67.25.dp, 02.70.Ss, 05.30.Jp,68.65.PqI INTRODUCTION
Graphite and graphene are closely related forms of carbon in which the atoms are located in the nodes of a honeycomb lattice. The main difference is that graphite is formed by a whole stack of the two-dimensional carbon sheets that constitute a single graphene layer. science2004 ; pnas2005 Adsorption of gases on top of graphene and graphite are expected to show similar trends. This is in fact what has been shown by computer simulations of the phase diagrams of adsorbed quantum gases on graphene, both in the first, prl2009 ; prb2010 ; prb2011a ; prb2011b ; carmen ; jltp2013 and second prb2012a layers. In general, those calculations render phase diagrams which are very close to the experimental ones on graphite. colebook ; grey ; grey2 ; frei1 ; frei2 The only appreciable difference is the binding energy of the adsorbate species on top of the carbon structure, bigger in the graphite case. Unfortunately, to our knowledge, there are no experimental data yet on adsorption of quantum gases on graphene to be compared to.
Most of that work, both from the experimental and theoretical sides, has been devoted to the determination of the phase diagram of the first layer of quantum gases and solids adsorbed on top of graphite. colebook However, there has been some measurements of the properties of a second 4He sheet on top of an incommensurate helium layer, directly in contact with a graphite surface, grey ; grey2 ; chan ; cro ; cro2 work that can be compared to the simulations on the same subject. Whitlock ; boninx On the other hand, the second layer of molecular hydrogen on top of graphite has been less explored. Experimentally, the second layer of molecular hydrogen and deuterium adsorbed both on graphite and MgO has been studied using calorimetric measurements. vilches1 ; vilches2 ; vilches3 ; doble In particular, Ref. doble, studies the promotion to a second layer and the phase diagram of pure -H2 (-H2) and -D2 (-D2) second layers on graphite. One of the main conclusions of that work is that the ground state of both isotopes in the second layer is a quasi two-dimensional solid. Those calorimetric measurements suggest triple points at T 6 K for H2 and T 11 K for D2. For lower temperatures and densities those solids seem to coexist with infinitely diluted gases. The main goal of our present work is to perform diffusion Monte Carlo calculations to determine the phase diagram of the second layer of H2 adsorbed on a first layer of H2 on graphene, and of the second layer of D2 adsorbed on the first layer of D2, also on graphene. The results so obtained will be compared to the experimental ones for the same systems on graphite, doble the only ones available, in order to assess the possible differences. In particular, we try to ascertain if the oblique structure suggested for D2 in Refs. doble, , from neutron diffraction experiments, and in Ref. liu, , from low-energy electron-diffraction (LEED) measurements, is more stable than an arrangement consisting of two incommensurate triangular solids of different densities.
In the next Section, we describe the theoretical method used in the microscopic study of the adsorbed phases. The results obtained for both -H2 and -D2 on graphene are shown in Sec. III. Finally, the main conclusions are discussed in Sec. IV.
II METHOD
The diffusion Monte Carlo (DMC) method is a stochastic technique that allows us to obtain the ground state of a zero-temperature system of bosons. Since the species adsorbed (-H2 and -D2) on graphene are both bosons, we can obtain through DMC the arrangement of molecules with the lowest energy for each surface density. In order to reduce the statistical variance of the many-body problem, the algorithm uses a guiding wave function which enhances the occupation probability in places where the hydrogen density is expected to be large. boro94 In general, depends on the coordinates of all atoms or molecules in the simulation cell. However, in this work, we will consider that the carbon atoms of the graphene layer are kept in fixed positions, what means that their overall effect on the hydrogen molecules can be described as an external potential. Within this approximation, the guiding wave function depends only on the positions of the hydrogen molecules (r1,,rN). We chose,
| (1) | |||||
where () is the number of molecules adsorbed in the first (second) layer, and is a Jastrow wave function used to take into account the H2-H2 and D2-D2 correlations. prb2010 ; carmen In particular,
| (2) |
being the distance between the center of mass of hydrogen molecules (considered as spheres and interacting through the isotropic Silvera and Goldman potential silvera ). This potential was developed to describe the hydrogen-hydrogen interaction in bulk and it was successfully used to reproduce the phase diagram of the first layer of both H2 and D2 on graphene. prb2010 ; carmen The variational parameter in Eq. (2) was taken to be Å for both H2 and D2, in agreement with variational optimizations done in previous simulations of similar systems. prb2010 ; carmen
The purpose of the remaining terms in Eq. (1), and , is to describe the localization of hydrogen molecules in the first and second layers on top of graphene, respectively, and also the correlations due to the carbon-hydrogen interactions. Concretely,
| (3) | |||
with , 2 for the first and second hydrogen layer, respectively, and the number of molecules in each layer. represents the distance between the center or mass of each molecule, , and each of the carbon atoms, , in the graphene layer. Each hydrogen molecule interacts with each of those carbon atoms by a potential of Lennard-Jones type, whose parameters are taken from Ref. coleh2, . This part of the guiding wave function is again similar to the one used in previous works to describe the first layer of H2 (Ref. prb2010, ) and D2 (Ref. carmen, ) on graphene, to the point that we took the same and parameters as in those works. Thus, Å-2 for H2 and a Å-2 for D2. Åand Åfor both hydrogen isotopes. For hydrogen molecules on the second layer, was kept constant, and and were variationally optimized. The optimal values were Å-2 for both H2 and D2, and Å(H2) and Å(D2).
When the phase to be described is a quasi two-dimensional solid, is multiplied by a Nosanow term,
| (4) |
where () are the crystallographic positions of the solid lattice. The parameters were taken to be the same for = 1,2, i.e., a linear interpolation between the values corresponding to densities in the range 0.08 Å-2 ( Å-2) and 0.10 Å-2 ( Å-2) for H2, prb2010 and between 0.08 Å-2 ( Å-2) and 0.11 Å-2 ( Å-2) in the case of D2. carmen If the hydrogen density within the considered layer was not in those ranges, we used the linear extrapolated value.
To model the second layer of molecular hydrogen on top of a first layer of the same substance, we followed closely the prescription of Ref. prb2012a, , in which a second layer of 4He on graphene was simulated. Basically, for a fixed total hydrogen density, we considered only the arrangement for which the total energy per molecule was lower. In practice, this means that we have to take a fixed solid density for the first layer, and to change the number of molecules (if we have a liquid) or the lattice constant (if we have a solid) in the second layer. The structure of the second layer solid was assumed to be incommensurate with respect to the one on the first layer, i.e., the phase diagram was assumed to be of the same type as that of helium on graphene. However, to verify that this was so, we considered also the oblique commensurate structure proposed for D2 from neutron diffraction doble and LEED liu . We checked the stability of that structure for both isotopes. To be able to treat incommensurate second layers, we used different periodic boundary conditions for the first and second layers. No exchange of molecules between the first and second layer was allowed. Importantly, we did not fix the positions of the molecules closest to the graphene surface, i.e., we took into account the zero point motion of all the hydrogen molecules. For both isotopes, we considered hydrogen densities up to those of promotion to a third layer, obtained experimentally for the same systems on graphite. doble
III RESULTS
III.1 H2
The phase diagram of the second layer of H2 on graphene can be extracted from the data displayed in Fig. 1. The full squares correspond to the energy per molecule of a triangular incommensurate solid adsorbed on a single layer on top of graphene, and were taken from Ref. prb2010, . When we considered only a hydrogen layer, incommensurate means that there is no registry of the hydrogen molecules with respect to the carbon sheet. The third-order polynomial fit displayed on top of them is a guide-to-the eye. To study second layer structures, we put on top of one of these incommensurate structures a set of hydrogen molecules described by a guiding wave function with (4). The dimensions of the simulation cells were determined by the density of incommensurate solid in the first layer since, in all cases, the simulation cells comprised 120 H2 molecules close to the graphene surface. Then, we put enough hydrogen on top of them to produce surface areas (the inverse of density) in the range displayed in Fig. 1. To be sure that the energy per molecule considering both hydrogen sheets was the minimum one, we performed several sets of simulations with different incommensurate solid densities (in the first layer). In particular, we considered , , and Å-2. Our results indicate that on the second layer, the arrangement with lowest energy per H2 molecule is a liquid on top of a solid whose density is Å-2. Those results are displayed in Fig. 1 as full circles. The lowest limit of the surface area corresponds approximately to the experimental value for H2 promotion to a third layer ( Å2). doble
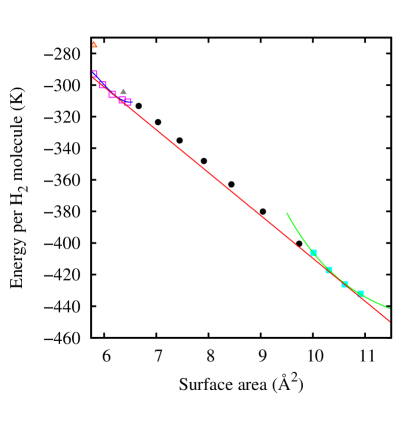
We modeled the second layer incommensurate triangular solid on the same principles, i.e., we considered the same densities as for the liquid case in the first hydrogen sheet, and distributed the atoms on the second layer as to produce the total densities displayed as surface areas in Fig. 1. Here, incommensurate means that the second layer is registered neither with respect to the first layer nor with the underlying graphene. The minimum energies per H2 molecule corresponded to an arrangement in which the lower layer density was Å-2; those data are displayed in Fig. 1 as open squares. The line on top of them represents also a third-order polynomial fit. We considered also two second layer commensurate (with respect to the first layer) solids: a lattice, grey2 and an oblique bilayer structure, carneiro both proposed originally to describe second layers of 4He on graphite. The latter was suggested to be stable for the second layer of H2 doble and D2 doble ; liu on graphite. The energy per H2 molecule of those registered phases is represented by a full and open triangle, respectively. We can see that both structures are metastable with respect to a set of two incommensurate layers, since their energies per molecule are larger. Their corresponding energies per H2 molecule are -274.9 0.1 K (oblique structure), and -304.6 0.1 K (), versus -293.0 0.1 K and -309.38 0.08 K of the corresponding incommensurate structures of the same densities (0.173 and 0.157 Å-2, respectively). A commensurate solid, also proposed to be stable for helium, boninx and not displayed for simplicity, was also considered and found to be unstable with respect to a second layer incommensurate solid.
With all of that in mind, we can draw a double-tangent Maxwell construction to obtain the phase diagram of the second layer of H2 on graphene. The slope of that line is minus the internal pressure at which the transition takes place, and has to be positive for stable arrangements. In addition, if several transitions are possible, one has to consider only the corresponding to the lowest pressure. The straight line displayed in Fig. 1, that joints a single layer incommensurate solid and its second layer counterpart fulfills all the necessary requirements. We can see that the energy per H2 molecule of a second layer liquid (full circles) is always above the double-tangent line. This means that a second layer liquid is unstable with respect to a mixture of a single layer solid and another with two incommensurate sheets. The surface areas at which the slopes of both three-order polynomial fits are the same define the stability limits for the phases involved in the transition. In our case, those correspond to an upper density limit for a single layer solid (equivalent to a second layer promotion) of Å-2, and a lowest density value of Å-2 for a two layered solid. Both results are in excellent agreement with the calorimetric values of H2 on graphite: doble and Å-2. The chemical potential for H2 at the monolayer-bilayer transition derived from our simulations was -161 2 K. This means that a second layer of H2 is still stable with respect to the formation of a bulk H2 crystal, whose ground state chemical potential is -92.3 K ost . This also means that the second layer solidifies at H2 densities as low as Å-2. As in 4He, grey ; grey2 ; prb2012a the first layer suffers a compression that produces a % increase of its density upon the adsorption of the second hydrogen sheet.
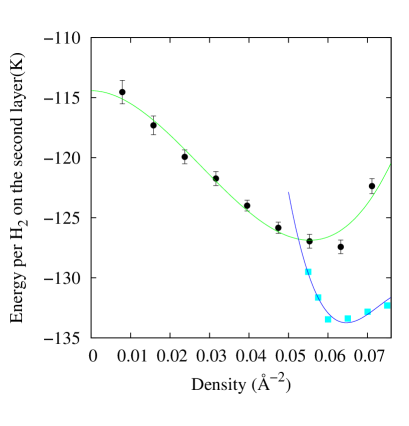
We also compared our simulation results for H2 on a second layer to similar data obtained for a pure two dimensional (2D) system. In Fig. 2, we show the energy per H2 molecule as a function of density, but only for the molecules on that second sheet. This energies are taken from the same set of simulation results as the ones displayed in Fig. 1, i.e., the molecules of the first layer are not kept frozen. A glance to the previous figure indicates that the binding energies of these molecules are smaller than the ones located in the first layer by at least a factor of two. This is true for both liquid (full circles) and triangular incommensurate (full squares) phases. The lines on top of each set of symbols are least-squares fits to the expression
| (5) |
where is the hydrogen density in that second layer and stands for the density at which the energy per H2 molecule has a minimum (). The parameters obtained for the liquid and solid phases, together with their first layer (taken from Ref. prb2010, ) and pure two-dimensional (from Ref. claudio, ) counterparts, are shown in Table 1. Those results indicate that a pure two-dimensional system of H2 molecules is a worse description for the second than for the first layer of H2 on graphene, and that the 2D equation of state is worse for a liquid phase than for a solid one. For instance, the energy differences, once subtracted the infinite-dilution energy (), between a 2D system and a first layer of H2 on graphene are % for a liquid, and % for a solid. In comparison, those same differences between a 2D and a second layer system are and 22 %, respectively. The same, but to a lesser extend, can be said of the differences between the values of : % for the 2D and first layer solids difference, gap that increases up to % if instead of a first layer we have a second one. Those same percentages grow to % and 15 % for the same comparisons for liquid phases. Moreover, Table 1 gives us another interesting piece of information: the upper solid is more stable with respect to a liquid arrangement than in a flat structure or a first layer sheet. This is because the the energy difference at the respective equilibrium densities is highest in the second layer case. The corresponding values are 6.8 K (second layer), versus 2.023 K (2D), and 1.8 K (first layer). We can also see that the density minimum for the second-layer solid phase ( Å-2) is comparable to the equilibrium density mentioned above ( Å-2), obtained from the Maxwell construction including the whole system.
| Liquid | Solid | |
|---|---|---|
| 2D | ||
| (K) | 0 | |
| (K) | -21.43 0.02 | -23.453 0.003 |
| (K) | -21.43 0.02 | -23.453 0.003 |
| (Å-2) | 0.0633 0.0003 | 0.0673 0.0002 |
| gr | ||
| (K) | -431.79 0.06 | |
| (K) | -451.88 0.03 | -454.1 0.3 |
| (K) | -20.09 0.07 | -22.3 0.3 |
| (Å-2) | 0.05948 0.00005 | 0.0689 0.0006 |
| second layer | ||
| (K) | -114.4 0.6 | |
| (K) | -126.9 0.5 | -133.7 0.3 |
| (K) | -12.5 0.8 | -19.3 0.7 |
| (Å-2) | 0.055 0.001 | 0.0646 0.0009 |
III.2 D2
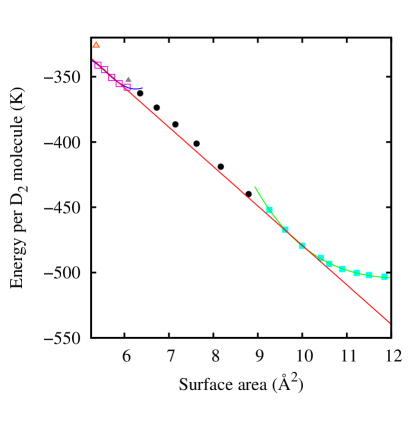
This subsection will closely mirror the previous one since we studied the second layer of D2 on graphene following the same steps. Our results are summarized in Fig. 3, where all the symbols and lines have a similar meaning to those of Fig. 1. The only difference is that the structures with the minimum energy per deuterium molecule are those whose first layer density is Å-2 for both the second layer solid and liquid phases. To be sure of that, densities in the range to Å-2 were tested. The first layer results (full squares) are now taken from Ref. carmen, , and the triangles represent the same registered phases suggested above for H2. As one can see, these commensurate phases are still unstable with respect to a set of two incommensurate solid deuterium layers. As in H2, we have also that the energies per D2 molecule for a second layer liquid are above the double-tangent Maxwell construction. This means that the phases in equilibrium are again a first layer incommensurate triangular solid of density Å-2 and a second layer incommensurate solid whose total density is Å-2. Both results are again in excellent agreement with the calorimetric data of Ref. doble, on graphite: Å-2 for second layer promotion, and Å-2 for the minimum density at which the double solid is stable. Since in this last case, the density of the lower layer is Å-2, we can state that there is also a compression of the first layer of around a 5 % upon the adsorption of a second layer of D2 on top of D2. As in the case of H2, our simulation results allow us to calculate the chemical potential of D2 at the monolayer-bilayer transition. The result was -180 2 K, a healthy 30% larger than the corresponding to bulk D2. We found also that both the oblique commensurate structure and the one were unstable with respect to the double incommensurate arrangement, as can be seen in Fig. (3). The values of their energies per D2 molecule were -326.1 0.1 K and -352.7 0.1 K, versus -341.1 0.1 K and -358.0 0.1 K for the double incommensurate for the same densities (0.186 and 0.164 Å-2, respectively).
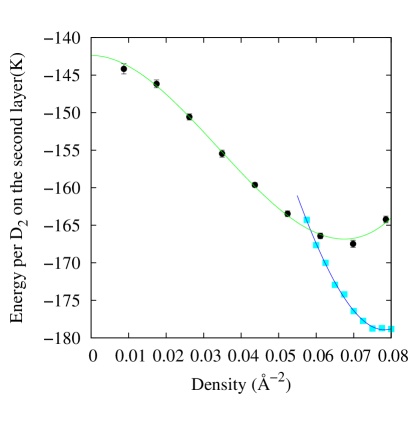
We can also study the second layer by itself and compare the results to those of a first layer of D2 adsorbed on graphene, and to a pure 2D system. That can be done with the help of Fig. 4 and Table 2. The conclusions we can draw from this set of information are similar to those already described in the H2 case: the equilibrium densities are essentially compatible with each other, even more so in the solid case, and the energy per D2 molecule differences between liquid and a solid phases are larger in the case of a second layer solid than for a single deuterium sheet. The equilibrium density of the second layer solid is also comparable to the one extracted from the Maxwell construction for the entire system ( versus Å-2).
| Liquid | Solid | |
| 2D | ||
| (K) | 0 | |
| (K) | — | -42.305 0.005 |
| (K) | — | -42.305 0.005 |
| (Å-2) | — | 0.0785 0.0002 |
| gr | ||
| (K) | -464.87 0.06 | |
| (K) | -497.2 0.9 | -504.2 0.08 |
| (K) | -32.3 0.9 | -39.3 0.1 |
| (Å-2) | 0.064 0.001 | 0.0799 0.0002 |
| second layer | ||
| (K) | -142.4 0.5 | |
| (K) | -166.8 0.5 | -178.9 0.6 |
| (K) | -24.4 0.7 | -36.5 0.8 |
| (Å-2) | 0.068 0.002 | 0.078 0.003 |
IV CONCLUSIONS
In this work, we have studied the complete phase diagram of the second layer of both H2 and D2 adsorbed on top of a single graphene layer. Since we used a set diffusion Monte Carlo calculations, the results correspond to the zero-temperature ground state of the system. To obtain the real stability limits, we had to perform Maxwell constructions between phases that comprised one and two hydrogen layers, but we found that if we used only the data corresponding to a second one, the description is good enough to reproduce the solid equilibrium of the complete two-sheet system. Our results for the promotion density to the second layer and the minimum density in this second layer agree satisfactorily with available calorimetric results for graphite, pointing to the accuracy of both the method used and the interaction potentials entering in the Hamiltonian. That our results on graphene are comparable to the experimental ones on graphite also means that both surfaces are basically equivalent as absorbents, being the only possible difference the binding energy of the hydrogen molecules to the carbon surface.
However, calorimetric measurements only give the total density for the onset of a solid structure at T 0. From Ref. doble, , those densities appear to be 0.165 (H2) and 0.178 (D2) Å-2. Both are lower than the ones assigned in the same work to the oblique structures: 0.173 (H2) and 0.186 (D2) Å-2, respectively. The fact that the former densities are compatible with our simulation results supports our suggestion of a double incommensurate solid as the structure for the inferred solid phase. Moreover, a comparison of the energies per molecule for the oblique solid and the two sets of triangular layers at the same densities indicates that, at least for , the commensurate arrangement is not stable. One could speculate that the disagreement between calorimetric data, in one side, and LEED and neutron diffraction, on the other, could be originated by the tiny difference between the diffraction patterns of a double incommensurate structure and a double oblique layer. doble ; liu In fact, the oblique phase was proposed in the past as the ground state of a second layer of 4He on graphite in neutron diffraction studies, carneiro but further calorimetric measurements concluded that triangular structures were preferred. This could be also the case for hydrogen. On the other hand, our results rely on empirical potentials that have been used to reproduce reasonably well the equation of state of the first layer of both H2 and D2 on graphene, prb2010 ; carmen but we can not exclude that, in the future, more elaborate interactions could change our predictions for the second layers.
On a different note, from the behavior of this second layer, we can say that when the number of adsorbed layers grows, the entire arrangement becomes more “solid-like” than “liquid-like”. The reason is that, even though the binding energy in the second layer is lower than in the first one, the incommensurate solid structure is much more stabilized with respect to a liquid than in the first layer case. This is probably the reason why the experimental critical points for the liquid-vapor coexistence regions of H2 and D2 adsorbed on graphite approach those of the bulk solids as the number of adsorbed layers grows, doble making impossible to obtain a stable liquid by reducing the dimensionality of the system.
Acknowledgements.
We acknowledge partial financial support from the Junta de Andalucía group PAI-205 and Grant FQM-5985, DGI (Spain) Grants FIS2010-18356 and FIS2011-25275, and Generalitat de Catalunya Grant 2009SGR-1003.References
- (1) K. S. Novoselov, A. K. Geim, S. V. Morozov, D. Jiang, Y. Zhang, S. V. Dubonos, I. V. Grigorieva, and A.A. Firsov, Science 306, 666 (2004).
- (2) K. S. Novoselov, D. Jiang, F. Schedin, T. J. Booth, V. V. Khotkevich, S. V. Morozov, and A. K. Geim, PNAS, 102, 10451 (2005).
- (3) M. C. Gordillo and J. Boronat, Phys. Rev. Lett. 102, 085303 (2009).
- (4) M. C. Gordillo and J. Boronat, Phys. Rev. B 81, 155435 (2010).
- (5) M. C. Gordillo, C. Cazorla, and J. Boronat, Phys. Rev. B 83, 121406(R) (2011).
- (6) M. C. Gordillo and J. Boronat, Phys. Rev. B 84, 033406 (2011).
- (7) C. Carbonell-Coronado and M.C. Gordillo, Phys. Rev. B 85, 155427 (2012).
- (8) M.C. Gordillo and J. Boronat, J. Low Temp. Phys., in press.
- (9) M.C. Gordillo and J. Boronat, Phys. Rev. B 85, 195457 (2012).
- (10) L. W. Bruch, M. W. Cole, and E. Zaremba, Physical adsorption: forces and phenomena (Oxford University Press, Oxford, 1997).
- (11) D. S. Greywall and P. A. Busch, Phys. Rev. Lett. 67, 3535 (1991).
- (12) D. S. Greywall, Phys. Rev. B 47, 309 (1993).
- (13) H. Freimuth and H. Wiechert, Surf. Sci. 162, 432 (1985).
- (14) H. Freimuth and H. Wiechert, Surf. Sci. 189/190, 548 (1987).
- (15) G. Zimmerli, G. Mistura, and M. H. W. Chan, Phys. Rev. Lett. 68, 60 (1992).
- (16) P. A. Crowell and J. D. Reppy, Phys. Rev. Lett. 70, 3291 (1993).
- (17) P. A. Crowell and J. D. Reppy, Phys. Rev. B 53, 2701 (1996).
- (18) P. A. Whitlock, G. V. Chester, and B. Krishnamachari, Phys. Rev. B. 58, 8704 (1998).
- (19) P. Corboz, M. Boninsegni, L. Pollet, and M. Troyer, Phys. Rev. B 78, 245414 (2008)
- (20) J. Ma, D.L. Kingsbury, F.C. Liu and O.E. Vilches. Phys. Rev. Lett. 61, 2348 (1988).
- (21) O.E. Vilches, J. Low Temp. Phys. 89, 267 (1992).
- (22) F.C. Liu, Y.M. Liu and O.E. Vilches, Phys. Rev. B 51, 2848 (1995).
- (23) H. Wiechert, in Excitations in Two-Dimensional and Three-Dimensional Quantum Fluids edited by A.G.F. Wyatt and H.J. Lauter (Plenum Press, New York, 1991). p. 499.
- (24) W. Lui and S.C. Fain, Jr. Phys. Rev. B. 47 15965 (1993).
- (25) J. Boronat and J. Casulleras, Phys. Rev. B 49, 8920 (1994).
- (26) I. F. Silvera and V. V. Goldman, J. Chem. Phys. 69, 4209 (1978).
- (27) G. Stan and M.W. Cole, J. Low Temp. Phys. 110, 539 (1998).
- (28) K. Carneiro, L. Passell, W. Thomlinson, and H. Taub, Phys. Rev. B 24 1170 (1981).
- (29) C. Cazorla and J. Boronat, Phys. Rev. B 78, 134509 (2008).
- (30) E. Ostgaard. J. Low. Temp. Phys. 8 479 (1972).