The average absorption properties of broad absorption line quasars at Å, and the underlying physical parameters
Abstract
Broad absorption line quasars (BALQs) present a large diversity in their broad absorption line (BAL) profiles. To investigate what physical parameters underlie this diversity, we construct a sample of BALQs which covers Å, based on the Sloan Digital Sky Survey DR7 quasar catalogue. The average BAL properties are evaluated by taking the ratios of average BALQ spectra to the average spectra of matched samples of non-BALQs, where the matching is based on various emission properties. We find the following properties. (i) There is no detectable Lyman edge associated with the BAL absorbing gas (). (ii) The known increase of average absorption depth with the ionization potential extends to the higher ionization N v and O vi BALs. We also find that the C iv BAL profile is controlled by two parameters. (i) The He ii emission EW, which controls the typical velocity of the C iv BAL, but does not affect the absorption depth. (ii) The spectral slope in the 1700–3000 Å range (), which controls the C iv peak absorption depth, but does not affect the typical velocity. The He ii EW and also control the observed fraction of quasars that are BALQs. We suggest that a lower He ii EW may indicate a weaker ionizing continuum, which allows the outflow to reach higher velocities before being overionized, possibly without a need to invoke a shielding gas. A redder continuum may indicate a more inclined system, and a larger covering factor and larger column of the outflow along the line of sight.
keywords:
galaxies: active – quasars: absorption lines – quasars: general.1 Introduction
Broad absorption line quasars (BALQs) are a subtype of active galactic nuclei (AGN), defined by the presence of broad and blue-shifted absorption features (e.g., Weymann, Carswell & Smith 1981). The intrinsic fraction of BALQs from the total quasar population is estimated to be per cent (Hewett & Foltz 2003; Reichard et al. 2003; Knigge et al. 2008; Gibson et al. 2009. Allen et al. 2011 claim it can be as high as per cent). While there are several differences in emission properties between BALQs and non-BALQs, BALQs appear to be drawn from the non-BALQ population (Weymann et al., 1991; Hamann, Korista & Morris, 1993; Reichard et al., 2003). Broad absorption lines (BALs), and the C iv BAL in particular, span a large range in depth, width and overall velocity shift () between different objects. For most BALQs, absorption is observed only in high-ionization lines (these objects are termed ‘HiBALQs’). For a smaller fraction of BALQs, absorption is also observed in low-ionization lines, e.g. Mg ii (‘LoBALQs’). The predominant unifying model states that the difference between the AGN subtypes is our viewing angle towards the quasar central regions (e.g., Elvis 2000). However, an alternative scenario suggests that LoBALQs are an evolutionary stage of AGN, in which the nucleus expels a surrounding dusty ‘cocoon’ (Voit, Weymann & Korista 1993; Urrutia et al. 2009; Farrah et al. 2010, 2012; Glikman et al. 2012; cf. Lazarova et al. 2012).
What are the average BALQ spectral properties shortward of Ly , and near the Lyman limit? Most of BALQ studies analyse spectra only down to of Si iv (e.g., Gibson et al. 2009; Allen et al. 2011) or N v (e.g., Weymann et al. 1991). In this study, we utilize the Sloan Digital Sky Survey (SDSS; York et al. 2000) DR7 quasar catalogue (Schneider et al., 2010; Shen et al., 2011), and investigate high- object spectra, which cover from C iv down to Å. The spectra of quasars are heavily absorbed by the intervening Lyman forest at Å. We overcome this foreground absorption and derive the BALQ intrinsic absorption by taking the ratio of the average spectrum of BALQs and the average spectrum of a matched control sample of non-BALQs. The ratio spectrum allows us to place a limit on the average Lyman edge depth associated with the BAL systems, and thus a limit on the covering factor (CF) of low ionization BAL system. We also extend earlier studies on the average absorption strength of C ii, Si iv and C iv to the higher ionization N v and O vi BALs.
The ratio spectrum is meaningful only if the average emission properties of BALQs and non-BALQs are indeed the same. Various studies find systematic differences between the intrinsic emission properties of BALQs and non-BALQs. There are reports that BALQs are located on the high- and high- end of the Boroson & Green (1992) eigenvector 1 (Boroson, 2002). BALQs are observed to have larger blueshifts of C iv emission than non-BALQs (Richards et al., 2002; Reichard et al., 2003), and LoBALQs to have the highest blueshifts (Richards et al., 2002). BALQs are found to be redder than non-BALQs (Reichard et al., 2003; Maddox et al., 2008; Gibson et al., 2009; Allen et al., 2011), and LoBALQs to be redder than HiBALQs (Weymann et al., 1991; Sprayberry & Foltz, 1992; Boroson & Meyers, 1992; Reichard et al., 2003; Gibson et al., 2009). The reddening is interpreted by some authors as a result of BALQs being viewed preferentially closer to edge on (e.g., Ogle et al. 1999), or as an imprint of a dusty ‘cocoon’ (see references above). Trump et al. (2006) find the emission lines to be broader for BALQs than for non-BALQs. BALQs are reported to have lower C iv equivalent width (EW) than non-BALQs, X-ray weaker BALQs are observed to have stronger BALs with larger terminal velocities, and the measured velocities are larger for higher- BALQs (Brandt, Laor & Wills, 2000; Laor & Brandt, 2002; Gibson et al., 2009). LoBALQs show the strongest and broadest high-ionization absorption lines (Allen et al., 2011).
Thus, to make a more accurate ratio spectrum one needs to use samples of BALQs and non-BALQs with a similar distribution of intrinsic emission properties. One can then take another step, and explore whether the derived absorption properties, in particular the average C iv absorption profile, depend on the intrinsic emission properties, such as . For this purpose, we expand our study to quasars, where one can observe the 1400–3000Å range, and derive emission parameters, such as , based on the Mg ii 2798 broad emission line. Despite numerous studies, the intrinsic properties which underlie the diversity of BALs remain elusive. This study allows us to address what causes the large diversity of the observed BAL properties
We explore in this study the dependence of the C iv BAL properties on the He ii EW and on the UV slope (). This exploration is motivated by the following. The He ii EW is a measure of the strength of the extreme UV (EUV) continuum above 54 eV, compared to the near UV continuum, and there are reports that BALQs have on average lower He ii EW than non-BALQs (Richards et al., 2002; Reichard et al., 2003). A Broad Line Region (BLR) wind component is reported to be affected by the ionizing continuum hardness (Leighly & Moore 2004, based on He ii EW; Kruczek et al. 2011, based on ), and the BLR wind component is suggested by Richards (2012) to be possibly relevant to the BALQ phenomenon. In addition, is correlated with reddening (e.g., Baskin & Laor 2005; Stern & Laor 2012), and since reddening is more common in BALQs (see above), this implies a possible relationship between and BALQ properties.
The paper is structured as follows. The data analysis method is described in Section 2. In Section 3 we analyse composite spectra of the BALQ and non-BALQ samples, find a trend between the ionization potential and the average BAL depth, and constrain the average H0 absorber properties. In Section 4 we investigate what parameters span the C iv BAL properties. A physical interpretation to our findings is proposed in Section 5. In Section 6 we examine which dust extinction laws can explain the BALQ reddening relative to non-BALQs. Our conclusions are summarized in Section 7.
2 The Data Analysis
The data set is drawn from the SDSS DR7. The object BALQ classification is adopted from the Shen et al. (2011) quasar catalogue.111The updated Shen et al. (2011) quasar catalogue, available at http://das.sdss.org/va/qso_properties_dr7/dr7.htm, includes the improved from Hewett & Wild (2010). Shen et al. (2011) use the Gibson et al. (2009) BALQ classification for objects that are included in the SDSS DR5, and classify the remaining objects based on a visual inspection of the C iv region. Note that Gibson et al. (2009) use a modified version of ‘balnicity index’ (BI) of Weymann et al. (1991) to detect BALQs, which they term BI0. They integrate the continuum-normalized spectral flux starting from a blueshift of 0, rather than km s-1 used in the traditional BI. We include in the data set only objects with in the SDSS i-filter, to avoid unusually low-S/N spectra (the S/N criterion excludes per cent of the objects; see below). We divide the data set into two subsets that cover different ranges as described below.
-
1.
The Å range i.e., for the SDSS (hereafter, the ‘high-’ sample). The lower limit on is set to allow a detection of Lyman limit absorption intrinsic to the BALQs, and the upper limit is set to detect the continuum redward of the C iv emission complex. The DR7 covers this range for 228 BALQs and 1320 non-BALQs. The criterion leads to 200 BALQs and 1142 non-BALQs.
-
2.
The Å range i.e., for the SDSS (hereafter, the ‘low-’ sample). The lower and upper limits are placed to cover the C iv BAL and the Mg ii emission line, respectively. The DR7 contains 1691 BALQs and 13,388 non-BALQs in this range. The S/N criterion excludes 39 BALQs and 739 non-BALQs. Since LoBALQs are a distinct subtype of BALQs, with redder spectra than the more common HiBALQs (Weymann et al., 1991; Sprayberry & Foltz, 1992; Boroson & Meyers, 1992; Reichard et al., 2003; Gibson et al., 2009), we exclude from the low- BALQ sample 56 objects with a detected Mg ii BAL (Shen et al., 2011), and construct a sample of low- HiBALQs only. We do not construct a similar high- HiBALQ sample, as it is not clear which low-ionization absorption line at Å matches the Mg ii absorption line. Note that Shen et al. (2011) do not conduct a systematic search for Mg ii BALQs in the post-DR5 quasar sample, and report only serendipitously found Mg ii BALQs for this sample. Thus, the exclusion of LoBALQs from the low- BALQ sample might be incomplete. Trump et al. (2006) report a Mg ii BALQ fraction of 1.3 per cent of quasars for DR3 (i.e. 164 objects in our sample), where BALs are detected using the ‘absorption index’ criterion, while Allen et al. (2011), who use the criterion, find a smaller fraction of 0.3 per cent for DR6 (38 objects). The different fractions result from the different definitions of AI and BI.222 () requires at least one continuous absorption trough with a minimal absorption depth of 0.1 and a minimal width of 1000 km s-1 (2000 km s-1) in the km s-1 ( km s-1) range. Thus, our low- HiBALQ sample is likely contaminated by LoBALQs which pass the criterion, but none of these pass the criterion. The final low- sample is comprised of 1596 HiBALQs and 12,649 non-BALQs.
Since the spectra of high- objects have a relatively low S/N (a median value of per resolution element at continuum regions unaffected by absorption and strong emission)333The S/N of an object is estimated by calculating the ratio between the mean and standard deviation of in the Å window., the spectra are smoothed by a 22 pixel-wide moving average filter, which allows to achieve a median S/N of per resolution element [the filter width is equivalent to resolution elements i.e., km s-1 (York et al., 2000)]. The spectra of low- objects are smoothed by the same filter, yielding a median S/N of per resolution element. Since we are dealing with BALs (i.e., line width km s-1), the absorption profiles explored in this study remain well resolved. All spectra are normalized by the mean flux density in the Å range.444It should be noted that the wavelength used for the normalization is not significant, as verified by repeating the main analysis using the Å range instead.
Median spectra are calculated by utilizing a modified median method. A simple mean is not adopted as the representative average spectrum, since it can be affected by outliers. Outliers have a negligible effect on the median, but the median yields a relatively ‘noisier’ composite compared to the mean. We utilize a modified median method, which is a hybrid between the standard median and the mean, and which mitigates the shortcomings of the two methods. First, the object spectra are sorted based on the normalized . Then, 10 per cent of the objects above and 10 per cent of the objects below the median are marked. Finally, the mean of the marked objects is adopted as the composite at a given (a similar method is used to calculate the Libor interest rate in Economy).
The intrinsic BALQ absorption is evaluated by utilizing the non-BALQ sample. The non-BALQ composite is assumed to represent the intrinsically unabsorbed emission of the BALQs (the construction of composites matched in emission properties is described below). The ratio between the BALQ and non-BALQ composites (hereafter the spectrum) is interpreted as the intrinsic BALQ absorption spectrum. Since the ratio does not remove an overall spectral energy distribution (SED) differences between BALQs and non-BALQs, we fit a straight-line continuum across the profile from to km s-1. A residual Si iv emission, if present, has little effect on the C iv measurements. The caveat of our approach is that if there are significant intrinsic differences in line emission within the absorbed region for BALQs, then the derived absorption profile will be biased.
The individual absorption profiles are often characterized by a relatively narrow absorption peak. This characteristic profile is smeared out when forming the composite, due to the distribution of peak absorption velocities. In order to investigate the median ‘BAL rest-frame’ absorption profile near the absorption peak, we also form a composite based on the aligned C iv peak-absorption. This composite, calculated for the high- BALQs, allows to detect relatively narrow ( km s-1) and weak absorption lines which are otherwise heavily blended in the crowded FUV region, and also provides some hint on the optical depth of resolved multiplet absorption. The BALQ spectra are aligned by shifting each spectrum in velocity, so that the maximum absorption of C iv falls at the same velocity for all spectra. Then, a composite of the aligned spectra is calculated. The 22-pixel spectral smoothing by a relatively broad filter, smooths out any narrow features ( km s-1) superimposed on the C iv BAL, and reduces their effect on the alignment procedure. When the matched non-BALQ sample is constructed, a similar distribution of velocity shifts is used.
We study the dependence of the BALQ absorption properties on the following parameters.
-
1.
The He ii EW, which may serve as a measure of the EUV ionizing SED hardness. The He ii EW is measured by integrating the normalized in the Å range, assuming i.e., a constant between the normalization window (1700–1720 Å) and Å. The adopted range minimizes contributions from C iv and O iii] 1661, 1666 to the evaluated He ii EW. Using a constant corresponds to a spectral slope of (), which serves as a rough approximation for the local slope (Section 4.2). A significantly more accurate derivation of the local is hindered by the C iv BAL for BALQs. The derived He ii EW is slightly overestimated in objects where the continuum slope is bluer, but these objects tend to have a higher He ii EW, where the exact continuum placement is less significant. The constant is a good approximation in the low He ii EW objects. In the reddest objects, the continuum at Å drops below the adopted constant , leading to slightly negative He ii EW (see Section 4.3). The small errors in the absolute values of the He ii EW are significantly smaller than the trends with the He ii EW explored below.
-
2.
The UV spectral slope , which may serve as a measure of dust absorption. For the high- sample, the slope is evaluated between the 1275–1285 and 1700–1720 Å windows, and is denoted as . The latter window is redward of O iii] 1665 emission and the C iv emission ‘shelf’, and blueward of N iii] 1750. The former window is between the red wing of Ly +N v emission complex and O i 1303. The window between O i 1303 and C ii 1335 is not utilized, because it is affected by C ii and Si iv absorption in BALQs. For the low- sample, the slope is evaluated between the 1700–1720 and 2990–3010 Å windows, and is denoted as . The latter window is redward of Mg ii 2798.
We also explore the dependence of the BALQ absorption, for the low- sample, on the following additional parameters.
-
1.
, taken from Shen et al. (2011).
-
2.
Mg ii FWHM, taken from Shen et al. (2011).
- 3.
-
4.
, evaluated as , where we adopt a bolometric correction factor of 5.15 (Shen et al., 2008).
We do not use the C iv emission line to estimate given the significant uncertainties associated with this line (e.g. Baskin & Laor 2005, and citations thereafter). The objects are binned for each parameter, so that each BALQ bin contains the same number of objects. The corresponding non-BALQ bins span the same parameter range, but the distribution of objects within each bin may be different. A median composite spectrum is calculated for each bin.
3 The average BALQ properties
Figure 1 presents a comparison between the high- BALQ and non-BALQ composites, aligned by their tabulated . We present both the median and the mean composites, to demonstrate the level of systematics produced by the averaging procedure, which is larger than the purely statistical noise. The two composites are similar overall, except at wavelength regions of strong absorption and emission features (e.g., Ly ), where the mean composite is more affected by outliers. Bottom panel presents the composite. The median and mean composites are similar. There are small differences in absorption amplitude, which are likely selection effects.555The reversal of the mean versus median spectra at the C iv and O vi absorption troughs is not a significant result. It reflects the fact that the residual flux at the O vi trough is closer to zero than for C iv. We indicate the laboratory wavelength location of absorption lines of various ionized species. There are many absorption lines in the Å range, and the indicated absorption line locations are for illustration only. The steep decline of flux blueward of the Lyman edge for both BALQ and non-BALQ composites (top panel) is caused by intervening Lyman systems. Observations of low- AGN, which are unaffected by intervening Lyman systems, do not show this steep decline (Zheng et al., 1997; Telfer et al., 2002; Scott et al., 2004; Shull et al., 2012).
The three main features which can be seen in the composites are: (i) there is no detectable Lyman limit absorption; (ii) the high ionization lines observed shortward of Ly , in particular N v and O vi, show stronger absorption than observed longward of Ly ; (iii) the overall continuum ratio is red. These results are further discussed below.
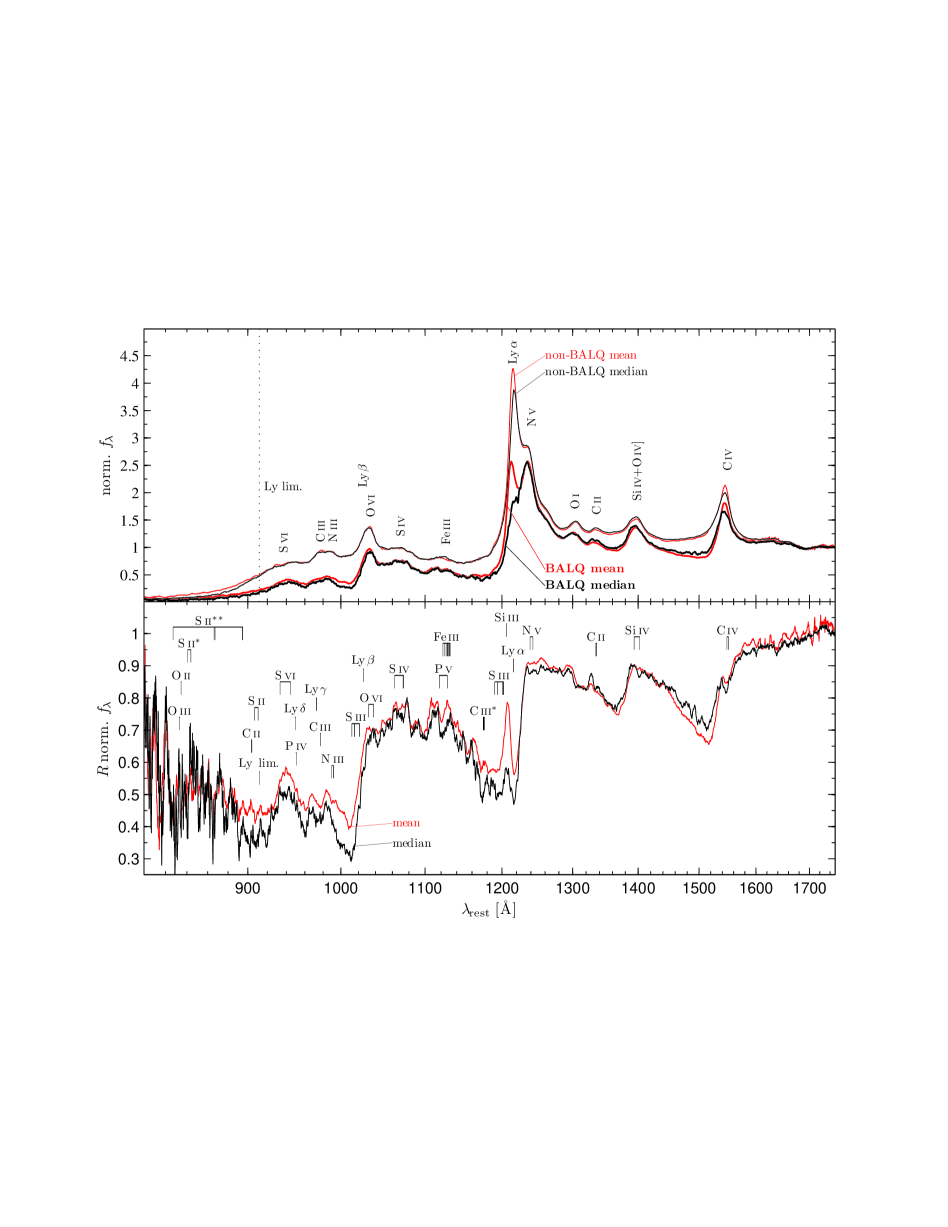
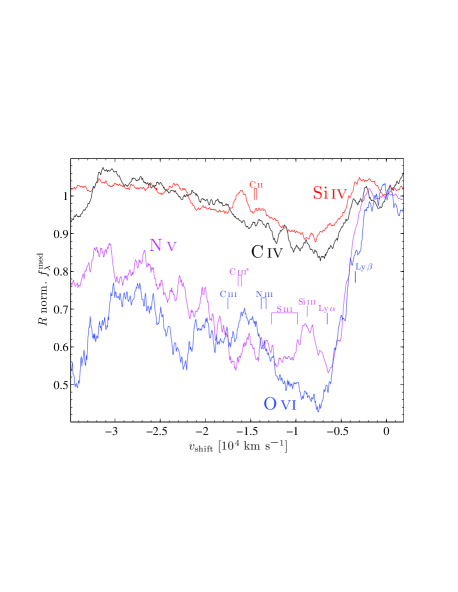
Figure 2 compares the absorption profiles of Si iv, C iv, N v and O vi. The higher the ionization potential, the stronger is the BAL trough. The Si iv absorption line, produced by photons above 33.5 eV and destroyed by photons above 45.1 eV, has the shallowest trough. It is followed in trough depth and absorption EW by C iv, N v and O vi (47.9–64.5, 77.5–97.9 and 113.9–138.1 eV, respectively). The absorption EW (transmission at maximal absorption) is 5.8 (0.87), 9.3 (0.83), 24.6 (0.56) and 25.2 Å (0.46) for Si iv, C iv, N v and O vi, respectively. The N v absorption may be affected by Ly at . Note that C ii 1335 falls on the same trend, as its absorption is weaker ( Å) than Si iv (Fig. 1, bottom panel).
Our findings are consistent with the Allen et al. (2011) report that on average Si iv reaches smaller values of peak absorption than C iv. Gibson et al. (2009) and Allen et al. (2011) find that the C iv BI distribution has a marginally larger tendency towards higher values than Si iv. The difference in absorption depth likely implies difference in CF.
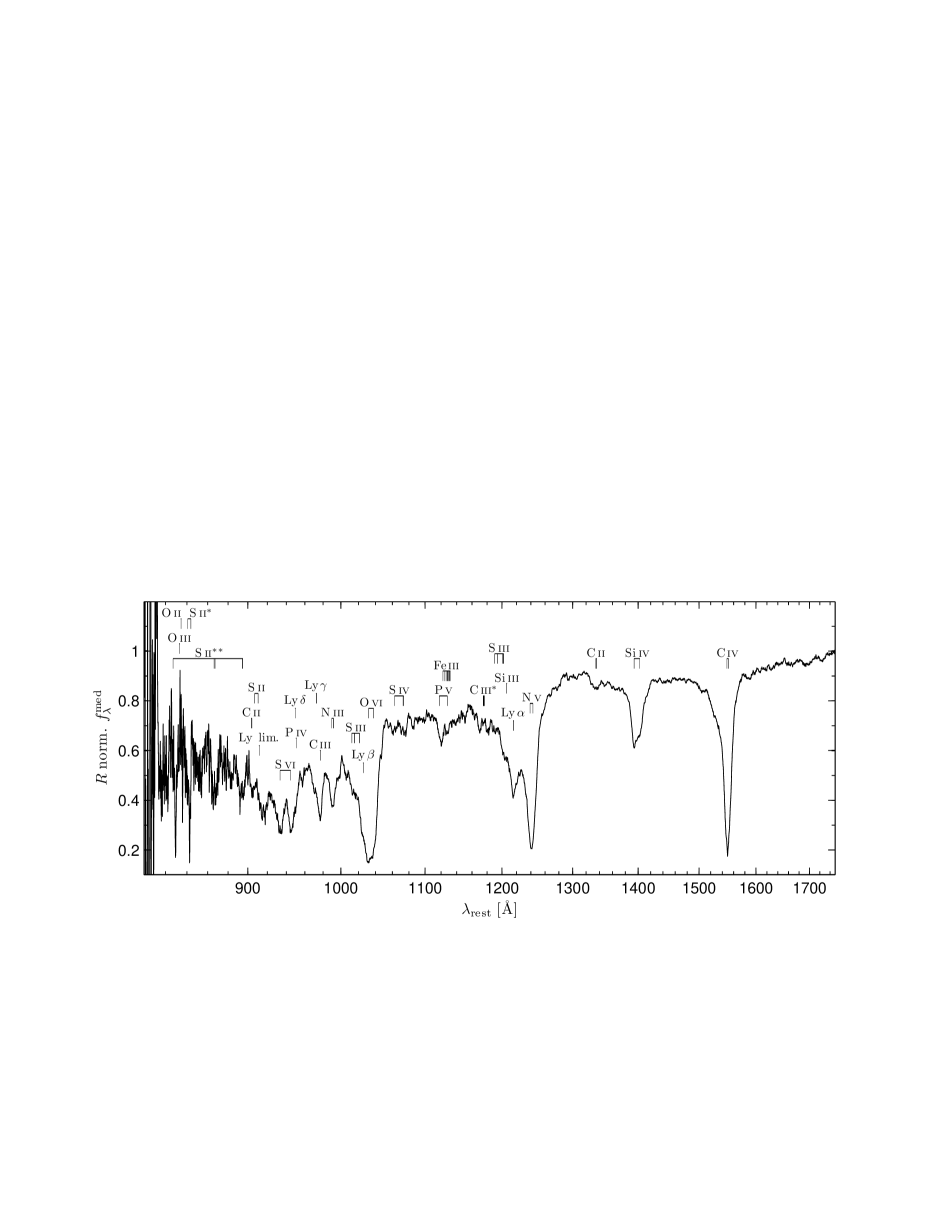
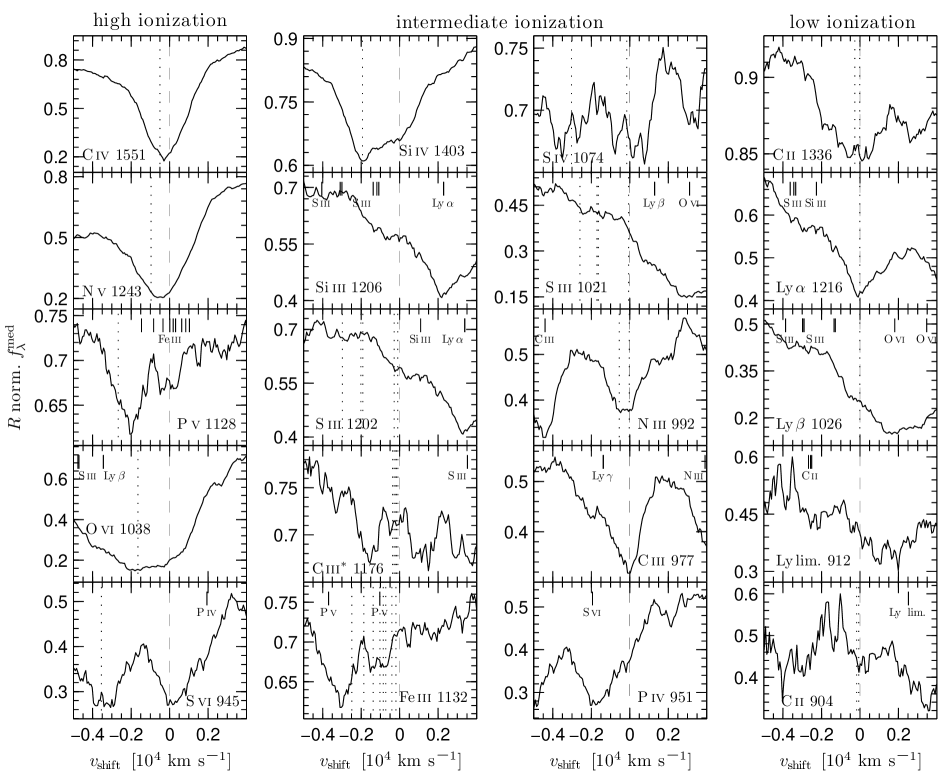
Figures 3 and 4 present the C iv peak-absorption aligned spectrum and absorption line profiles, respectively. Line identifications are indicated in Fig. 3 at the line laboratory wavelength. The peak-absorption alignment method aligns all the BALs, including low-ionization BALs (e.g., C ii 1335). The line profiles of the BALs are examined further in Fig. 4, where the lines are grouped vertically based on the ionization potential. The absorption profiles are dominated by the relatively narrow absorption component ( km s-1). Fig. 4 indicates that for several lines the absorption is saturated, as indicated by the similar absorption depth of doublet components with different oscillator strengths. The absorption profile in these cases is set by a velocity dependent CF (e.g., S vi 933, 945). Other lines are not saturated (e.g., Si iv 1397, 1403), as can be indicated by more quantitative analysis (e.g. Dunn et al. 2012, Capellupo et al. in prep. and Hamann et al. in prep.).
3.1 Constraints on the BAL H0 Column
Figure 4 can be utilized to constrain the average BAL H0 column , based on the Ly absorption line. We begin by deriving assuming a uniform foreground screen i.e., . The Ly absorption line resides within the N v absorption trough. We estimate the Ly absorption depth by interpolating linearly between the two ‘shoulders’ at km s-1 (Fig. 4), which yields a continuum at the line centre. The measured at the peak absorption implies a Ly peak absorption of . Assuming a Maxwellian absorption profile with a velocity dispersion parameter of 1000 km s-1, yields cm-2 (e.g., Draine 2011, eq. C.1). This implies at the Lyman edge (e.g., Osterbrock 1989, eq. 2.4), which is consistent with a non-detection of the edge in the absorption-peak aligned spectrum (Fig. 4, Ly lim. panel). However, the Ly line and Lyman edge can be highly saturated, with well above the derived value. In that case, the Ly absorption profile reflects the CF of the saturated cold absorber, which is at least . However, the observed Lyman edge region shows no detectable edge, i.e. , and implies cm-2 if . In addition, the Ly shows only weak absorption, well below 0.24, if we adopt the O vi shoulder as the local continuum, which also suggests a non saturated Ly absorption.
Another constraint on the CF of any nearly neutral saturated absorber can be derived from the C ii 1335 absorption line. The spectrum in the C ii region shows at the line centre, compared to an estimated local continuum of 0.89 (Fig. 4, C ii 1336 panel), which implies a , consistent with the non detection of the expected Lyman edge absorption.
We note in passing that photoionization models indicate that the Ly absorption should be at least as strong as Si iv for solar metallicity, regardless of the ionization parameter (Baskin & Laor, 2012). This is consistent with our observations, as the Si iv absorption goes down from to 0.62 that indicates peak absorption of , which is similar to the Ly peak absorption.
An obvious general caveat is that the above analysis is applied to the median absorption profile, and may not be valid to individual objects, such as LoBALQs, which are not excluded from the high- BALQ sample.
4 Which parameters control the absorption profile?
In this section we use composite spectra to examine the relationship of C iv BAL properties to He ii EW, , and other measured parameters.
4.1 C iv BAL trends with the He ii EW
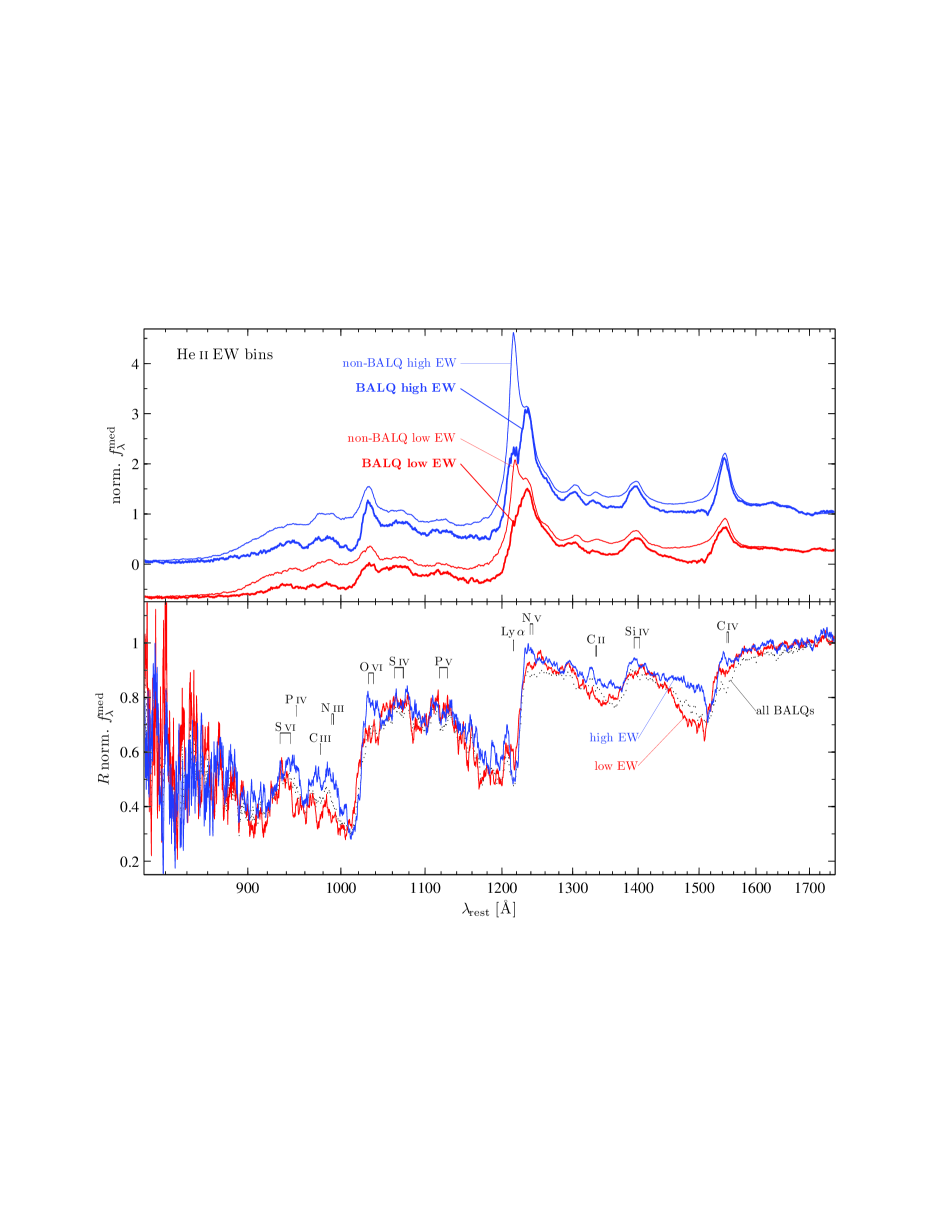
Figure 5 presents the high- BALQ and non-BALQ samples separated into two bins based on their He ii EW (as further described below). The upper panel presents the composite spectra of the two bins for BALQs and for non-BALQs, and the lower panel presents the spectra for the two bins. The low He ii EW bin displays a somewhat deeper and significantly broader C iv BAL, with peak absorption shifted to larger . This trend is also observed for Si iv and possibly for O vi, although a clear detection of the trend for the latter is hindered by the low S/N and the blending of a number of adjacent absorption lines. The trend does not appear significant for N v, probably due to contamination by the adjacent low ionization line Ly , which is prominent relative to other low ionization lines (e.g., Fig. 3). The weaker trend between the He ii EW and the N v and O vi BALs is further discussed in Section 5.1. The drop in the spectrum at the red wing of the C iv emission line reflects a mismatch in the C iv emission EW between BALQs and non-BALQs for the same bin (see Fig. 5, top panel), and is most likely not an absorption effect. Table 1 summarizes various properties of the two He ii EW bins, and lists the first three moments of the C iv absorption profile (EW, mean and dispersion ).
| Class | Bin | He ii | C iv BAL | |||||
| EW | EW | |||||||
| [Å] | [Å] | [km s-1] | [km s-1] | [per cent] | ||||
| BALQs | high | 100 | 5.4 | 12.0 | 13000 | 6800 | ||
| low | 100 | 0.4 | 14.8 | 12500 | 4700 | |||
| non- | high | 778 | 6.1 | |||||
| BALQs | low | 353 | 0.7 | |||||
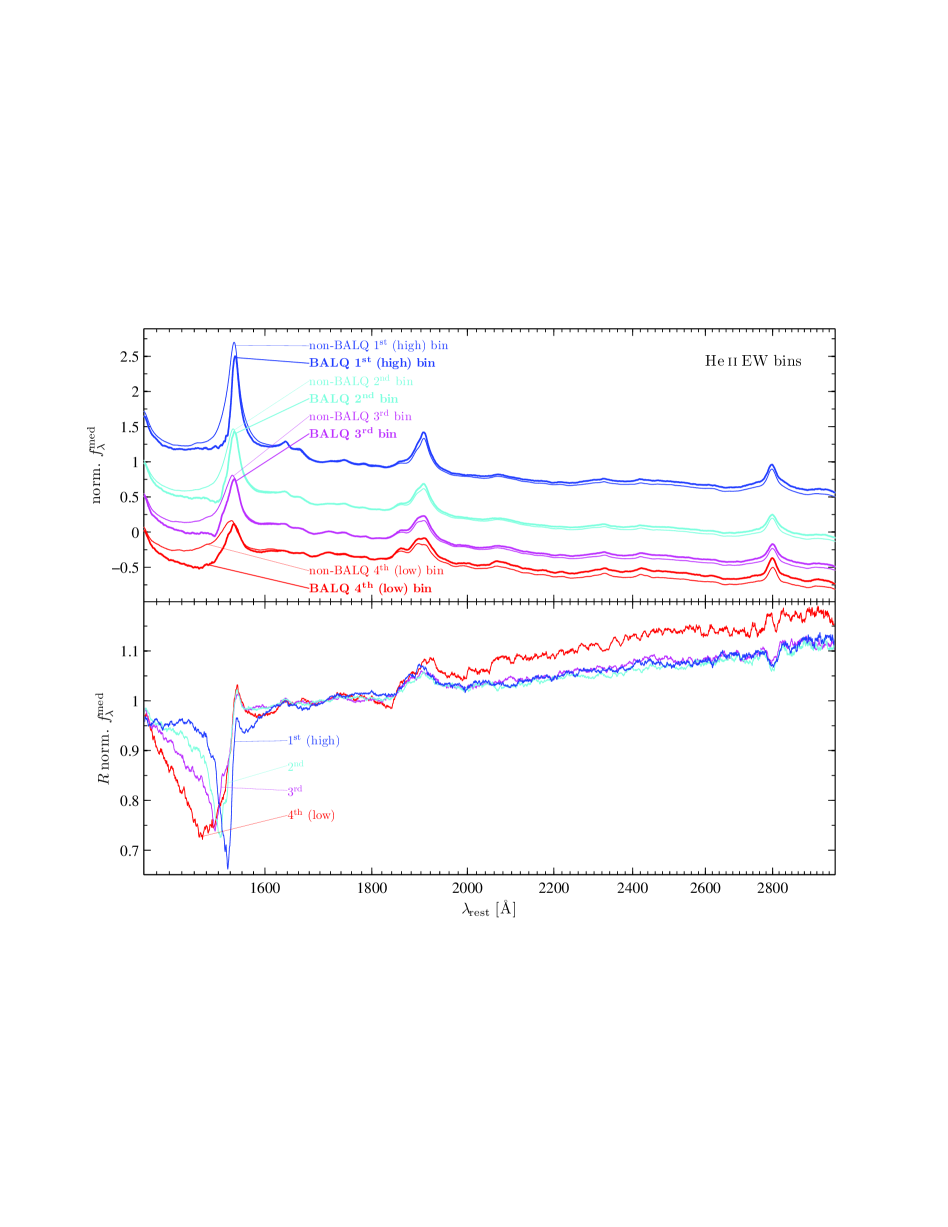
Figure 6 presents the He ii EW binning for the low- sample, this time binned to 4 bins (as further described below), allowed by the larger sample size (see Section 2). The same trend of increasing depth and blueshift in the C iv absorption profile with decreasing He ii EW is observed here as well. There is also an excess emission in the complex in the spectra, which does not depend on the He ii EW. The excess is related to a trend with discussed below (Section 4.2). Table 2 lists the bin median properties, including the median Mg ii FWHM, , and . It also presents the number of LoBALQs with similar He ii EW. LoBALQs are found predominately in the lowest He ii EW bin (43 out of 56 objects). In Appendix A we present a LoBALQ composite based on the 56 objects we excluded from our low- sample in order to form the low- HiBALQ sample (Section 2). The redder spectrum of the lowest He ii EW bin, compared to the other three, might represent a smooth transition between HiBALQs and LoBALQs, where the latter have the lowest He ii EW and the reddest spectrum (Appendix A). The smooth transition scenario can be further explored by analysing the Mg ii BAL dependence on the He ii EW and reddening in LoBALQs. This requires a larger sample of LoBALQs and is outside the scope of this paper.
Tables 1 and 2 list for each BALQ bin the observed BALQ fraction in DR7, which is defined as . The tabulated errors on are minimal, and are based purely on number statistics. There is a strong trend between and the He ii EW. For the low- sample, goes up from per cent for the highest He ii EW bin, to per cent for the lowest bin. For the high- sample, a similar trend is found, and goes up from per cent for the high He ii EW bin to per cent for the low He ii EW bin.
| Class | He ii | Mg ii | C iv BAL | ||||||||||
|---|---|---|---|---|---|---|---|---|---|---|---|---|---|
| EW | FWHM | EW | |||||||||||
| [Å] | [erg s-1] | [km s-1] | [M☉] | [Å] | [km s-1] | [km s-1] | [per cent] | ||||||
| BALQs | 1 | 399 | 7.0 | 45.90 | 3900 | 9.03 | 7 | 7.8 | 2500 | ||||
| 2 | 399 | 4.7 | 45.97 | 4400 | 9.14 | 1 | 13.9 | 5700 | |||||
| 3 | 399 | 3.0 | 46.00 | 4100 | 9.09 | 5 | 15.7 | 5900 | |||||
| 4 | 399 | 0.9 | 45.99 | 3400 | 8.93 | 43 | 22.5 | 6000 | |||||
| non- | 1 | 5330 | 7.3 | 45.81 | 3800 | 8.93 | |||||||
| BALQs | 2 | 3461 | 4.7 | 45.93 | 4000 | 9.03 | |||||||
| 3 | 2425 | 3.1 | 45.94 | 3700 | 8.98 | ||||||||
| 4 | 1368 | 1.0 | 45.93 | 3300 | 8.87 | ||||||||
4.2 C iv BAL trends with
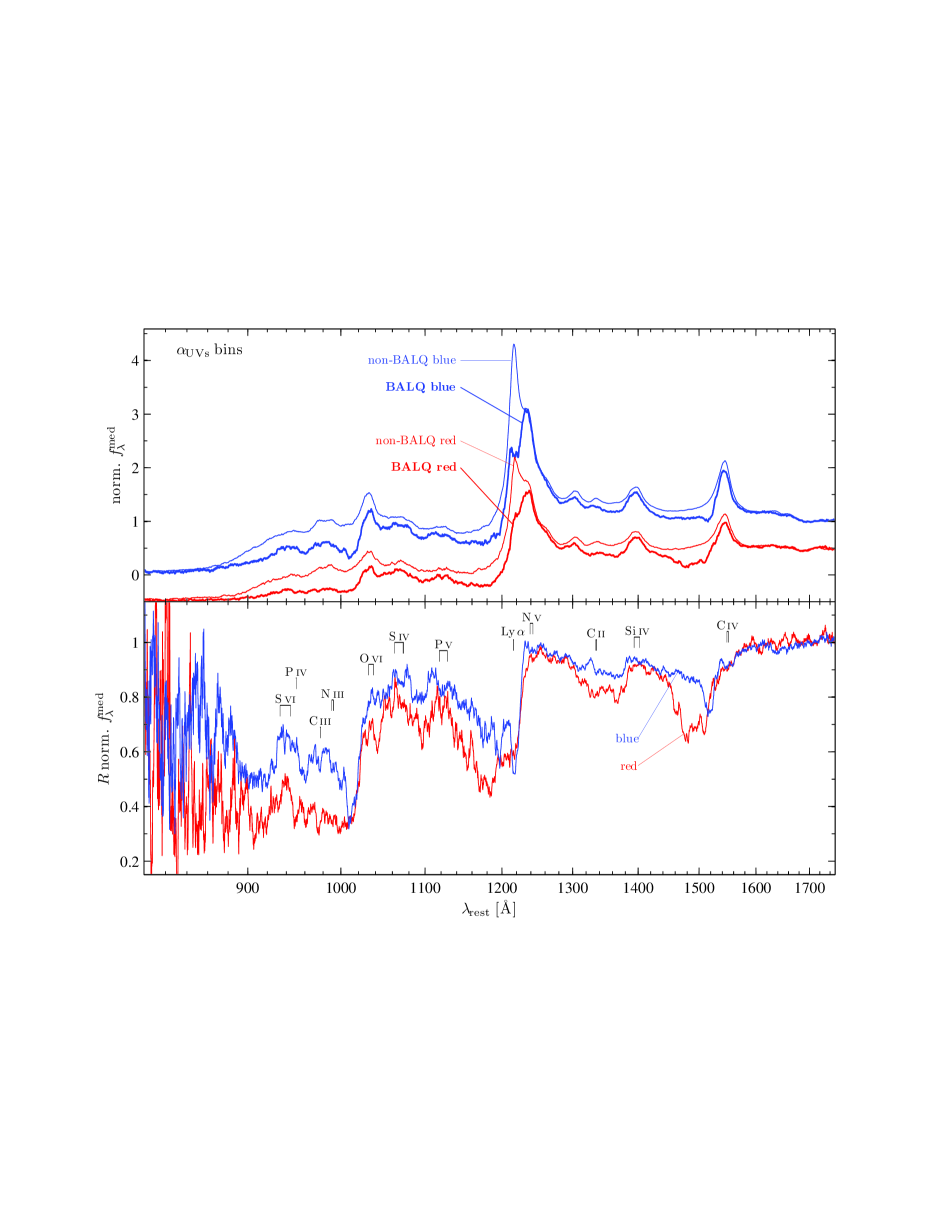
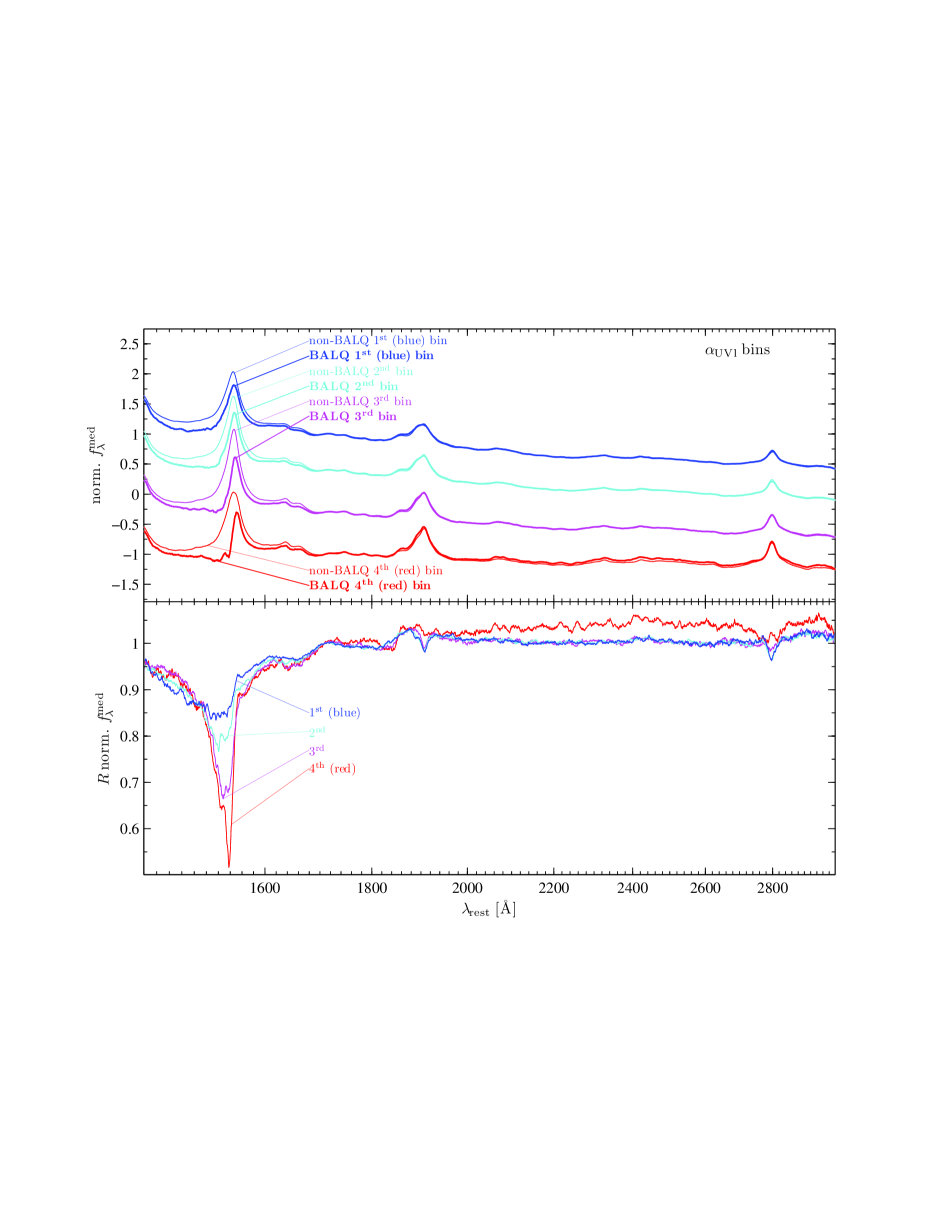
Figures 7 and 8 explore the dependence of the BALQ absorption on . Figure 7 presents the high- sample binned into two bins. The C iv absorption profile follows the trend observed in the He ii EW binning, where the redder bin corresponds to the lower He ii EW bin. Table 3 lists the bin median properties of the high- sample. The median of the BALQ bins is redder than the slope of the matched non-BALQ bins. Although the bins are matched by the range (Section 2), the distribution of values within the bin is different for the BALQs and non-BALQs. This slope difference yields the observed residual reddening of the spectrum (Fig. 7, bottom panel). Figure 8 presents the low- sample divided into four bins. The trend with is different from the trend with . The low velocity C iv absorption profile becomes deeper as becomes redder, while at higher velocities the C iv absorption profile remains unchanged. Table 4 summarizes the bin median properties. Note that the complex emission becomes stronger with redder (Fig. 8, top panel), and the BALQ and non-BALQ matched composites have a similar complex emission.
The fraction of BALQs increases as the objects get redder. At the high- sample, increases from to per cent, while at the low- sample, increases from to per cent from the bluest to the reddest quartile. Most of the detected LoBALQs (44 out of 56) have slopes at least as red as the reddest bin, as expected (see Section 1).
| Class | Bin | He ii | C iv BAL | |||||
| EW | EW | |||||||
| [Å] | [Å] | [km s-1] | [km s-1] | [per cent] | ||||
| BALQs | blue | 100 | 4.8 | 7.9 | 11700 | 6300 | ||
| red | 100 | 1.2 | 17.2 | 12600 | 4800 | |||
| non- | blue | 848 | 5.3 | |||||
| BALQs | red | 282 | 1.2 | |||||
| Class | He ii | Mg ii | C iv BAL | ||||||||||
|---|---|---|---|---|---|---|---|---|---|---|---|---|---|
| EW | FWHM | EW | |||||||||||
| [Å] | [erg s-1] | [km s-1] | [M☉] | [Å] | [km s-1] | [km s-1] | [per cent] | ||||||
| BALQs | 1 | 399 | 3.5 | 45.92 | 4100 | 9.08 | 3 | 7.6 | 6200 | ||||
| 2 | 399 | 4.0 | 45.97 | 4100 | 9.09 | 3 | 8.2 | 5600 | |||||
| 3 | 399 | 4.3 | 45.97 | 3900 | 9.05 | 6 | 6.8 | 2300 | |||||
| 4 | 399 | 3.5 | 46.00 | 3600 | 9.02 | 44 | 10.3 | 2500 | |||||
| non- | 1 | 5414 | 4.6 | 45.86 | 3800 | 8.96 | |||||||
| BALQs | 2 | 3334 | 5.4 | 45.92 | 3800 | 8.99 | |||||||
| 3 | 2349 | 5.9 | 45.89 | 3700 | 8.97 | ||||||||
| 4 | 1526 | 5.1 | 45.86 | 3600 | 8.92 | ||||||||
4.3 C iv BAL trends with both He ii EW and
Figure 9 shows a zoom-in on the C iv absorption profile for the low- sample, and highlights the strong and different trends between the C iv BAL properties and the He ii EW and (not true for ). The He ii EW mostly controls the characteristic absorption , while mostly controls the absorption depth, in particular at km s-1. Thus, it appears that the He ii EW and are independent parameters which span the C iv absorption profile properties. Their independence can also be inferred from Table 2, which shows similar median values in the different He ii EW bins, and similarly in Table 4, where the different bins show similar median He ii EW values. This is in contrast with the high- sample, where and the He ii EW are correlated (Tables 1 and 3).
The highest He ii EW and the bluest bins may be incomplete in other BALQ studies based on a BI selection. A value of requires a BAL with a significant absorption ( per cent) at least down to km s-1 (given a minimal width of 2000 km s-1, starting at km s-1, Weymann et al. 1991). Since we find that decreases with increasing He ii EW, the highest He ii EW bin might be missing yet lower BALQs, with peak absorption at km s-1. Similarly, BALQs residing in the bluest bin may be missed, since the peak-absorption is per cent for this bin (Fig. 9). Our sample is derived based on a BI0 and visual selection (see Section 2), where BI requires significant absorption ( per cent) at least down to km s-1. Thus, large He ii EW, low BALQs are probably not missing in our sample, but weak BALs ( per cent) possibly present in BALQs with the bluest may be missing.
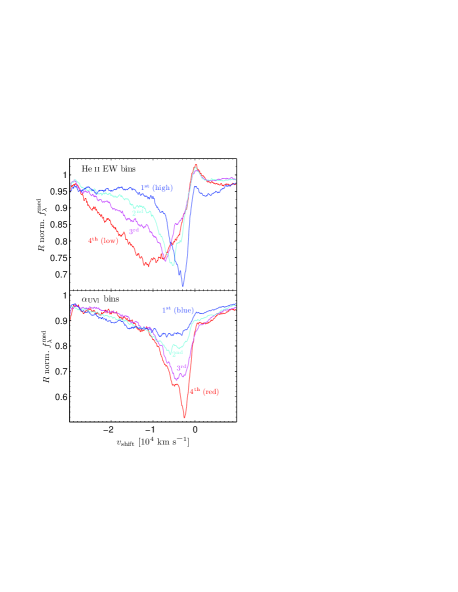
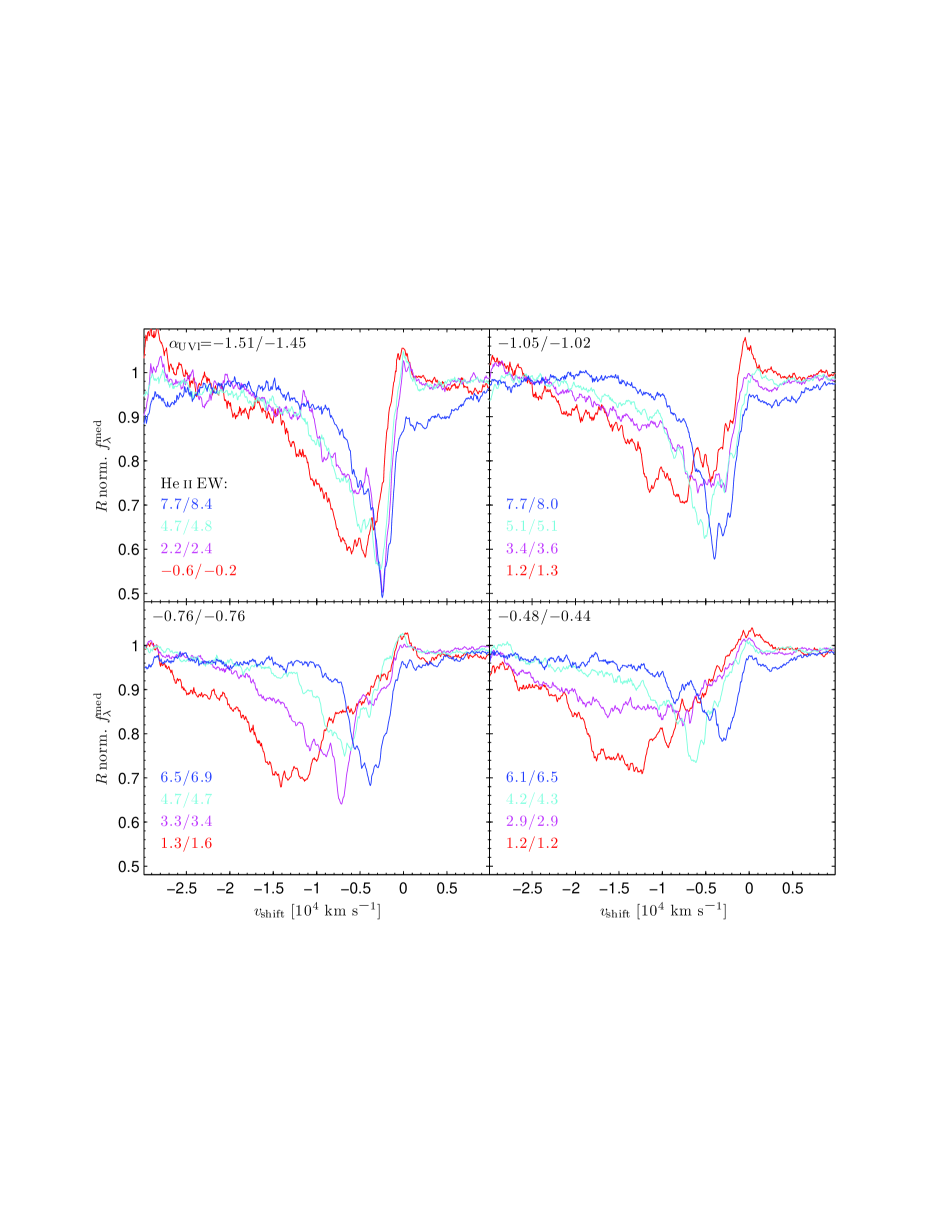
Figure 10 explores the C iv BAL dependence on the He ii EW for different values of . We divide the low- sample into bins based on and the He ii EW. First, the BALQ sample is divided into four ‘parent’ bins, and matched non-BALQ bins are constructed (same procedure as in Fig. 8). Then, each parent bin is divided into four He ii EW bins, with matching non-BALQs from the corresponding non-BALQ bin. As Fig. 10 shows, the C iv absorption at a given , shifts to higher as the He ii EW decreases, at all four bins. Also, the maximum absorption depth at all He ii EW bins, gets larger as gets redder. The change in is most prominent for the bluest two bins. Table 5 lists the median properties for the bins. Note that the reddest and lowest He ii EW BALQ and non-BALQ bins have median He ii EW . This is an artefact which results from measuring the EW by using the continuum at 1700–1720 Å, where in the reddest and weakest He ii objects the flux density at He ii is lower than at 1700–1720 Å, leading to a negative EW (Section 2). The negative He ii EW has no effect on the binnings, which are independent of the absolute He ii EW values. The value of increases with decreasing He ii EW, at a given , and also as gets redder, at a given He ii EW. We find the smallest value of per cent in the highest He ii EW and bluest bin, increasing to per cent in the lowest He ii EW and reddest bin. Most of the LoBALQs (33/56) reside in the reddest and lowest He ii EW bin.
| Class/ | He ii | Mg ii | C iv BAL | |||||||||
|---|---|---|---|---|---|---|---|---|---|---|---|---|
| EW | FWHM | EW | ||||||||||
| [Å] | [erg s-1] | [km s-1] | [M☉] | [Å] | [km s-1] | [km s-1] | [per cent] | |||||
| BALQs | 1 | 99 | 6.1 | 45.84 | 4500 | 9.08 | 2 | 6.2 | 4200 | |||
| 2 | 100 | 4.2 | 45.91 | 4700 | 9.17 | 0 | 12.2 | 6000 | ||||
| 3 | 100 | 2.9 | 45.98 | 3900 | 9.06 | 0 | 13.9 | 6300 | ||||
| 4 | 100 | 1.2 | 45.94 | 3300 | 8.90 | 1 | 19.5 | 5600 | ||||
| non- | 1 | 2276 | 6.5 | 45.77 | 3900 | 8.95 | ||||||
| BALQs | 2 | 1488 | 4.3 | 45.91 | 4000 | 9.03 | ||||||
| 3 | 1015 | 2.9 | 45.93 | 3600 | 8.98 | |||||||
| 4 | 598 | 1.2 | 45.90 | 3200 | 8.84 | |||||||
| BALQs | 1 | 99 | 6.5 | 45.90 | 4600 | 9.14 | 0 | 6.3 | 1800 | |||
| 2 | 100 | 4.7 | 45.97 | 4300 | 9.12 | 0 | 13.0 | 6200 | ||||
| 3 | 100 | 3.3 | 46.04 | 4300 | 9.16 | 1 | 15.9 | 5300 | ||||
| 4 | 100 | 1.3 | 45.97 | 3400 | 8.93 | 2 | 23.7 | 6200 | ||||
| non- | 1 | 1518 | 6.9 | 45.88 | 3800 | 8.98 | ||||||
| BALQs | 2 | 827 | 4.7 | 45.96 | 4000 | 9.05 | ||||||
| 3 | 547 | 3.4 | 45.97 | 3700 | 8.99 | |||||||
| 4 | 318 | 1.6 | 45.97 | 3400 | 8.92 | |||||||
| BALQs | 1 | 99 | 7.7 | 45.91 | 3700 | 8.95 | 0 | 8.5 | 2000 | |||
| 2 | 100 | 5.1 | 45.97 | 4300 | 9.18 | 0 | 11.8 | 3400 | ||||
| 3 | 100 | 3.4 | 46.02 | 3900 | 9.08 | 1 | 14.2 | 5400 | ||||
| 4 | 99 | 1.2 | 45.97 | 3400 | 8.95 | 5 | 22.1 | 5900 | ||||
| non- | 1 | 1107 | 8.0 | 45.83 | 3700 | 8.93 | ||||||
| BALQs | 2 | 539 | 5.1 | 45.95 | 3900 | 9.04 | ||||||
| 3 | 414 | 3.6 | 45.95 | 3800 | 9.00 | |||||||
| 4 | 243 | 1.3 | 45.97 | 3600 | 8.95 | |||||||
| BALQs | 1 | 99 | 7.7 | 45.93 | 3300 | 8.86 | 3 | 6.3 | 1400 | |||
| 2 | 100 | 4.7 | 46.05 | 4000 | 9.09 | 3 | 18.3 | 4700 | ||||
| 3 | 100 | 2.2 | 46.02 | 3700 | 9.05 | 5 | 14.6 | 3700 | ||||
| 4 | 100 | 46.03 | 3700 | 8.93 | 33 | 25.9 | 5800 | |||||
| non- | 1 | 620 | 8.4 | 45.78 | 3500 | 8.85 | ||||||
| BALQs | 2 | 362 | 4.8 | 45.91 | 3900 | 9.01 | ||||||
| 3 | 307 | 2.4 | 45.95 | 3500 | 8.93 | |||||||
| 4 | 224 | 45.91 | 3400 | 8.87 | ||||||||
4.4 C iv BAL dependence on other emission properties
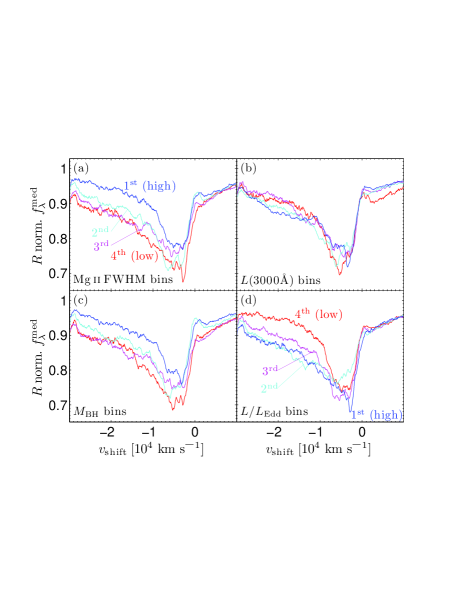
Figure 11 investigates whether a certain physical property underlies the above relations between the absorption profile and the He ii EW and . The figure presents the C iv BAL profile for samples binned based on the Mg ii FWHM, , and values. Table 6 lists the property median value of each bin for each of the 4 binning procedures. There is no trend in the absorption profile with . There is a trend of stronger and broader absorption profile with decreasing Mg ii FWHM, however the dynamical range in the absorption properties is significantly smaller than the range found for the He ii EW or binning. Similar trends are seen with and . However, these two parameters are strongly correlated with the Mg ii FWHM, given the small range in (Table 6), and since displays no trend, the C iv BAL trend with and is equivalent to the trend with Mg ii FWHM. Also, is either nearly constant, or shows a range of generally less than a factor of two, which is another indication these four parameters are not the fundamental parameters that underlie the C iv BAL profile. Thus, the He ii EW and appear to be the primary parameters. The possible underlying physical explanation is discussed below (Section 5).
A cautionary note is that one should keep in mind that the evaluated trends with and may not appear significant, since the sample does not cover a large enough dynamical range in ( dex) to surpass the dex uncertainty in the prescription calibration (Laor, 1998; Krolik, 2001; Bentz et al., 2009; Woo et al., 2010).
| Class | Mg ii FWHM | ||||||||||||
|---|---|---|---|---|---|---|---|---|---|---|---|---|---|
| [km s-1] | [erg s-1] | [M☉] | |||||||||||
| BALQs | 1 | 6200 | 399 | 46.26 | 399 | 9.47 | 399 | 0.07 | 399 | ||||
| 2 | 4500 | 399 | 46.04 | 399 | 9.16 | 399 | 399 | ||||||
| 3 | 3400 | 399 | 45.90 | 399 | 8.91 | 399 | 399 | ||||||
| 4 | 2200 | 399 | 45.66 | 399 | 8.49 | 399 | 399 | ||||||
| non- | 1 | 6200 | 2567 | 46.26 | 2225 | 9.47 | 2167 | 0.03 | 2889 | ||||
| BALQs | 2 | 4400 | 3168 | 46.04 | 2469 | 9.17 | 2876 | 3350 | |||||
| 3 | 3400 | 3693 | 45.89 | 2950 | 8.92 | 3861 | 3312 | ||||||
| 4 | 2200 | 3187 | 45.60 | 4981 | 8.51 | 3732 | 3084 | ||||||
4.5 Comparison with previous studies
The results of this study are consistent with previous findings. Richards et al. (2002) and Reichard et al. (2003) report that BALQs have slightly weaker He ii emission than non-BALQs. Richards et al. (2002) find that their LoBALQ composite has a weaker He ii emission than the HiBALQ and non-BALQ composites. This is consistent with most of the LoBALQs residing in our lowest He ii EW bin. Reichard et al. (2003) also find the HiBALQs to be redder than non-BALQs, and the LoBALQs to be the reddest. Richards et al. (2003) report a trend between the quasar colour and by similarly dividing their sample into four bins. Their goes up from per cent for the bluest bin (compared to our per cent) to per cent for the reddest bin ( per cent). A relationship between reddening and the He ii EW that breaks for the reddest bin (Table 4) was also previously reported by Richards et al. (2003). The large fraction of LoBALQs found here in bins that have the largest C iv absorption is consistent with Allen et al. (2011), who find that LoBALQs reside mainly in objects with a strong and broad C iv absorption (i.e., a high BI; see also Appendix A). Trump et al. (2006) report that BALQs have broader emission lines than non-BALQs, which is consistent with the high Mg ii FWHM bin having the largest (Table 6). The small range in luminosity of the samples analysed here, prevents detection of the Baldwin effect (e.g., Gibson et al. 2009). In this small range, we find a monotonic growth of with (from to per cent), which is also reported by Allen et al. (2011) and attributed to a S/N selection effect (see also Knigge et al. 2008). The trend found here is also affected by this effect, since there is a tight correlation in the low- sample between the spectral S/N and , with the Spearman rank-order correlation coefficient of and 0.66 for the BALQ and non-BALQ samples, respectively (null probability of ). The median S/N per resolution element after smoothing (Section 2) monotonically increases from for the lowest- bin objects to for the highest- bin objects, and some of the absorption is shallow enough to be affected by the S/N level (see Section 4.3).
5 A physical interpretation
We describe below a possible physical context for our findings. First, we suggest how the He ii EW, which may be an indicator of the relative strength of the ionizing continuum beyond 4 Ryd, controls the C iv BAL and (Section 5.1). Then, we put forward a possible explanation on how , which may be a reddening indicator, controls the C iv BAL depth and (Section 5.2). Finally, we briefly discuss connections to earlier studies (Section 5.3).
5.1 C iv BAL trends with the He ii EW
What produces the strong trend between the C iv BAL and the He ii EW? The He ii 1640 emission line is a recombination line, and provides a measure of the number of He ii ionizing photons, i.e. photons above 54 eV, which are absorbed by the BLR gas. The He ii EW serves as a measure of the relative strength of the EUV continuum above 54 eV, compared to the near UV continuum. As the BAL outflow increases its radial velocity, its density must drop, and its ionization parameter must rise, potentially leading to complete ionization. Complete ionization halts further acceleration of a radiation pressure driven outflow. A higher He ii EW implies a higher ionization parameter at a given outflow density, and thus overionization of the outflow already at a higher density, i.e. at an earlier stage of the wind acceleration, where the outflow velocity is smaller. Even if the outflow is not radiation pressure driven (say it is magnetically driven), a harder ionizing continuum will overionize the outflow already at lower velocities, but due to different qualitative reasons (Fukumura et al., 2010a, b). In the magnetically driven wind model of Fukumura et al. (2010a), the wind density and velocity go as and , respectively, where is the distance from the ionizing source. The density law implies that the ionization parameter also goes as . Thus, in contrast with a radiation driven outflow, here the ionization parameter increases with increasing density and decreasing i.e., increasing velocity. However, for a harder ionizing continuum, the magnetically driven outflow gets overionized up to a larger , i.e. down to a lower velocity. Thus, the C iv BAL extends to lower maximal velocities, as expected for a radiation driven outflow, and as found in this study.
To prevent overionization, Murray et al. (1995) suggested the presence of a shielding gas, which blocks highly ionizing photons directed towards the outflow, preventing its overionization. Thus, ions such as C iv remain, despite the rise in the ionization parameter with increasing velocity. The observed relationship between and the He ii EW suggests that an outflow overionization does take place when the continuum which illuminates the BLR is hard enough. A large is obtained when the AGN ionizing continuum is soft, possibly enough to prevent overionization. Thus, one may not need to invoke a separate shield to prevent overionization. The suggestion that the observed weakness of the He ii EW is sufficient to prevent overionization of the outflow, can be explored quantitatively through photoionization modelling of wind model.
The rise in with decreasing He ii EW is expected as a larger outflow volume is not overionized, leading to a larger CF of the BAL absorber. A magnetohydrodynamic wind model may also produce a similar rise in the CF, as a softer ionizing continuum implies absorbing wind which extends to a smaller , and may produce a larger CF of the continuum source (Fukumura et al., 2010b). It should be noted that since we are analysing average absorption profiles, the measured CF has an inherent degeneracy between the CF as seen by an observer, the global covering factor of BAL gas (i.e., the CF as seen by the continuum source) and the fraction of BALQs absorbing at a given .
Alternatively, the He ii EW may indicate the fraction of the sky of the ionizing continuum covered by the BLR gas instead of a measure of the strength of the EUV continuum above 54 eV. However, there are various relations favouring the interpretation of the He ii EW as an ionizing SED indicator. The EUV slope is similar to (Zheng et al., 1997; Laor et al., 1997; Telfer et al., 2002). The is correlated with luminosity (Strateva et al., 2005; Steffen et al., 2006; Just et al., 2007), and luminosity only (Stern & Laor, 2012). Similarly, the He ii 4686 EW is correlated with luminosity only (Boroson & Green, 1992). Thus, the ionizing continuum gets softer with increasing luminosity, leading to the drop in the He ii EW with increasing luminosity. Also, lower luminosity objects have a flatter EUV slopes (Scott et al. 2004; cf. Telfer et al. 2002 and Shull et al. 2012). In addition, a BLR trend with luminosity is not expected to directly affect . Future observations can explore directly whether the He ii EW is correlated with the EUV slope.
In contrast with the C iv BAL, the N v and O vi BALs do not show a prominent difference in their absorption profiles with the He ii EW (Fig. 5). The blue wing of O vi may be affected by N iii 991 absorption, and to a lesser extent by C iii 997 absorption, while the N v absorption is affected by Ly absorption. Note also that the N v and O vi ions are produced and destroyed by photons at energies significantly above 54 eV, in contrast with the C iv ion, where these energies (47.9–64.5 eV, Section 3) are just below and above 4 Ryd. One thus needs to further explore with photoionization calculations the relation between the He ii emission EW, and the expected N v and O vi columns relative to the C iv column, as a function of the ionizing spectral shape.
5.2 C iv BAL trends with
What produces the trend between the absorption depth and ? The value of may be interpreted as a viewing angle indicator, if it is affected by reddening, and if the dust tends to reside in the symmetry plane of the system. A support for this scenario is provided by a relation between the optical-UV slope () and the degree of white light polarization, found by Baskin & Laor (2005) in the complete sample of Boroson & Green (1992) PG quasars. A redder is associated with a higher polarization, as expected for a system observed closer to edge on. Baskin & Laor (2005) also show that the change in is consistent with dust reddening (see also Stern & Laor 2012, fig. 17 there). In this interpretation, if there is a clumpy and planar distribution of absorbers, then a redder corresponds to viewing angles closer to edge-on, for which there is a larger probability that our line of sight intersects a UV absorbing gas cloud, and also a dusty gas cloud, i.e. a larger BAL CF and a larger reddening. This explains both the deeper absorption at a given , as a larger fraction of the central source is obscured, and the rise in , as a larger fraction of lines of sight passes through an absorber. It is interesting to note that the median absorption depth increases from per cent at the shallowest , to per cent at the steepest (Fig. 9), while changes similarly from to per cent with (Table 4).
BALQs observed at a larger inclination are also likely to have a larger absorbing column. However, since all lines are most likely saturated, they are not expected to show a rising absorbing EW. However, X-ray observations may reveal larger absorbing columns in steeper BALQs.
The inclination interpretation of implies that BALQs and non-BALQs, at a given , are observed at the same inclination. What separates BALQs from non-BALQs is then whether an outflow component happens to lie along our line of sight. This scenario requires an azimuthally asymmetric outflow structure, which is also hinted at by the absorption profile variability (e.g., Capellupo et al. 2011, 2012).
The inclination interpretation of can also explain the lower observed in redder BALQs (Figure 10). Viewing a BALQ close to edge-on increases the probability that the line of sight goes through the base of outflowing absorbing gas, where the projected velocities are lower. A trend indeed observed in recent disc wind simulation by Giustini & Proga (2012, figure 5 there). In contrast, the km s-1 part of the outflow shows only a weak dependence (Figure 9), which suggests the higher velocity outflow component is more spatially extended, and thus less inclination dependent.
We note in passing that binning by the shorter wavelengths leads to C iv profiles which are very similar to those derived from the He ii EW binning, which is in contrast with the result for the binning. Thus, is not orthogonal to the He ii EW, as is. This can also be seen in Table 3, where the two bins show a factor of 4 difference in their median He ii EW, in contrast with their similar values in the bins (Table 4). Thus, appears to be related to the ionizing SED, as measured by the He ii EW, while is independent of the ionizing SED, and likely provides a measure of the dust extinction (and indirectly the inclination). This qualitative difference is not unexpected, if the optical-UV continuum is produced by accretion disc emission. At long wavelengths, accretions discs are expected to show a universal SED slope, as we are observing the universal slope part of the disc emission (realistic model slopes are not that flat), which is independent of and . At short enough wavelengths, the slope starts to probe the position of the accretion disc spectral turnover region, and is thus a measure of the ionizing SED (e.g. Davis & Laor 2011).
5.3 The luminosity dependence of
Brandt et al. (2000) and Laor & Brandt (2002) found a clear correlation of the maximal outflow velocity and the AGN luminosity in soft X-ray weak objects. This relation is quite robust as no Seyfert-level AGN is found to reach km s-1, which is common in BALQs. A pure luminosity trend is simply explained by radiation pressure driven winds (Laor & Brandt, 2002, sec. 3.4 there), which gives for a wind launched from the BLR with a constant force multiplier. The observed steeper relation can be interpreted as an indication of a force multiplier that rises with (Laor & Brandt, 2002). Such a rise may be caused by a softer ionizing SED at a higher , which produces less overionization, and thus a rise in the force multiplier. A softer ionizing SED at a higher is consistent with the observed inverse relation between the He ii EW and . The range in AGN luminosity is too small here to test the luminosity dependence of (but see tentative evidence in Appendix B). However, the trend found here for with the He ii EW, and the strong luminosity dependence of the He ii EW, may indicate that the observed relation between and the AGN luminosity found by Laor & Brandt (2002), may be partly driven by the versus He ii EW relationship found here. A quick inspection of the data in Laor & Brandt (2002) reveals that at a given luminosity, the highest is reached by the lowest He ii EW objects (which are also the soft X-ray weak quasars). However, a large sample which covers a large range in luminosity and the He ii EW is required to clearly separate out the dependence of on and on the He ii EW.
Inspection of Fig. 6 reveals that the C iv emission profiles get weaker and blueshifted with decreasing He ii EW, consistent with the finding of Reichard et al. (2003). Richards et al. (2011, fig. 11 there) demonstrate the tight relation between the He ii EW and the C iv emission EW and asymmetry, which they interpret as an indication for emission from a wind component in the BLR (see also Leighly & Moore 2004; Kruczek et al. 2011). Above we found that the BAL wind component becomes more prominent as the EUV ionizing continuum gets weaker, which suppresses the overionization of the wind. The suggested BLR wind component may very well be related to the base of the BAL outflow, which is most likely fed by the BLR gas. As the wind accelerates from the BLR, its density and thus emissivity drops, but it remains visible as a BAL through its resonance line absorption. A weaker He ii EW implies less overionization, which allows a higher wind emissivity closer to the base of the wind, producing a blushifted C iv emission component. Unlike the blue wing of the C iv emission that is probably produced by a matter-bounded wind component, the red wing of C iv is probably produced by a non-wind (disc) component (Richards et al., 2011), which is likely radiation bounded. As the relative strength of the EUV ionizing continuum becomes weaker, there is less production of C3+ in the radiation-bounded disc component, which leads to a weaker emission in the C iv red wing with decreasing He ii EW, as observed.
6 Can dust extinction explain the reddening?
The median BALQ SED is redder than the non-BALQ SED (Fig. 1). The difference between the two SEDs appears to be caused by the overall spectral slope, rather than local features. Is the difference in spectral slopes intrinsic to the illuminating source, or is it a result of extinction by foreground dust which is more common in BALQs?
Figure 12 presents corrections of the BALQ composite by several possible dust extinction laws. The BALQ composite is corrected to match the non-BALQ composite by adopting three types of dust extinction laws: Milky Way (MW; Cardelli, Clayton & Mathis 1989), Large Magellanic Cloud (LMC) and Small Magellanic Cloud (SMC; the latter two laws are from Gordon et al. 2003).666All three extinction laws are reported only down to Å. Here we assume the analytic functions hold down to Å. Given the low S/N of the spectrum at Å, the exact form of the extinction law used is not important. The upper panel shows the de-reddening for the high- sample. One cannot discriminate between the three extinction curves. The lower panel shows the de-reddening for the low- sample. Here one can clearly exclude a MW- and LMC-like extinction laws by and 9 standard errors in the median at Å, as they produce a strong bump at Å, which is not observed.777The standard error in the median is evaluated as follows. First, the standard deviation of at 1700–1720 Å is calculated for the median BALQ and non-BALQ spectra. Then, the error as a function of is estimated by assuming the measured error is dominated by photon statistics i.e., the standard deviation is scaled by . Finally, the error in the spectrum is calculated by the standard error progression.
A preference for SMC dust was found in various earlier studies of AGN. Sprayberry & Foltz (1992) reach a similar conclusion for the reddening of LoBALQs compared to HiBALQs. Glikman et al. (2012) find that the extinction of dust-reddened quasars in the = 4000 Å– 2.4 m range is best described by an SMC-like law (see also a brief overview of additional studies by Pitman, Clayton & Gordon 2000). Hopkins et al. (2004) report that the reddening of quasars in general is consistent with an SMC-like extinction law, while the MW and LMC laws are excluded. Richards et al. (2003) also successfully fit dust-reddened non-BALQs assuming an SMC extinction law. Thus, the result derived here is clearly not new. However, these earlier studies are all based on the observed SED. The observed SED happens to show a shallow and broad dip at Å, produce by adjacent line emission, which can mimic some effect of the 2200 Å extinction bump. The ratio plots used here eliminate all the intrinsic spectral features, and thus provide a strong constraint (to a level of per cent) on the possible extinction curve shape associated with the BAL outflow.
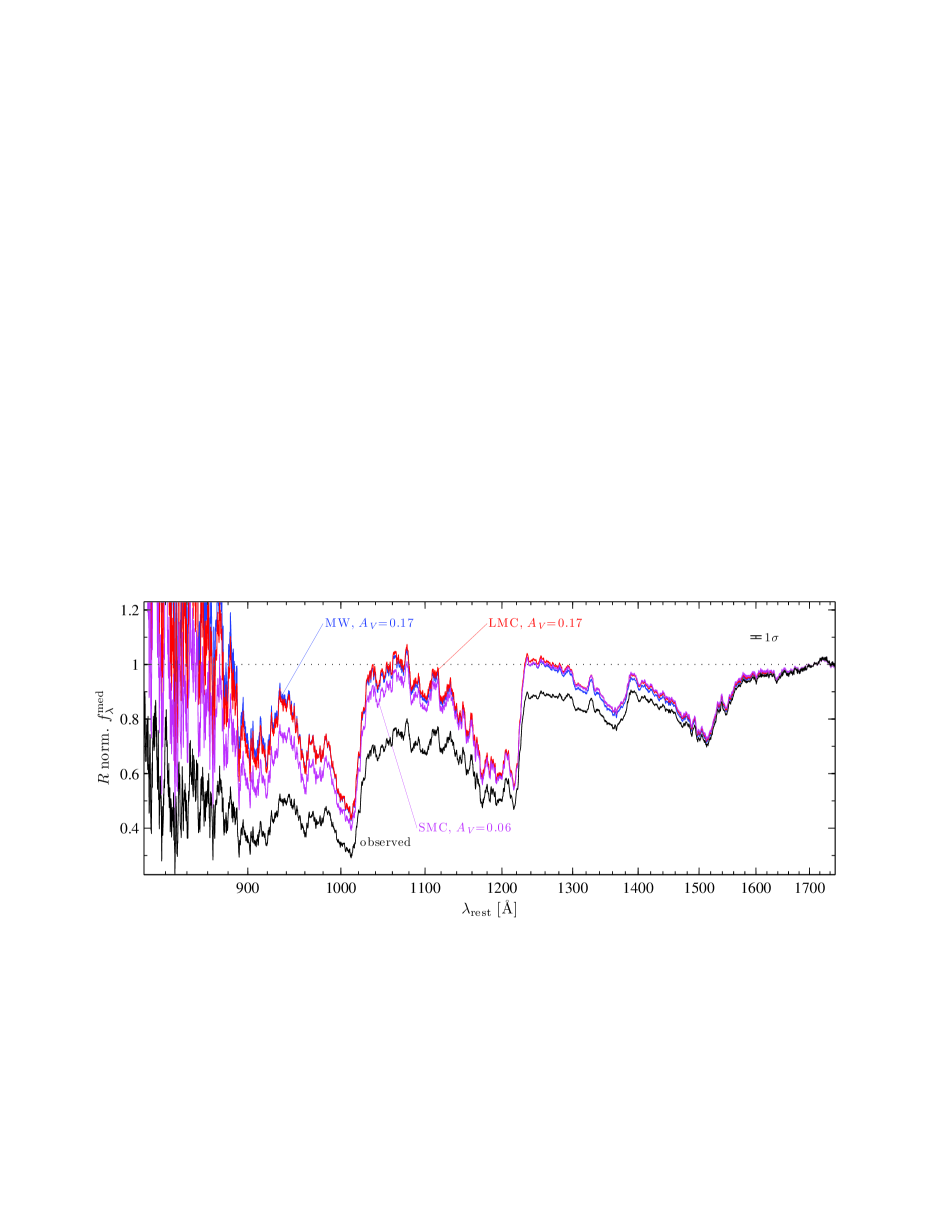
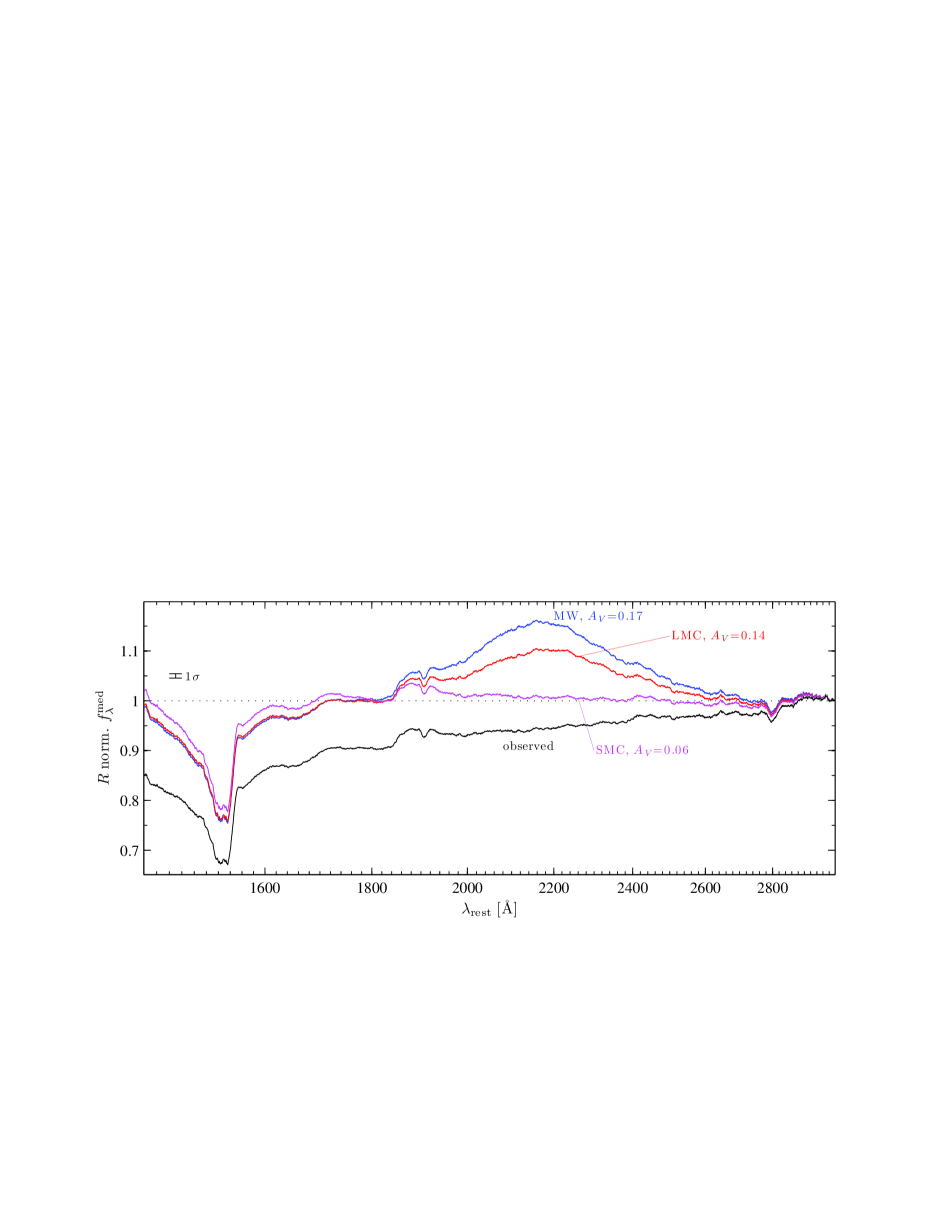
The SMC best-fit is evaluated independently for the high- and low- samples. Both samples yield mag, where the range implies a deviation that is consistent with the standard error in the median spectrum. The best fit is estimated by eye inspection, requiring the non-BALQ and dereddened BALQ composites to match in wavelength regions unaffected by strong line emission and absorption, i.e. and 1800 Å for the high- and low- samples, respectively. The mag reddening fits the top three He ii EW bins of the low- sample (Fig. 6), while the lowest He ii EW bin requires mag.
The values found here are mostly consistent with what was previously reported for BALQs (Reichard et al., 2003; Maddox et al., 2008; Gibson et al., 2009). Allen et al. (2011) find a trend between and . The derived here is consistent with the value evaluated by Allen et al. (2011) for range (our low- sample), but it is times smaller than the value for the range (our high- sample). We suspect the result of Allen et al. (2011) is an overestimate, as it over-corrects the BALQ N v line emission (see fig. 22 there).
The implied H column is cm-2, using the relation (Draine, 2011), where for the SMC extinction law (Gordon et al., 2003). Given the above constraint on the H0 column, based on the Lyman edge for a absorber (Section 3.1), the H column associated with the dust must be nearly fully ionized. If the gas is diffuse, the ionization can be maintained by the AGN on the host-galaxy scale. Since non-BALQs are also dust reddened (e.g., Richards et al. 2003; Stern & Laor 2012), the above estimate gives only the excess extinction in BALQs. To get the absolute extinction value, we evaluate the low- BALQ composite reddening relative to the bluest non-BALQ quartile composite, which is more likely to represent the intrinsic non-reddened SED. This yields mag and cm-2. A similar analysis for the high- sample, utilizing the bluest non-BALQ composite, yields mag and cm-2.
Since the SMC extinction curve is featureless, an intrinsically redder SED for BALQs cannot be excluded. The only support for the reddening interpretation is the remarkably good match, i.e., a ratio of unity for the dereddened spectra throughout the observed range, from 1000 to 3000 Å.
7 Conclusions
We analyse the average absorption properties of high- and low- samples of BALQs from the SDSS DR7, which cover the wavelength range of 800–3000 Å. The absorption properties are derived by taking the ratios of BALQ median spectra to the median spectra of matched samples of non-BALQs. We explore the absorption properties for a number of subsamples selected based on various emission properties. We find the following.
-
1.
No Lyman edge associated with the BAL absorbing gas is detected (). Thus, on average, for a partially ionized absorber in BALQs.
-
2.
The average absorption EW increases with the ionization state, from an absorption Å for C ii 1335, to 5.8 for Si iv, 9.3 for C iv, 24.6 for N v and 25.2 Å for O vi. This may indicate a rise in the covering factor of the BAL outflow with a rise in the ionization state.
-
3.
The He ii emission EW controls the typical of C iv BAL, which increases from km s-1 for Å to km s-1 for Å. The He ii EW does not affect the absorption depth. The He ii EW may indicate the strength of the EUV. A lower He ii EW then implies a lower ionization of the outflow, which allows the outflow to reach higher velocities before being overionized. One may not need to invoke a shield to prevent over-ionization of the outflow, as over-ionization may be taking place in high He ii EW objects, while in low He ii EW objects a shield may not be needed.
-
4.
The value of controls the C iv peak absorption depth, which increases from for to for , at km s-1. The value of does not affect the typical and the absorption profiles at km s-1. The value of may control the average inclination angle of the system, and thus the covering factor and absorbing column for a planar outflow, in particular at the lower velocities, which likely originate close to the base of the outflow.
-
5.
The He ii EW and also control the fraction of AGN which are BALQs. The fraction rises from per cent in blue () and strong He ii ( Å) AGN, to per cent in red () and weak He ii ( Å) AGN. Also, most of the LoBALQs ( per cent) have He ii Å. The He ii EW may control the global CF of the BAL outflow, as seen by the ionizing source, as a lower He ii EW allows the outflows to extend to larger scales before being overionized. On the other hand, may control the CF of absorbers along the line of sight, which increases with increasing inclination and the associated reddening.
-
6.
The median SED of BALQs is consistent with excess reddening of purely SMC dust with mag compared to non-BALQs, or a reddening of mag compared to the bluest non-BALQs. Given the lack of associated H i absorption, the dust is embedded in an ionized medium, possibly on the host-galaxy scale. LMC and MW dust are excluded by and 13 standard deviation of the median value, respectively.
The above interpretation of as a viewing angle indicator can be tested by looking for a trend between and the continuum polarization, in both BALQs and non-BALQs. One can also look for the expected relationship between and the X-ray absorbing column in BALQs. The relationships of and with the He ii EW, together with the inverse relationship of the He ii EW with , imply a steeper than linear rise in the kinetic wind luminosity with , which may be relevant for feedback in the highest AGN.
Acknowledgments
We thank G. T. Richards for many valuable comments. Fruitful discussions with N. Murray and E. Behar are acknowledged. We thank D. Kazanas and the anonymous referee for comments and suggestions. FH acknowledges support from the USA National Science Foundation grant AST-1009628. This research has made use of the Sloan Digital Sky Survey which is managed by the Astrophysical Research Consortium for the Participating Institutions; and of NASA’s Astrophysics Data System Bibliographic Services.
Appendix A The LoBALQ R spectrum
As a sidenote, we use this opportunity to briefly present the LoBALQ median absorption properties based on the low- BALQ sample. The LoBALQ spectrum is derived by forming a matched non-BALQ sample, which is matched by the He ii EW distribution. Although most of the LoBALQs have small values of He ii EW (the whole sample median EW is Å), several LoBALQs (13 out of 56) have somewhat larger He ii EW ( Å; Table 2), and the matching method used for HiBALQs (i.e., matching in the He ii EW range) cannot be utilized here. To produce LoBALQ and non-BALQ composites with a matched He ii EW distribution, we carry out the following procedure.
-
1.
The LoBALQ He ii EW distribution is calculated using 2 Å bins (EWbin). At each EWbin, the number of LoBALQs with He ii EW within the EWbin range is divided by the total number of LoBALQs.
-
2.
The non-BALQs are assigned to EWbin based on their He ii EW value. This yields the measured absolute non-BALQ distribution, .
-
3.
The LoBALQ distribution is multiplied by the total number of non-BALQs. This yields the desired absolute non-BALQ distribution, .
-
4.
The non-BALQs are drawn for each EWbin based on the following three criteria. If , then all non-BALQs in that EWbin are drawn. If , then all non-BALQs are randomly drawn several times until the number of drawn objects equals . If , then only of non-BALQs is randomly drawn.
-
5.
The median spectrum of the drawn non-BALQs is evaluated.
-
6.
The resulting median non-BALQ spectrum depends on the particular non-BALQs that are randomly drawn. To eliminate this dependence, the procedure in items (iv) and (v) is repeated 300 times. A median of the 300 median spectra is adopted as the matched non-BALQ composite.
The above procedure produces a matched non-BALQ sample with a median He ii EW of Å (compared to Å for LoBALQs). The LoBALQ and the matched non-BALQ composites have of and , respectively. The resulting C iv BAL EW, and are 33.9 Å, and km s-1, respectively.
Figure 13 presents the LoBALQ spectrum corrected for reddening (see below), where we also indicate the laboratory wavelength of Mg ii 2796.4, 2803.5, Al iii 1854.7, 1862.8 and several Fe ii absorption lines following Richards (2001, table 3 there). Note the presence of prominent Fe ii BALs in the LoBALQ spectrum (absorption Å). The LoBALQ C iv BAL profile is consistent with the relationships, which are found for the low- HiBALQ sample, between and the He ii EW, and between C iv peak absorption and (Sections 4.1 and 4.2, respectively). The LoBALQ composite has a redder and a deeper C iv peak absorption than the reddest HiBALQ bin ( versus ; compare to Fig. 8). The C iv BAL of LoBALQ composite is similar to of the lowest He ii EW HiBALQ bin (Fig. 13), although the LoBALQ median He ii EW is lower (0.9 versus Å). The similarity in may be a result of the softer ionizing SED (i.e., lower He ii EW for LoBALQs) being ‘too soft’ to produce a C iv absorber at higher . The higher absorber is probably found at larger distances from the ionizing source than a lower absorber, and the soft ionizing SED at those distances results in an ionization parameter that is too low to produce C iv absorption.
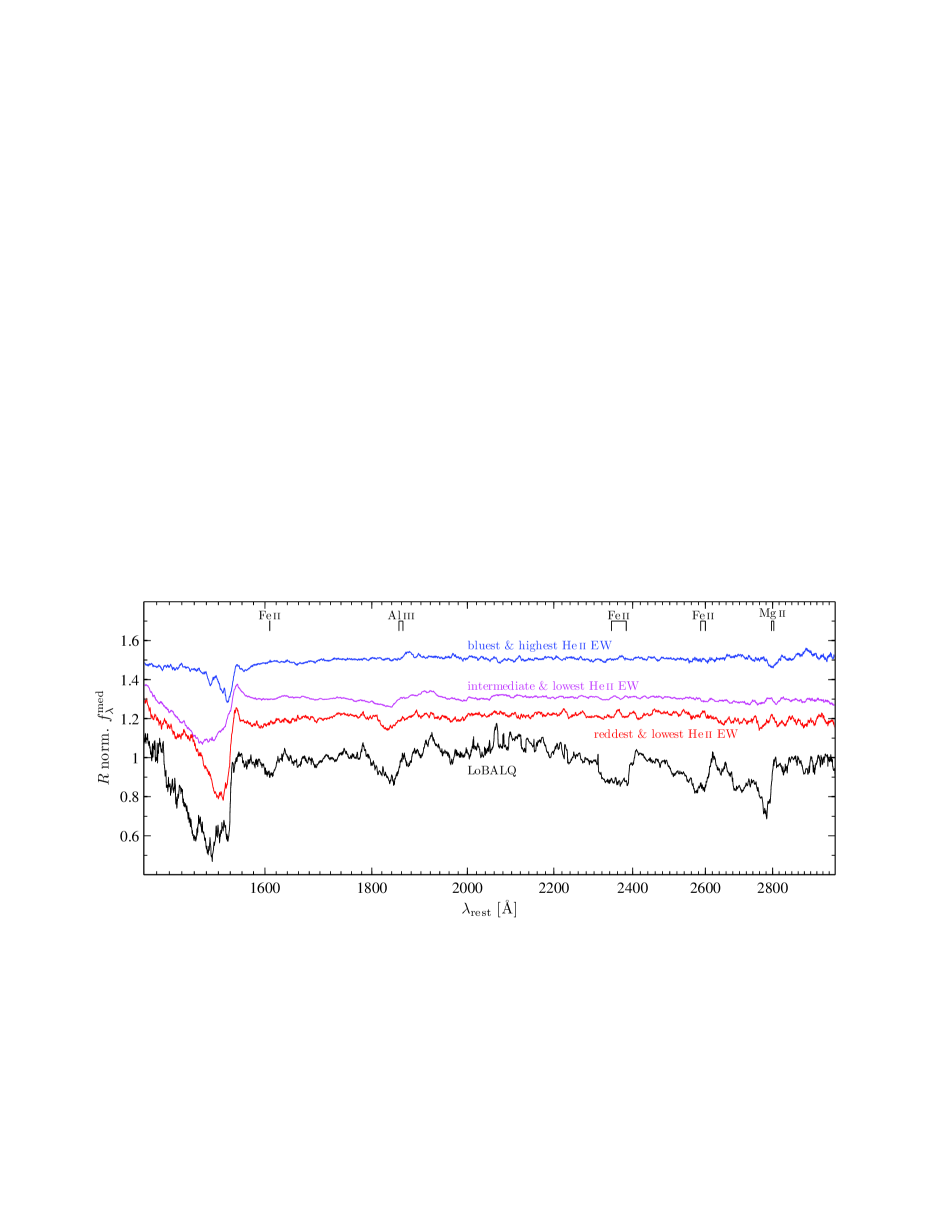
A comparison between LoBALQ and HiBALQ composites supports the scenario of a smooth transition between HiBALQs and LoBALQs, where the latter mostly occupy the reddest and the lowest He ii EW parameter-space (Section 4.3). Figure 13 presents the bluest and highest He ii EW composite, the lowest He ii EW composite (Fig. 6) corrected for reddening (Section 6), and the reddest and lowest He ii EW composite. The first composite has EW = 6.1 Å and (Table 5), and its spectrum has no detectable Al iii and Mg ii BALs. The dip at Mg ii laboratory wavelength results from a mismatch in Mg ii peak line emission between the matched BALQs and non-BALQs, and likely does not indicate true absorption. The second composite has EW = 0.9 Å and (Table 2), and has a marginal Al iii BAL and non-detectable Mg ii BAL. The third composite has a He ii EW = Å and (Table 5), and its spectrum has a prominent Al iii BAL and a marginal Mg ii BAL. There are additional evidence of Al iii BAL strength dependence on both He ii EW and . HiBALQ binning based on He ii EW () produces composites with similar (He ii EW), but with different Al iii BAL strength (Figs. 6 and 8). Note that the spectrum in the Mg ii region in Figs. 6 and 8 is dominated by a mismatch in the Mg ii peak line-emission, which hinders a detection of any weak Mg ii BAL. The Al iii BAL appears first, as the ionization parameter becomes lower, since Mg ii ions are destroyed by 15 eV photons, while Al iii ions are produced by 19 eV photons. As the HiBALQ properties (i.e., He ii EW and ) start to resemble those of LoBALQs, low ionization BALs begin to appear in the HiBALQ spectrum, and it becomes more similar to the LoBALQ spectrum. This suggests LoBALQs are the extreme high inclination and soft ionizing SED members of the BALQ population, rather than a distinct population of AGN.
The reddening of the LoBALQ spectrum is consistent with an SMC dust extinction of mag i.e., . This reddening is similar to reported by Reichard et al. (2003) for the SDSS early DR, but is smaller than reported by Gibson et al. (2009) for the DR5, where in both studies the reddening is derived by comparing the LoBALQ composite to a composite of the whole non-BALQ sample. If the whole non-BALQ sample, rather than the He ii EW matched one, is utilized to calculate the LoBALQ spectrum, then the Gibson et al. (2009) result is approximately recovered i.e., mag.
Appendix B Tentative evidence for radiation pressure driving
Figure 14 presents tentative evidence that the C iv BAL absorber is driven by radiation pressure. The low- sample is divided into 44 bins based on the He ii EW and . The BALQ sample is first divided into four He ii EW ‘parent’ bins, and matched non-BALQ bins are constructed (same procedure as in Fig. 6). Then, each He ii EW parent bin is divided into four bins, with matching non-BALQs from the corresponding He ii EW non-BALQ bin. Each BALQ bin contains by construction equal number of objects () for all ‘parent’ bins. If the BAL outflow is driven by radiation pressure, then is an increasing function of the force multiplier and luminosity , assuming the outflow launching radius is mainly a function of (e.g., Laor & Brandt 2002; see also Section 5). is mostly set by the SED, and keeping the He ii EW constant should also keep approximately constant i.e., each panel of Fig. 14 groups objects with a similar . The range in of our sample is too small ( dex) to produce highly significant differences in between bins for a given He ii EW (i.e., ). However, note that for the weakest two He ii EW bins (Fig. 14, two lower panels), the highest bin reaches larger than the other three bins. This larger for a larger is expected, if the BAL outflow is driven by radiation pressure (e.g., Proga, Stone & Drew 1998).
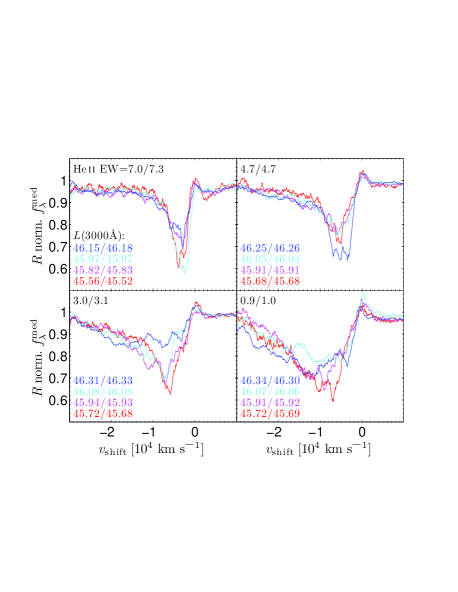
The highest He ii EW bin shows very similar as a function of . Here the peak absorption occurs at km s-1, and the absorbing material may still be confined close to the BLR, i.e. to the base of the outflow. Overionization occurs just as the outflow starts to build up, before radiation pressure has time to build up a significant outflow component, beyond the initial dispersion in the velocity. Only when the He ii EW is low enough, to allow significant acceleration, the effect of starts to appear. Clearly, large samples which span a large range in (e.g. Laor & Brandt 2002), are needed to explore the radiation pressure interpretation, and clearly separate out the effect of and the He ii EW on the outflow.
References
- Allen et al. (2011) Allen J. T., Hewett P. C., Maddox N., Richards G. T., Belokurov V., 2011, MNRAS, 410, 860
- Baskin & Laor (2005) Baskin A., Laor A., 2005, MNRAS, 356, 1029
- Baskin & Laor (2012) Baskin A., Laor A., 2012, MNRAS, 426, 1144
- Becker et al. (2000) Becker R. H., White R. L., Gregg M. D., Brotherton M. S., Laurent-Muehleisen S. A., Arav N., 2000, ApJ, 538, 72
- Bentz et al. (2009) Bentz M. C., Peterson B. M., Netzer H., Pogge R. W., Vestergaard M., 2009, ApJ, 697, 160
- Boroson (2002) Boroson T. A., 2002, ApJ, 565, 78
- Boroson & Green (1992) Boroson T. A., Green R. F., 1992, ApJS, 80, 109
- Boroson & Meyers (1992) Boroson T. A., Meyers K. A., 1992, ApJ, 397, 442
- Brandt et al. (2000) Brandt W. N., Laor A., Wills B. J., 2000, ApJ, 528, 637
- Capellupo et al. (2011) Capellupo D. M., Hamann F., Shields J. C., Rodríguez Hidalgo P., Barlow T. A., 2011, MNRAS, 413, 908
- Capellupo et al. (2012) Capellupo D. M., Hamann F., Shields J. C., Rodríguez Hidalgo P., Barlow T. A., 2012, MNRAS, 422, 3249
- Cardelli et al. (1989) Cardelli J. A., Clayton G. C., Mathis J. S., 1989, ApJ, 345, 245
- Davis & Laor (2011) Davis S. W., Laor A., 2011, ApJ, 728, 98
- Draine (2011) Draine B. T., 2011, Physics of the Interstellar and Intergalactic Medium. Princeton Univ. Press, Princeton, NJ
- Dunn et al. (2012) Dunn J. P., Arav N., Aoki K., Wilkins A., Laughlin C., Edmonds D., Bautista M., 2012, ApJ, 750, 143
- Elvis (2000) Elvis M., 2000, ApJ, 545, 63
- Farrah et al. (2010) Farrah D., Urrutia T., Lacy M., Lebouteiller V., Spoon, H. W. W., Bernard-Salas J., Connolly N., Afonso J., Connolly B., Houck J., 2010, ApJ, 717, 868
- Farrah et al. (2012) Farrah D. et al., 2012, ApJ, 745, 178
- Fukumura et al. (2010a) Fukumura K., Kazanas D., Contopoulos I., Behar E., 2010a, ApJ, 715, 636
- Fukumura et al. (2010b) Fukumura K., Kazanas D., Contopoulos I., Behar E., 2010b, ApJ, 723, L228
- Gibson et al. (2009) Gibson R. R. et al., 2009, ApJ, 692, 758
- Giustini & Proga (2012) Giustini M., Proga D., 2012, ApJ, 758, 70
- Glikman et al. (2012) Glikman E. et al., 2012, ApJ, 757, 51
- Gordon et al. (2003) Gordon K. D., Clayton G. C., Misselt K. A., Landolt A. U., Wolff M. J., 2003, ApJ, 594, 279
- Gordon et al. (2009) Gordon K. D., Cartledge S., Clayton G. C., 2009, ApJ, 705, 1320
- Hamann et al. (1993) Hamann F., Korista K. T., Morris, S. L., 1993, ApJ, 415, 541
- Hewett & Foltz (2003) Hewett P. C., Foltz C. B., 2003, AJ, 125, 1784
- Hewett & Wild (2010) Hewett P. C., Wild V., 2010, MNRAS, 405, 2302
- Hopkins et al. (2004) Hopkins P. F. et al., 2004, AJ, 128, 1112
- Just et al. (2007) Just D. W., Brandt W. N., Shemmer O., Steffen A. T., Schneider D. P., Chartas G., Garmire G. P., 2007, ApJ, 665, 1004
- Knigge et al. (2008) Knigge C., Scaringi S., Goad M. R., Cottis C. E., 2008, MNRAS, 386, 1426
- Krolik (2001) Krolik J. H., 2001, ApJ, 551, 72
- Kruczek et al. (2011) Kruczek N. E., Richards G. T., Gallagher S. C., Deo R. P., Hall P. B., Hewett P. C., Leighly K. M., Krawczyk C. M., Proga D., 2011, AJ, 142, 130
- Laor (1998) Laor A., 1998, ApJ, 505, L83
- Laor & Brandt (2002) Laor A., Brandt W. N., 2002, ApJ, 569, 641
- Laor et al. (1997) Laor A., Fiore F., Elvis M., Wilkes B. J., McDowell J. C., 1997, ApJ, 477, 93
- Lazarova et al. (2012) Lazarova M. S., Canalizo G., Lacy M., Sajina A., 2012, ApJ, 755, 29
- Leighly & Moore (2004) Leighly K. M., Moore J. R., 2004, ApJ, 611, 107
- Maddox et al. (2008) Maddox N., Hewett P. C., Warren S. J., Croom S. M., 2008, MNRAS, 386, 1605
- Murray et al. (1995) Murray N., Chiang J., Grossman S. A., Voit G. M., 1995, ApJ, 451, 498
- Ogle et al. (1999) Ogle P. M., Cohen M. H., Miller J. S., Tran H. D., Goodrich R. W., Martel A. R., 1999, ApJS, 125, 1
- Osterbrock (1989) Osterbrock D. E., 1989, Astrophysics of gaseous nebulae and active galactic nuclei. Univ. Science Books, Mill Valley, CA
- Peterson (1997) Peterson, B. M., 1997, An Introduction to Active Galactic Nuclei. Cambridge Univ. Press, Cambridge, UK
- Pitman et al. (2000) Pitman K. M., Clayton G. C., Gordon K. D., 2000, PASP, 112, 537
- Proga et al. (1998) Proga D., Stone J. M., Drew J. E., 1998, MNRAS, 295, 595
- Proga et al. (2000) Proga D., Stone J. M., Kallman T. R., 2000, ApJ, 543, 686
- Reichard et al. (2003) Reichard T. A., Richards G. T., Hall P. B., Schneider D. P., Vanden Berk D. E., Fan X., York D. G., Knapp G. R., Brinkmann, J., 2003, AJ, 126, 2594
- Richards (2001) Richards G. T., 2001, ApJS, 133, 53
- Richards (2012) Richards G. T., 2012, in Chartas G., Hamann F., Leighly K. M., eds, ASP Conf. Ser. Vol. 460, AGN Winds in Charleston. Astron. Soc. Pac., San Francisco, p. 67
- Richards et al. (2002) Richards G. T., Vanden Berk D. E., Reichard T. A., Hall P. B., Schneider D. P., SubbaRao M., Thakar A. R., York D. G., 2002, AJ, 124, 1
- Richards et al. (2003) Richards G. T. et al., 2003, AJ, 126, 1131
- Richards et al. (2011) Richards G. T., Kruczek N. E., Gallagher S. C., Hall P. B., Hewett P. C., Leighly K. M., Deo R. P.; Kratzer R. M., Shen Y., 2011, AJ, 141, 167
- Schneider et al. (2010) Schneider D. P. et al., 2010, AJ, 139, 2360
- Scott et al. (2004) Scott J. E., Kriss G. A., Brotherton M., Green R. F., Hutchings J., Shull J. M., Zheng W., 2004, ApJ, 615, 135
- Shen et al. (2008) Shen Y., Greene J. E., Strauss M. A., Richards G. T., Schneider D P., 2008, ApJ, 680, 169
- Shen et al. (2011) Shen Y. et al., 2011, ApJS, 194, 45
- Shull et al. (2012) Shull J. M., Stevans M., Danforth C. W., 2012, ApJ, 752, 162
- Sprayberry & Foltz (1992) Sprayberry D., Foltz C. B., 1992, ApJ, 390, 39
- Steffen et al. (2006) Steffen A. T., Strateva I., Brandt W. N., Alexander D. M., Koekemoer A. M., Lehmer B. D., Schneider D. P., Vignali C., 2006, AJ, 131, 2826
- Stern & Laor (2012) Stern J., Laor A., 2012, MNRAS, 423, 600
- Stocke et al. (1992) Stocke J. T., Morris S. L., W R. J., Foltz C. B., 1992, ApJ, 396, 487
- Strateva et al. (2005) Strateva I. V., Brandt W. N., Schneider D. P., Vanden Berk D. G., Vignali C., 2005, AJ, 130, 387
- Telfer et al. (2002) Telfer R. C., Zheng W., Kriss G. A., Davidsen A. F., 2002, ApJ, 565, 773
- Trump et al. (2006) Trump J. R. et al., 2006, ApJS, 165, 1
- Urrutia et al. (2009) Urrutia T., Becker R. H., White R. L., Glikman E., Lacy M., Hodge J., Gregg M. D., 2009, ApJ, 698, 1095
- Vestergaard & Osmer (2009) Vestergaard M., Osmer P. S., 2009, ApJ, 699, 800
- Voit et al. (1993) Voit G. M., Weymann R. J., Korista K. T., 1993, ApJ, 413, 95
- Weymann et al. (1981) Weymann R. J., Carswell R. F., Smith M. G., 1981, ARA&A, 19, 41
- Weymann et al. (1991) Weymann R. J., Morris S. L., Foltz C. B., Hewett P. C., 1991, ApJ, 373, 23
- Woo et al. (2010) Woo J.-H., Treu T., Barth A. J., Wright S. A., Walsh J. L., Bentz M. C., Martini P., Bennert V. N., Canalizo G., Filippenko A. V., Gates E., Greene J., Li W., Malkan M. A., Stern D., Minezaki T., 2010, ApJ, 716, 269
- York et al. (2000) York D. G. et al. 2000, AJ, 120, 1579
- Zheng et al. (1997) Zheng W., Kriss G. A., Telfer R. C., Grimes J. P., Davidsen A. F., 1997, ApJ, 475, 469