X-ray spectral cut-off and the lack of hard X-ray emission from two ultraluminous X-ray sources M81 X–6 and Holmberg IX X–1
Abstract
We present broadband X-ray spectral study of two ultraluminous X-ray sources (ULXs), M81 X–6 and Holmberg IX X-1 based on Suzaku & XMM-Newton observations. We perform joint broadband spectral analysis of the brightest sources in the field, i.e. the two ULXs and the active galactic nucleus (AGN) in M81, and demonstrate that the X-ray spectra of the ULXs cut off at energies with negligible contribution at high energies in the Suzaku HXD/PIN band. The upper limit on the band luminosity of an underlying broadband power-law component is for M81 X–6 and for Holmberg IX X–1. These limits are more than an order of magnitude lower than the bolometric () luminosity of for M81 X–6 and for Holmberg IX X–1. Our results confirm earlier indications of spectral cut-offs inferred from the XMM-Newton observations of bright ULXs and show that there isn’t an additional high energy power-law component contributing significantly to the X-ray emission. The spectral form of the two ULXs are very different from those of Galactic black hole X-ray binaries (BHBs) or AGNs. This implies that the ULXs are neither simply scaled-up versions of stellar mass BHBs or scaled-down versions of AGNs.
Subject headings:
accretion, accretion disks — X-rays: binaries — X-rays: galaxies — X-rays: individual (M81 X-6, Holmberg IX X–1)1. Introduction
Generally galaxies host numerous X-ray sources. Most off-nuclear, compact X-ray sources are believed to be X-ray binaries (XRBs) with a compact object – white dwarf, neutron star or a black hole. A few of the brightest X-ray sources at the high end of the point source luminosity function can exceed the Eddington limit of even the most massive stellar mass black hole, sometimes by large factors. The nature of these sources, known as the ultra-luminous X-ray sources (ULXs), continues to remain an enigma since their dynamical mass measurements have not been possible.
Possible explanations for the high luminosities of ULXs include () X-ray binaries with intermediate mass () black holes (IMBH) (e.g., Colbert & Mushotzky, 1999; Miller & Colbert, 2004), () X-ray binaries with anisotropic emission (King et al., 2001), () beamed XRBs with relativistic jets directly pointing towards us i. e., scaled down versions of blazars (Mirabel & Rodríguez, 1999; Körding et al., 2002), and () XRBs with super-Eddington accretion rates (Begelman, 2001, 2002). Chandra and XMM-Newton observations of ULXs have shown a variety of spectral shapes e.g., simple powerlaw similar to the low/hard state of BHBs (Winter et al., 2006) and soft excess (blackbody ) plus powerlaw component. The soft X-ray excess emission has been interpreted as optically thick emission from a thin accretion disk with temperatures in the range of , suggestive of an IMBH accreting at sub-Eddington () rates (Miller et al., 2003, 2004b, 2004a; Miller & Colbert, 2004; Fabian et al., 2004). However, the cool disk plus powerlaw spectra of ULXs may not always correspond to the high/soft state of BHBs (Roberts et al., 2005). High S/N XMM-Newton observations of bright ULXs has revealed curvature or cut-offs in the spectra at high energies (Stobbart et al., 2006; Dewangan et al., 2006; Agrawal & Misra, 2006; Gladstone & Roberts, 2009). However, it is not known if the X-ray spectrum actually has a cut-off or there is a deficit of emission near due to perhaps an absorption edge. Observation of strong X-ray emission above will put strong constraints on the nature of ULXs. The presence of a strong hard X-ray powerlaw will establish ULXs to be either scaled-up BHBs or scaled-down versions of AGNs and the lack of emission near may then be explained as the blurred iron K-edge due to Compton reflection arising from regions very close to a black hole. On the other hand, absence of such a strong hard X-ray component will make ULXs very different from BHBs or AGNs, probably accreting in a state that is not usually attained by them.
Suzaku observations have shown that the broadband spectrum of M82 X–1 is slightly curved (Miyawaki et al., 2009). However, M 82 X–1 is in a crowded field and it is not clear if the contribution of nearby multiple unresolved sources both in the XIS and PIN FOV can alter the broadband spectral shape. Here we study the broadband spectral shape of two bright ULXs M81 X–6 and Holmberg IX X–1 (Ho IX X–1) located in the dwarf irregular galaxy Holmberg IX, a companion of M81. Ho IX X–1 is also known as M81 X–9. We constrain the spectral shape of the two ULXs for the first time based on joint spectral modeling of multiple sources observed with Suzaku.
2. Observations and Data Reduction
We used the onaxis Suzaku observations of M81 (observation ID: 906004010) and Holmberg IX X–1 (observation ID: 707019010) performed during 15–16 September 2011 and 13–17 April 2012 for exposure times of and , respectively. We also used XMM-Newton observation of Holmberg IX X–1 performed during 26-27 September 2004 for an exposure time of (observation ID : 0200980101).
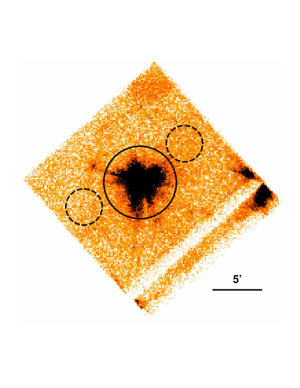
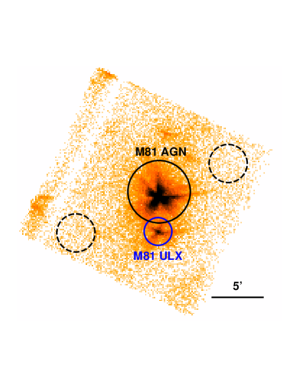
We processed the unfiltered Suzaku data with aepipeline available with HEASOFT version 6.13 and used the recent calibration database (CALDB) available as of 20 January 2013. We extracted the spectra of Ho IX X–1 from the filtered XIS event lists using a circular region of radius , and the corresponding background spectra from two circular regions each with radius . The ULX M81 X–6 is away from the AGN. Therefore, we extracted the XIS spectra for M81 AGN and M81 X–6 using smaller circular regions of radii and , respectively. We extracted common background spectra applicable to both AGN and ULX using two circular regions of radius each. The circular extraction regions used to extract the spectral products are shown in Figure 1. The XIS0 and XIS3 are the front illuminated (FI) CCDs and the two spectra for each object were combined using the tool addascaspec. We also extracted the HXD/PIN source and background spectra from both the observations using the task hxdpinxbpi from the PIN event lists and the tuned non X-ray background files appropriate for the observations.
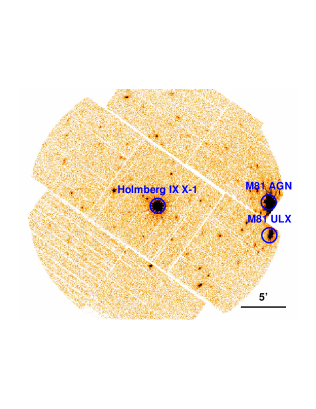
Since the HXD/PIN is a non-imaging instrument with a field of view (FOV) of FWHM, there may be contribution from sources within the FOV. To identify the potential contaminating sources, we analyzed the XMM-Newton observation of Ho IX X01. We processed the EPIC-pn and MOS data in a standard manner. We show the MOS image of the field containing Ho IX X-1 in Figure 1. In the MOS FOV of diameter, apart from Ho IX X-1., there are two bright sources, M81 AGN and ULX M81 X–6 which can contribute to the PIN spectrum.
| Comp. | Par. | AGN+M81ULX | AGN+Ho IX X–1 | |
|---|---|---|---|---|
| Model 1 | Model 2 | Model 3 | ||
| Abs. | (fixed) | (fixed) | (fixed) | |
| PL | ||||
| GL | (keV) | |||
| (eV) | ||||
| bbody | (eV) | – | – | |
| diskbb | (eV) | – | – | |
| Cutoff PL | – | |||
| (keV) | – | |||
| – | ||||
| nthcomp | – | – | ||
| (keV) | – | – | ||
| (eV) | – | – | ||
| GL | (keV) | – | ||
| (eV) | – | (fixed) | ||
| – | ||||
| 418.4/435 | 509/517 | 519/517 | ||
(a) Model 1: AGN (wabs(PL+GL(1))) + ULX (wabscutoffpl); Model 2: AGN (wabs(PL+GL(1))) + ULX (wabs(bbody + cutoffpl + GL(2)); Model 3: AGN (wabs(PL+GL(1))) + ULX (wabs(diskbb + nthcomp + GL(2)). (b) Galactic column in units of . (c) Normalization in at . (d) Line flux in . (e) Normalization of cutoff PL in at .
3. Analysis & Results
We begin with the spectral analysis of the Suzaku observation of M 81. While the AGN and the ULX are clearly resolved in the XIS data, the PIN data is additionally contaminated by the nearby bright ULX Ho IX X–1. Other sources seen in the XMM-Newton MOS image are too faint to contribute to the PIN spectrum. We fitted an absorbed powerlaw model to the PIN and the AGN XIS data. We used the the band PIN data (as there is no detection above ) and the XIS band data which excludes the low energy thermal emission of the AGN (Page et al., 2003). M 81 AGN is known to show an iron line (Dewangan et al., 2004) and therefore we also used a Gaussian line. This simple model resulted in a good fit, for degrees of freedom (dof). To find any contribution from the nearby bright ULXs to the HXD/PIN, we included an additional power-law component. We fixed the normalization of the second powerlaw component to zero for the XIS and varied it for the PIN data. This did not improve the fit and hence we calculated upper-limit on the flux by fixing the photon index at different values ranging from 1 to 2.5. We find that the maximum possible contribution by the nearby ULXs is in the band.
To estimate the hard X-ray contribution from the ULXs, we fitted the XIS spectra of Ho IX X–1 and M81 X–6 with absorbed power-law models and calculated the band fluxes by extrapolating the best-fit models. We found () for Ho IX X–1 and for M81 X–6. Thus, the estimated fluxes for the ULXs based on the extension of the simple power-law models are much higher than the upper-limit on the contribution by the nearby sources to the HXD/PIN data. This implies that the ULXs lack significant hard X-ray emission and their spectra cannot be described by a single power-law from soft-to-hard X-rays. This confirms the earlier results of a high energy cutoff in the XMM-Newton spectra of these ULXs (Dewangan et al., 2006; Stobbart et al., 2006).
To better constrain the broadband X-ray spectral shapes of the ULXs, we performed joint spectral analysis of the Suzaku XIS+PIN spectra of the ULXs and the AGN. For this purpose, we created ISIS fit functions which are a combination of models for the ULXs and the AGN but a given model component is applied to a specific spectrum or a subset of spectra. First we fit the spectra obtained from the onaxis Suzaku observation of the M81 AGN. We used the combined XIS FI spectra of the M81 ULX and the AGN and the corresponding HXD/PIN spectrum of the field. We did not use XIS spectrum of Ho IX X–1 as it is not in the field of view. We also did not account for its contribution to the PN spectrum. This ULX is away from the AGN in M81. Thus, given the triangular response of HXD/PIN with an FWHM of , the ULX contributes of its actual flux to the PIN data. As inferred above, Ho IX X–1 generally lacks the hard X-ray emission and its contribution to the PIN band is likely to be very small. We further deal with this issue below when we analyze the on-axis Suzaku observation of Ho IX X–1.
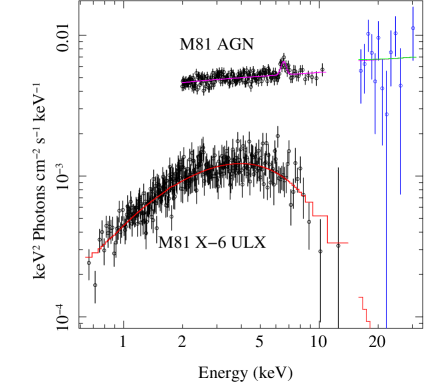
For the joint spectral analysis of the M81 ULX and the AGN spectra, we used a joint model which is a combination of the model for the ULX (wabs(cutoffpl + gauss)) and the AGN (wabs(powerlaw + gauss)). We refer to this as model 1. The ULX model only is applied to XIS spectrum of M81 X–6 and the AGN model alone applied to the XIS spectrum of the AGN but both models are combined to fit to the PIN data. As before, we excluded XIS data below for the AGN only and used a constant multiplicative factor of for the PIN data. The model provided a statistically acceptable fit with and the best-fit parameters are listed in in Table 1 while the unfolded spectral data and the best-fit model are shown in Figure 2. We also examined the continuation of the powerlaw in the hard band by fixing at . The fit became worse with , ruling out the presence of such a powerlaw. Further, we added an additional powerlaw component with to the best-fit ULX model 1 and estimated the upper-limit on the flux to be and the corresponding luminosity for an underlying power-law component. We also tested physical models that do not contribute significantly in the hard X-ray band. We replaced the cutoffpl in model 1 with the standard disk model diskbb which resulted in a good fit () with , . We also tested the p-free disk model diskpbb which allows the disk temperature to scale with radius as . For standard disk model, and lower values of may indicate a slim accretion disk (Watarai et al., 2000). The p-free disk model resulted in a slightly better fit () with , and and . The parameters of the AGN model components remained similar for different ULX models cutoffpl, diskbb and the p-free disk. Thus, we confirm that the M81 X–6 spectrum cuts-off at high energies and does not contribute significantly to the HXD/PIN band. Moreover, any possible hard X-ray contribution by the ULX Ho IX X–1 (which we show below is unlikely) would further strengthen the result that M81 X–6 is dim in hard X-rays.
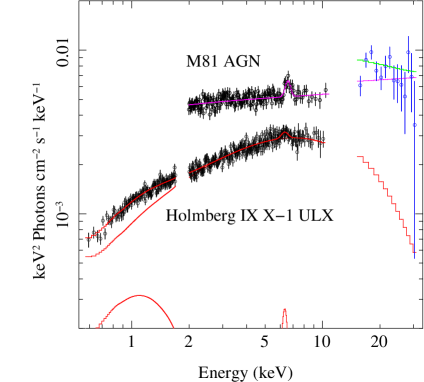
We next perform the joint spectral analysis of the onaxis Suzaku observation of Ho IX X–1. The ULX is well isolated spatially and its X-ray emission in the XIS band is not contaminated by any other strong source (see Fig. 1). However, the PIN data is obviously contaminated by the AGN in M81. We used a joint spectral model similar to the model 1 that combines the ULX model (wabs(bbody + cutoffpl + gauss) and the AGN model (wabs (powerlaw + gauss)). We refer this as model 2. As before we used a relative normalization of between the XIS spectrum of Ho IX X–1 and its contribution to the PIN spectrum. Since there is no simultaneous XIS spectrum of the AGN, we used the AGN XIS spectrum from the onaxis observation of M81. We used a variable relative normalization between the XIS spectrum of the AGN and its contribution to the PIN band to allow for flux variability of the AGN between the two Suzaku observation. Thus, the use of the XIS AGN spectrum in modeling the ULX spectrum is equivalent to assuming that the AGN did not change its spectral shape. This is justified as the spectral shape of M81 AGN is known to show very little variability if at all (Ishisaki et al., 1996). As before we excluded the XIS spectrum of AGN below . The joint fit resulted in a statistically acceptable fit (). The best-fit parameters are listed in Table 1 while The unfolded spectrum and the best-fit models for the ULX and AGN are shown in Figure 2. The best-fit parameters for the AGN were similar to that obtained earlier (see Table 1). As expected from the earlier analysis, the spectrum of Ho IX X–1 cuts-off and makes very little contribution to the HXD/PIN band. A weak iron line is detected for for two additional parameters i.e., at a significance level of according to the F-test. The line width was not well constrained, therefore was fixed at its best-fit value. Such a weak iron line was not detected in the long XMM-Newton observation (Dewangan et al., 2006) and is most likely associated with the host galaxy. The relative normalization for the AGN contribution to the PIN data is . Fixing the value to does not change the cutoff energy for the ULX and hence uncertainties in the AGN flux does not effect the overall result. We further tested the reality of the spectral cut-off of Ho IX X–1 by fixing the cutoff energy at . This resulted in a poor fit ( for the loss of only one parameter). Thus, the presence of spectral cut-off is highly significant. As before, we estimated upper limit on the flux of an underlying powerlaw component to be and the corresponding luminosity to be . We also tested the thermal Comptonization model by replacing the cutoffpl in model 2 with the nthcomp and bbody with the diskbb component (model 3), the joint fit resulted in ) with . In this fit, we treated the diskbb component with to be the seed photon source for the Comptonization. We calculated the flux of the diskbb and nthcomp components to be and , respectively.
4. Discussion
Using the broadband Suzaku observations of the fields containing two bright ULXs, we measured X-ray luminosities of for M81 X–6 and for Ho IX X–1. With the joint spectral analysis of XIS and PIN spectra of the brightest sources in the field, we showed that the broadband spectra of M81 X–6 and Ho IX X–1 cutoff at and , respectively. This conforms the high energy spectral curvature in these ULXs earlier found with the limited bandpass of XMM-Newton (Dewangan et al., 2006; Stobbart et al., 2006). In addition, we do not find additional high energy spectral components similar to that observed from BHBs and AGNs. This demonstrates clearly that the two ULXs are in unusual spectral states that are distinctly different than that observed from BHBs and AGNs.
The spectrum of M81 X–6 is well described by the standard disk model with high temperature similar to that observed from BHBs but the inferred X-ray luminosity exceeds the Eddington luminosity of black hole. Generally BHBs show standard disk spectra in their high/soft state with the relative accretion rate in the range of (Esin et al., 1997). Thus, the observed X-ray luminosity of M81 X–6 will correspond to . The temperature of the standard disk around such a large black hole is unlikely to exceed . Thus, M81 X–6 is not in the high/soft state generally observed in BHBs. The p-free disk fit showed that the temperature of disk () at different radii is lower than that expected from a standard disk (). This suggests that the ULX M81 X–6 likely hosts a slim accretion disk.
We confirmed the soft excess from Ho IX X–1 and showed that the spectral downturn near earlier observed with XMM-Newton continues in the hard X-ray band above . The soft excess and the spectral turnover is well described by a standard cool disk and cool Comptonization as found earlier (Dewangan et al., 2006; Stobbart et al., 2006). Based on the spectral analysis of high quality X-ray spectra of ULXs observed with XMM-Newton, Gladstone & Roberts (2009) showed that most ULX spectra are best described by an outer cool disk and optically thick, cool Comptonization. They termed such a spectral form as the ultraluminous state which is thought to represent spectral transition between Eddington and super-Eddington accretion flows. It is interesting to note that the luminosity of the soft excess component, described as diskbb, is corresponding to relative accretion of for a black hole. Thus, if there is mild beaming of the Comptonized component, a stellar mass black hole can explain the observed luminosity of Ho IX X–1.
Finally, we note that while many BHBs and AGNs show strong relativistically broadened iron line, we are yet to observe such lines from any ULX. Caballero-García & Fabian (2010) explained the soft excess and drop near in the spectra of several ULX including M81 X–6 and Ho IX X–1 in terms of relativistically blurred Compton reflection from accretion disks. Such a model requires strong continuum above . However, our finding of the spectral downturn and its continuation in the hard band above in Ho X–1 and M81 X–6 imply the absence of a strong illuminating continuum. Thus, our findings rule out the possibility of explaining the spectral downturn near as a blurred iron K-edge. The absence of a strong illuminating continuum is most likely the reason behind the non-detection of relativistically broadened iron lines from ULXs.
References
- Agrawal & Misra (2006) Agrawal, V. K. & Misra, R. 2006, ApJ, 638, L83
- Begelman (2001) Begelman, M. C. 2001, ApJ, 551, 897
- Begelman (2002) —. 2002, ApJ, 568, L97
- Caballero-García & Fabian (2010) Caballero-García, M. D. & Fabian, A. C. 2010, MNRAS, 402, 2559
- Colbert & Mushotzky (1999) Colbert, E. J. M. & Mushotzky, R. F. 1999, ApJ, 519, 89
- Dewangan et al. (2004) Dewangan, G. C., Griffiths, R. E., Di Matteo, T., & Schurch, N. J. 2004, ApJ, 607, 788
- Dewangan et al. (2006) Dewangan, G. C., Griffiths, R. E., & Rao, A. R. 2006, ApJ, 641, L125
- Esin et al. (1997) Esin, A. A., McClintock, J. E., & Narayan, R. 1997, ApJ, 489, 865
- Fabian et al. (2004) Fabian, A. C., Ross, R. R., & Miller, J. M. 2004, MNRAS, 355, 359
- Gladstone & Roberts (2009) Gladstone, J. C. & Roberts, T. P. 2009, MNRAS, 397, 124
- Ishisaki et al. (1996) Ishisaki, Y., Makishima, K., Iyomoto, N., Hayashida, K., Inoue, H., Mitsuda, K., Tanaka, Y., Uno, S., Kohmura, Y., Mushotzky, R. F., Petre, R., Serlemitsos, P. J., & Terashima, Y. 1996, PASJ, 48, 237
- King et al. (2001) King, A. R., Davies, M. B., Ward, M. J., Fabbiano, G., & Elvis, M. 2001, ApJ, 552, L109
- Körding et al. (2002) Körding, E., Falcke, H., & Markoff, S. 2002, A&A, 382, L13
- Miller et al. (2003) Miller, J. M., Fabbiano, G., Miller, M. C., & Fabian, A. C. 2003, ApJ, 585, L37
- Miller et al. (2004a) Miller, J. M., Fabian, A. C., & Miller, M. C. 2004a, ApJ, 614, L117
- Miller et al. (2004b) —. 2004b, ApJ, 607, 931
- Miller & Colbert (2004) Miller, M. C. & Colbert, E. J. M. 2004, International Journal of Modern Physics D, 13, 1
- Mirabel & Rodríguez (1999) Mirabel, I. F. & Rodríguez, L. F. 1999, ARA&A, 37, 409
- Miyawaki et al. (2009) Miyawaki, R., Makishima, K., Yamada, S., Gandhi, P., Mizuno, T., Kubota, A., Tsuru, T. G., & Matsumoto, H. 2009, PASJ, 61, 263
- Page et al. (2003) Page, M. J., Breeveld, A. A., Soria, R., Wu, K., Branduardi-Raymont, G., Mason, K. O., Starling, R. L. C., & Zane, S. 2003, A&A, 400, 145
- Roberts et al. (2005) Roberts, T. P., Warwick, R. S., Ward, M. J., Goad, M. R., & Jenkins, L. P. 2005, MNRAS, 357, 1363
- Stobbart et al. (2006) Stobbart, A.-M., Roberts, T. P., & Wilms, J. 2006, MNRAS, 368, 397
- Watarai et al. (2000) Watarai, K.-y., Fukue, J., Takeuchi, M., & Mineshige, S. 2000, PASJ, 52, 133
- Winter et al. (2006) Winter, L. M., Mushotzky, R. F., & Reynolds, C. S. 2006, ApJ, 649, 730