202–209
Radio polarization observations of large supernova remnants at 6 cm
Abstract
We have observed 79 supernova remnants (SNRs) with the Urumqi 25 m telescope at 6 cm during the Sino-German 6 cm polarization survey of the Galactic plane. We measured flux densities of SNRs at 6 cm, some of which are the first ever measured or the measurements at the highest frequency, so that we can determine or improve spectra of SNRs. Our observations have ruled out spectral breaks or spectral flattening that were suggested for a few SNRs, and confirmed the spectral break of S147. By combining our 6 cm maps with 11 cm and 21 cm maps from the Effelsberg 100 m telescope, we calculated the spectral index maps of several large SNRs. For many remnants we obtained for the first time polarization images, which show the intrinsic magnetic field structures at 6 cm. We disapproved three objects as being SNRs, OA184, G192.81.1 and G16.81.1, which show a thermal spectrum and no polarization. We have discovered two large supernova remnants, G178.24.2 and G25.12.3., in the survey maps.
keywords:
supernova remnants, polarization, radio continuum: ISM1 Introduction
Radio observations of supernova remnants (SNRs) probe two aspects of their physics. One aspect is particle acceleration and synchrotron radiation. Radio images show the surface brightness distribution of remnants, which in general is composed of diffuse emission and of filamentary or shell-like emission. The particles were accelerated in the shock-front of a SNR and radiate in the filamentary area. After some time, the aged particles diffuse away from the shock area and radiate over a much wider area, producing diffuse emission. The filamentary emission produced by shock-accelerated particles shows a power-law spectrum with an index of typically to (). This is for most of observed SNRs in adiabatic expansion phase. Particles with high energies lose their energy faster than those with low energies, so that the aged particles produce extended emission with a steeper spectrum. Observations with adequate resolution should be able to distinguish filamentary emission from diffuse emission. To reveal the process of particle acceleration and radiation, multiband observations are needed to make images of the spectral index distribution. The second aspect of SNR physics that can be probed with radio observations is magnetic fields. Supernova explosions not only accelerate particles, but also compress the surrounding medium by their shocks. The magnetic fields penetrating the interstellar medium are therefore compressed too, and then act as the agent for accelerated particles to produce synchrotron radiation. Radio polarization observations can probe the magnetic field structure of SNRs. It has been found that young remnants have a radial field structure, while old remnants have a tangential field structure (e.g. [Fürst & Reich 2004]). Note, however, that the foreground Faraday rotation must be discounted to get the intrinsic polarization angles of radio emission, so that the intrinsic magnetic field structure of SNRs can be revealed.
To address these two aspects of physics radio observations of SNRs need 1) adequate angular resolution so that remnants can be resolved; 2) multiband intensity measurements so that an image of the spectral index distribution can be calculated; 3) multiband polarization measurements, so that Faraday rotation in the foreground can be corrected, and the intrinsic magnetic field orientation can be figured out. In addition, high enough observing frequencies, e.g. up to 6 cm, should be selected so that radio images of a SNR do not get confused by fluctuating Galactic radio diffuse emission. Observations at shorter wavelengths suffer from less depolarization, and Faraday rotation changes position angles by only a small amount.
There are many apparently large SNRs within 2-3 kpc distance in the Galaxy, which have been objects for X-ray, Gamma-ray and optical observations. However, their radio images at high radio frequencies are extremely difficult to obtain. The huge apparent size of these SNRs, a few degrees in general, is too large for synthesis telescopes due to their limited field of view and their insensitivity to extended emission, for a single large dish telescope, such as the Effelsberg telescope, because of its small beam at high frequencies. We scanned many large SNRs at 6 cm to obtain polarization maps with the single band polarization system of the Urumqi 25 m radio telescope of Xinjiang Observatory, which we used for the Sino-German 6 cm polarization survey of the Galactic plane. An excellent receiver was constructed at the MPIfR and installed at the telescope in August 2004, which has a very good stability for long scan-observations.
In this invited talk, we introduce the main results of radio polarization observations of SNRs at 6 cm by using the small Urumqi 25 m telescope. Combining our data with 21 cm and 11 cm observations made with the Effelsberg 100 m telescope, we obtained many new results on SNR spectra and polarization.
2 Observational results
Since August 2004, we have used the Urumqi 25 m radio telescope for the Sino-German 6cm polarization survey of the Galactic plane in the region of and ([Sun et al. 2007], [Gao et al. 2010], [Xiao et al. 2011], [Sun et al. 2011a]). We divided the survey region into many patches, and scanned them in both Galactic longitude and latitude . Regular observations of 3C286 or 3C295 are made for calibration purposes. During the data processing, we have to carefully fit the baselines, remove obvious interference, and suppress scanning effects. The final radio maps at 6 cm were made in total power and linear polarization, Stokes parameters and . The latter two maps were then combined to calculate polarized intensity and polarization angle maps. The survey maps show more frequent fluctuations towards smaller Galactic longitudes in the inner region ([Sun et al. 2011a], [Xiao et al. 2011]) and the Cygnus region, which leads to high confusion for SNRs there. Data for SNRs located in the survey region are extracted from the survey, for some of them additional observations were added for higher sensitivity. SNRs outside the survey region were observed separately.
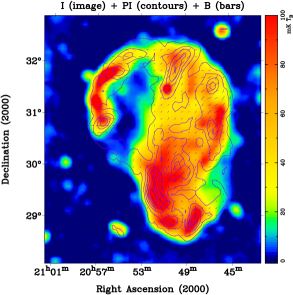
2.1 The first polarization image of the 6 cm system: the Cygnus loop
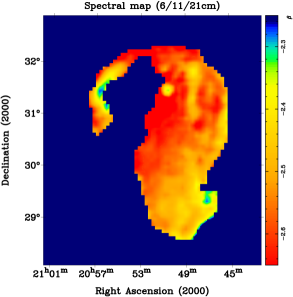
The first polarization observations of the 6 cm system were made towards the Cygnus loop (Fig. 1). This large SNR has a size of . The polarization vector distribution shows two polarization shells with different properties ([Sun et al. 2006]), which supports the idea that the Cygnus Loop consists of two SNRs, as suggested by [Uyanıker et al. (2002)]. Analysing the 6 cm map together with 11 cm and 21 cm data from observations with the Effelsberg 100 m telescope, we got a spectral index map (Fig. 1). Steep spectra are seen in the central part of the SNR.


2.2 New flux density measurements for integrated spectra
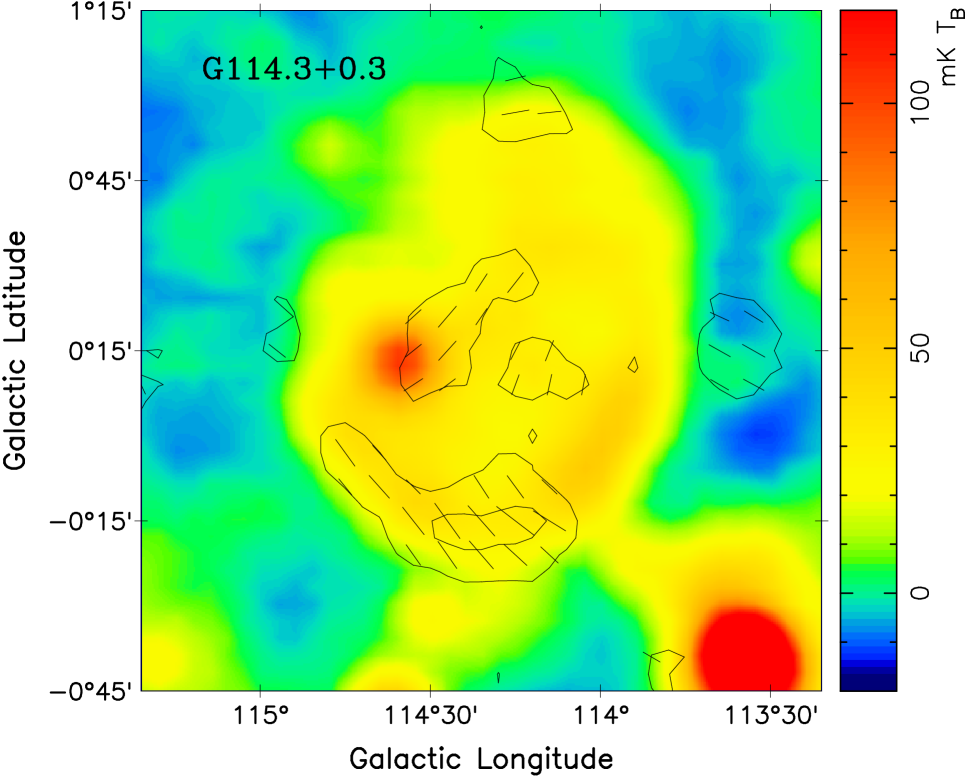
From our survey maps or separate observations at 6 cm we have measured the integrated flux densities of SNRs ([Sun et al. 2011b], [Gao et al. 2011a]). For some SNRs, we also get new measurements of integrated flux densities from the Effelsberg 11 cm and 21 cm maps. Using these measurements, together with measurements at other wavelengths from the literature, we determined or improved integrated spectra of many SNRs (Fig. 2). For the SNRs G15.11.6, G16.22.7, G16.40.5, G17.42.3, G17.82.6, G20.4 +0.1, G36.6+2.6, G43.9 +1.6, G53.62.2, G55.7 +3.4, G59.8+1.2, G65.1+0.6, G68.61.2, G69.0 +2.7 (CTB 80), G93.70.2, G113.0+0.2, and G114.3+0.3, the spectra have been significantly improved ([Sun et al. 2011b], [Gao et al. 2011a]).
2.3 Spectral break or flattening
A spectral break was suggested for several SNRs based on available integrated flux densities in literature (see plots in [Sun et al. 2011b]). SNR G74.9+1.2 seems to be a solid case which has a break at about 10 GHz. SNR G31.9+0.0 has a flat spectral below a few hundred MHz, probably due to the low frequency absorption. Flux density data of SNR G21.50.9 and G69.0+2.7 ([Gao et al. 2011a]) have very large uncertainties for claiming a spectral break. SNR G27.8+0.6 may have a break, but to verify this requires more and better high frequency data.
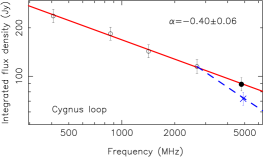
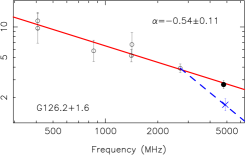
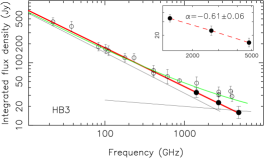
We disprove three claims of a possible spectral break or flattening by using our new measurements of integrated flux densities at 6 cm. The first one is the Cygnus loop ([Sun et al. 2006]). The small flux density at 5 GHz from previous observations ([Kundu & Becker 1972]) suggests a spectral break above 2.7 GHz ([Uyanıker et al. (2004)]). Our new integrated flux density at 6 cm rules out such a spectral steepening (see Fig. 3). The second case was G126.2+1.6. [Tian & Leahy (2006)] suggested a spectral break at about 1.5 GHz based on flux densities from the literature with low accuracy. Our new measurement at 6 cm is consistent with a single power-law for the radio spectrum ([Sun et al. 2007]). The third case is HB3. [Urošević et al. (2007)] claimed a spectral flattening above 2 GHz as an indication for radio thermal bremsstrahlung emission from a thin shell enclosing HB3. We obtained flux densities of HB3 at 6 cm, 11 cm and 21 cm for the region that is not confused by the nearby strong HII region W3, and found that these measurements are consistent with a single power law ([Shi et al. 2008]).
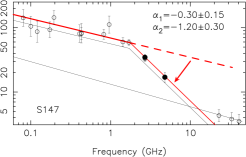
We confirmed the case for the spectral break of S147, which is a large, faint, shell-type SNR. Previous observations of S147 at 1648 MHz and 2700 MHz ([Kundu et al. 1980]) and the southern part of the SNR at 4995 MHz ([Sofue et al. 1980]) suggested a spectral break near 1.5 GHz, with a flat spectrum at lower frequencies and a steep spectrum at higher frequencies. The break needs to be confirmed because the previous observations at 4995 MHz covered only the southern part of the remnant. Our new measurements cover the entire SNR with the Urumqi 25 m radio telescope at 6 cm and new more sensitive Effelsberg 100 m radio telescope at 11 cm ([Xiao et al. 2008]), and confirm a spectral break at 1.5 GHz. The spectral break is caused by the combination of a diffuse emission component with a steep spectrum and filamentary emission with a flat spectrum, which could be traced up to 40 GHz including WMAP data (see Fig. 3).
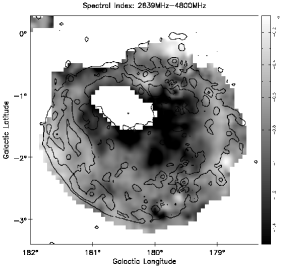
2.4 Spectral index maps of large SNRs
Our observations at 6 cm are the first to cover many large SNRs. By combining the maps with these at 21 cm and 11 cm observed with the Effelsberg 100 m radio telescope or other telescopes, we can get their spectral index maps. The first object is the Cygnus loop shown in Fig. 1 ([Sun et al. 2006]).
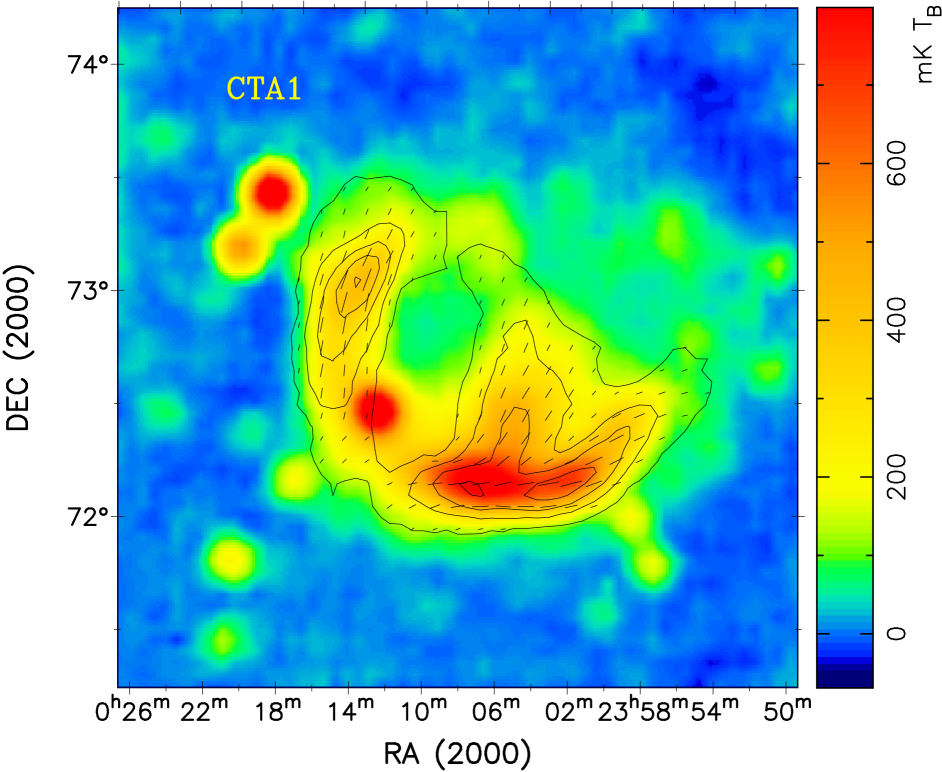
We obtained spectral index maps for many large SNRs, for example, G65.2+5.7 ([Xiao et al. 2009]), G156.2+5.7 ([Xu et al. 2007]), S147 in Fig. 4 ([Xiao et al. 2008]), CTA1 ([Sun et al. 2011c]). These maps show that the peripheries of SNRs always have a flatter spectrum, while the diffuse emission in the central part usually has a steeper spectrum. Physical reason is that newly accelerated particles in the shock fronts along the SNR periphery radiate in compressed magnetic fields, and older particles radiate in weaker magnetic fields in other areas.
2.5 New polarization maps
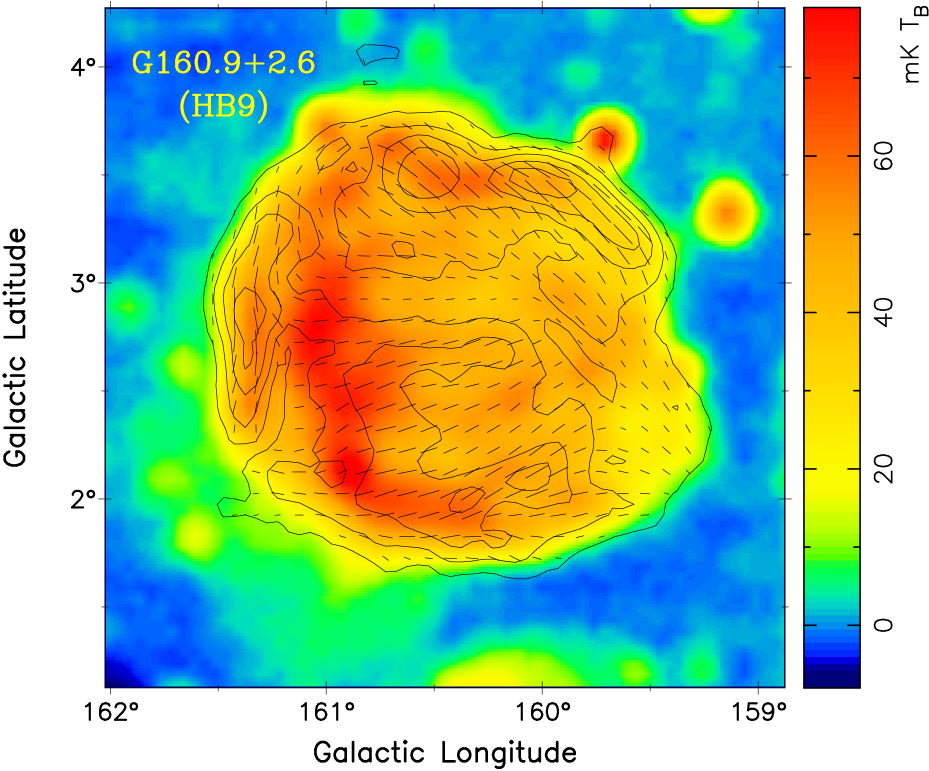
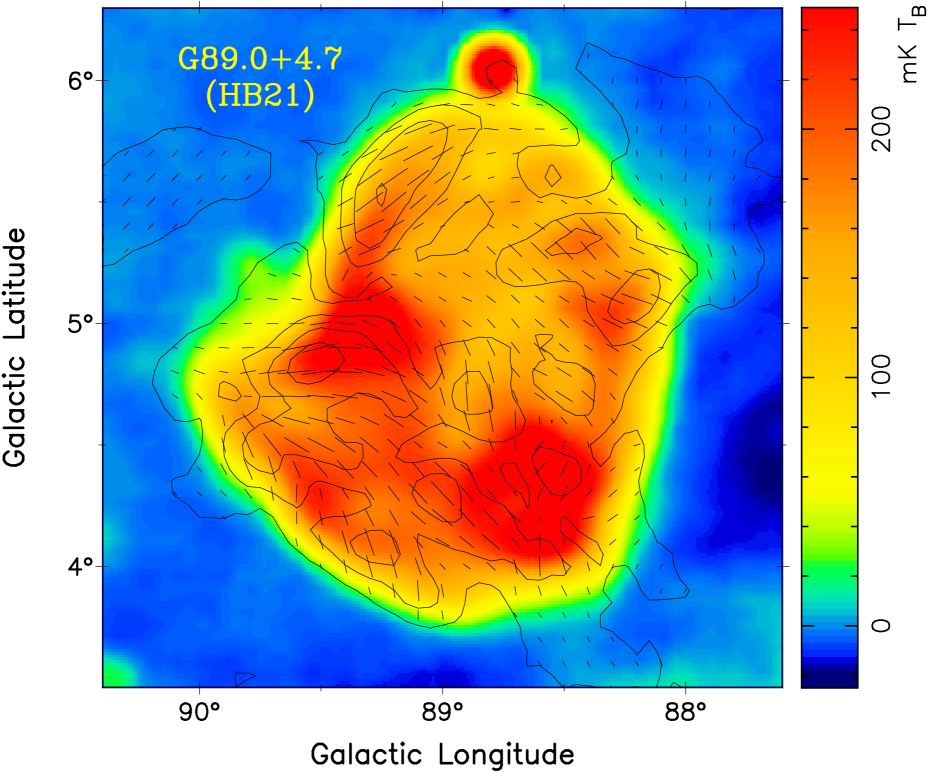
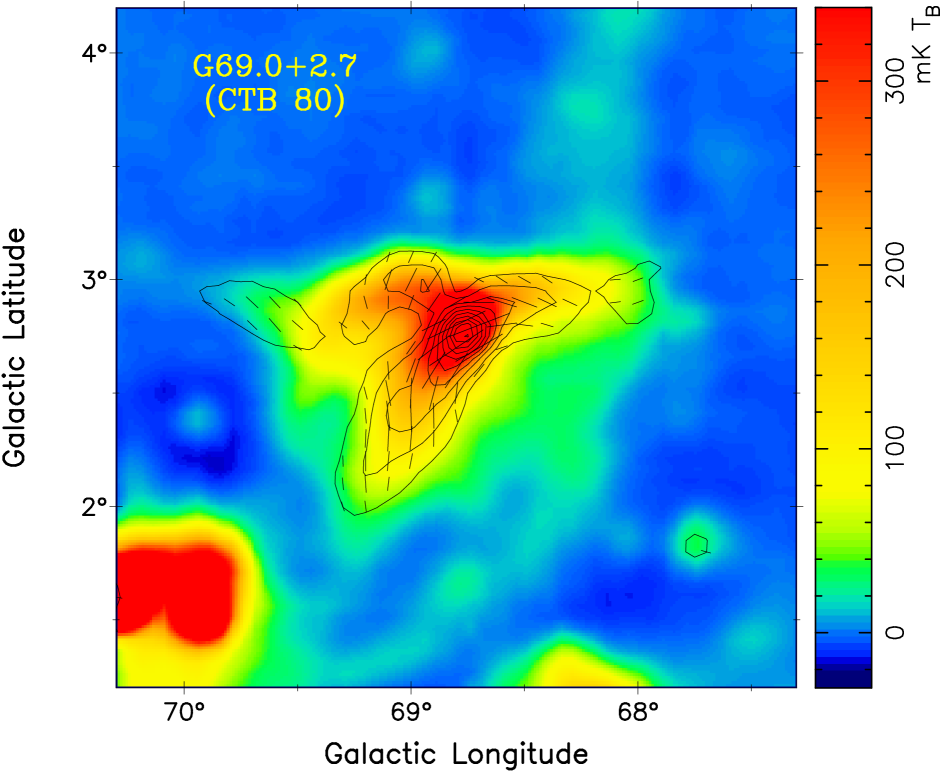
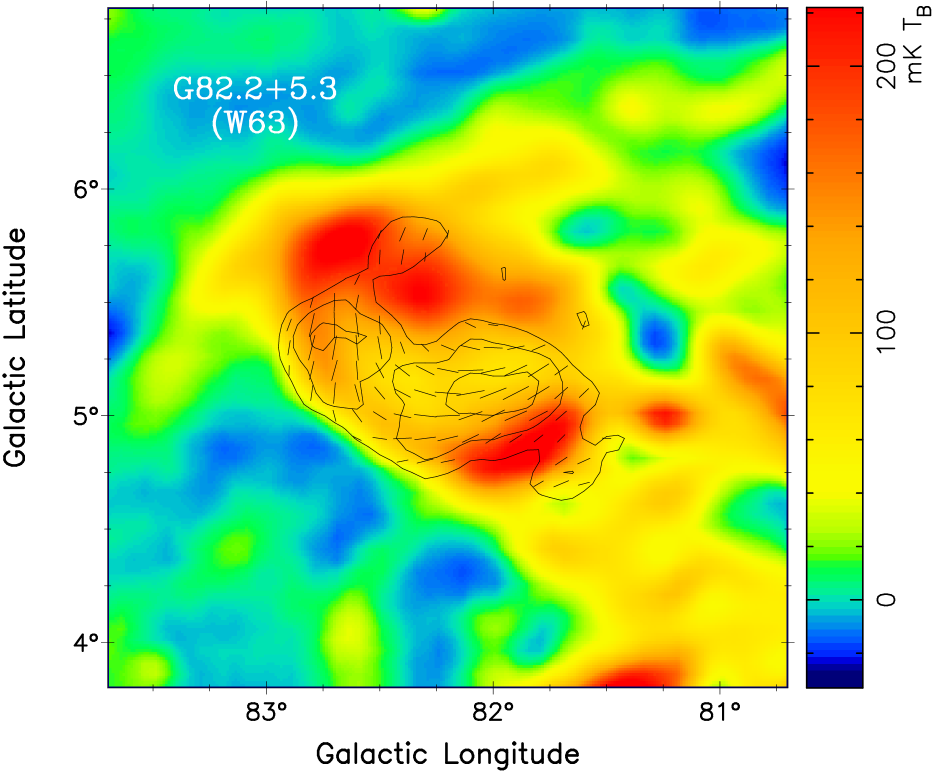
At 6 cm, due to small angles of foreground Faraday rotation, we see more or less the intrinsic magnetic field orientations of SNRs from the observed . As shown in Fig. 5, we detect tangential fields in SNR shells. For some SNRs, we detected very ordered fields, for example, in the central patch of G156.2+5.7 (Fig. 6, [Xu et al. 2007]) and the central branch of CTA 1 (Fig. 5, [Sun et al. 2011c]). Polarized emission is detected even for the whole SNR area, e.g. in the Cygnus loop in Fig. 1, G89.0+4.7 (HB21) and G160.9+2.6 (HB9) in Fig. 5. We detected radial magnetic fields in IC443 ([Gao et al. 2011a]), and a T-shape magnetic field in G68.0+2.7 (CTB80 in Fig. 5, [Gao et al. 2011a]) and its very polarized east arm. The polarized emission of G82.2+5.3 (W63) is found to be anti-correlated with the radio total power and H emission ([Gao et al. 2011a]), which indicates a mixture of local thermal and nonthermal emission in the complex region.
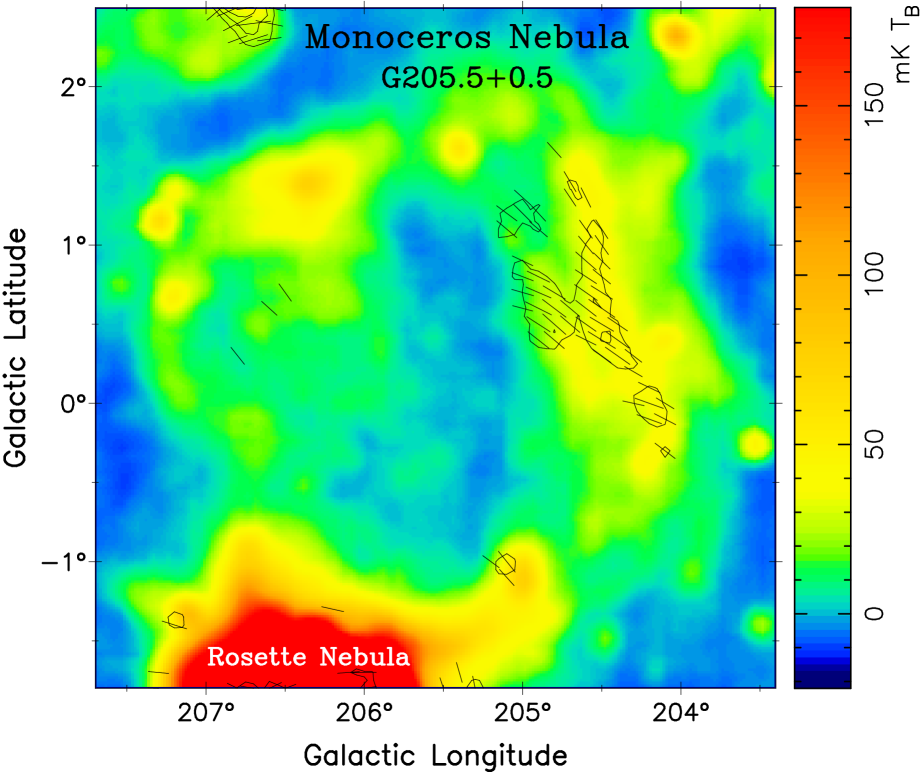
For 23 of 79 observed SNRs, we get the first complete polarization images at 6 cm. A few SNRs were never observed before in polarization (SNR G205.5+0.5 = Monoceros Nebula; G206.9+2.3; G85.90.6, G69.7+1.0, G16.22.7) until our 6 cm measurements. For G16.22.7, G69.7+1.0 and G85.90.6, the polarized emission is detected for the first time, adding evidence that they are in fact SNRs ([Sun et al. 2011b]).
2.6 Rotation measures in SNRs
Comparing the polarization angle maps at 6 cm from our Urumqi observations with those of 21 cm and 11 cm observations with the Effelsberg 100 m telescope, we calculated RM maps of SNRs.
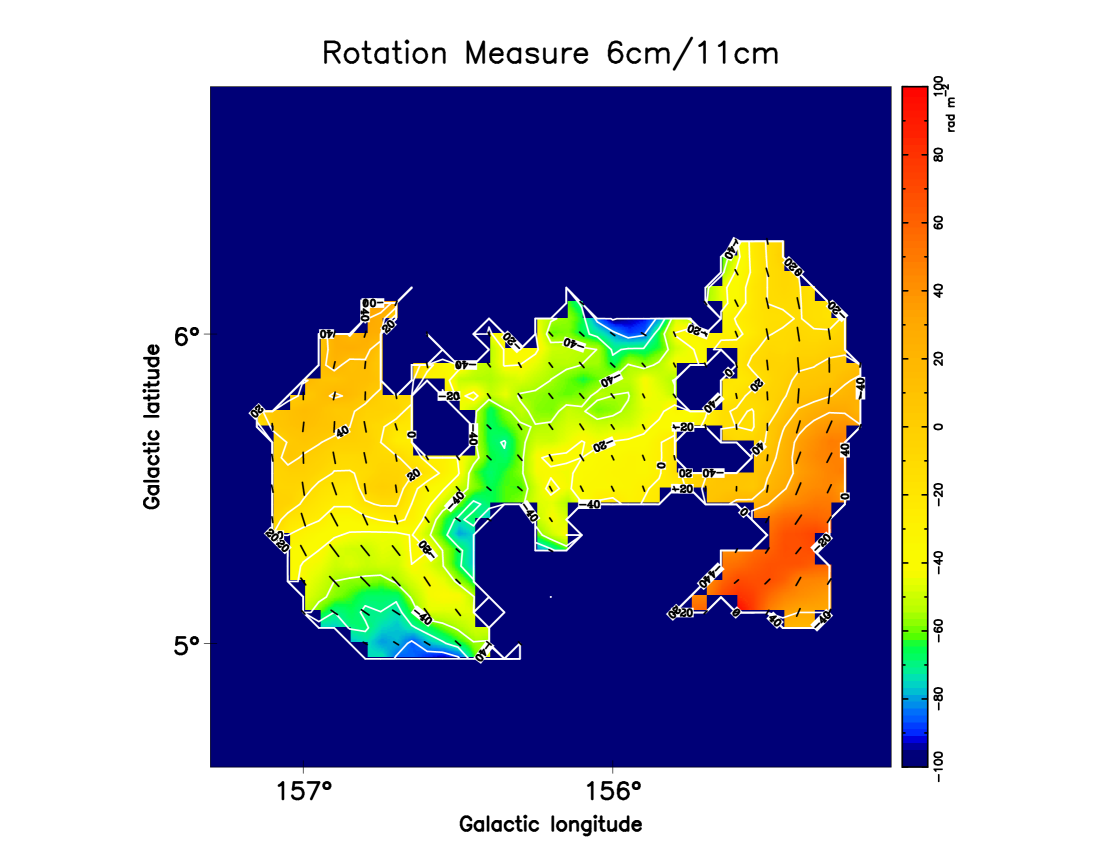
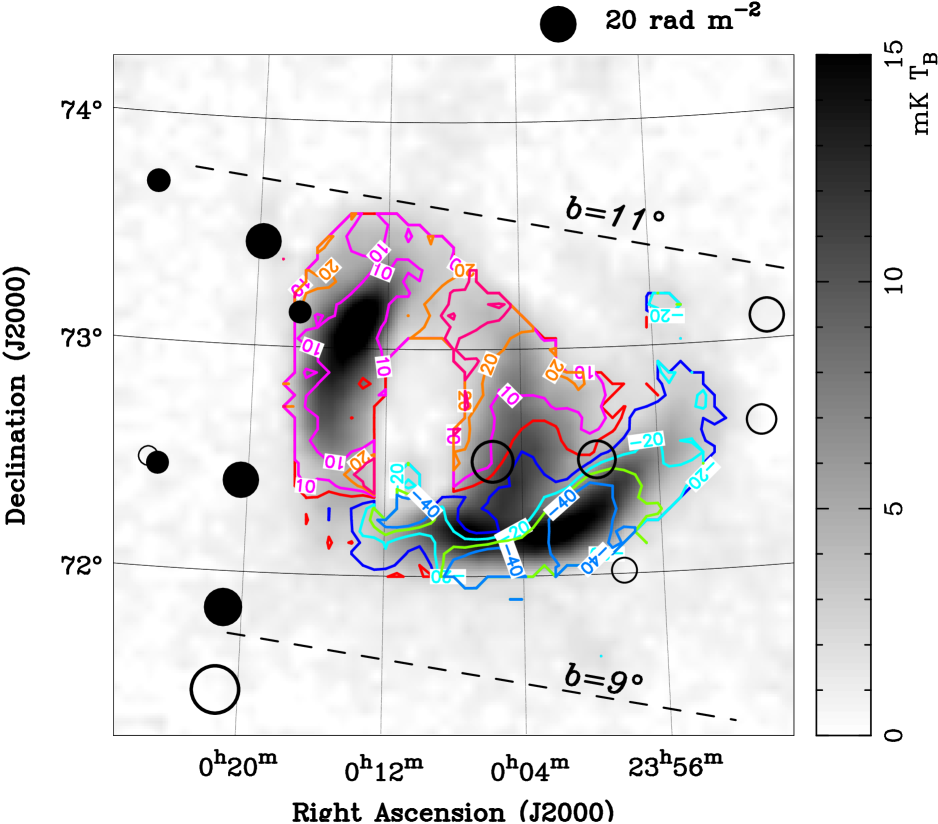
Two very interesting examples are shown in Fig. 6. The RM map of G156.2+5.7 ([Xu et al. 2007]) shows decreasing RMs downwards along the left shell of the SNR and increasing RMs along the right shell. This indicates a twisted field structure probably in the SNR shell or a foreground RM gradient. The RM map of CTA 1 ([Sun et al. 2011c]) show negative RMs in the southern shell, different from the positive RMs in the northern shell and central branch, which are caused by a Faraday screen with reversed magnetic fields in the foreground interstellar medium. The RM signs are consistent with the RM distribution of background radio sources in a wider area around CTA 1.
2.7 Discovery of two large SNRs: G178.24.2 and G25.12.3
After observations for the Sino-German 6cm polarization survey of the Galactic plane were finished in 2009, extensive data processing was carefully done by several (former) PhD students. X. Y. Gao found the extended source G178.24.2 and X. H. Sun found G25.12.3. Both of these objects are found to have a nonthermal spectrum. G178.24.2 has a polarized shell. These two objects have a size of more than 1∘, and are identified as SNRs ([Gao et al. 2011b]). See Gao et al. in this volume for details.
Our 6 cm survey data were also very important to identify two new SNRs, G152.42.1 and G190.92.2 by [Foster et al. (2013)].
2.8 Disapproved “SNRs”: OA184, G192.81.1, G16.81.1 and half of the Origem loop
Using our 6 cm data, together with 11 cm and 21 cm data from the Effelsberg 100 m telescope, we disapproved 3.5 “known SNRs”: OA184 ([Foster et al. 2006]), G192.81.1 ([Gao et al. 2011a]), G16.81.1 ([Sun et al. 2011a]), and the lower half of the Origem loop ([Gao & Han 2013]).
The first disapproved SNR was OA184 ([Foster et al. 2006]). T. Foster noticed its flat spectra at low frequencies, in contrast to the nonthermal spectra of G166.0+4.3 and HB9 located in the same area of the Galactic plane. The 6 cm observation were added in this investigation and give the final clue. It turns out that OA184 has a thermal spectra. More importantly, it appears as a depolarized extended source in the 6 cm map, rather than showing ordered polarization as expected from a shell-type SNR.
The second disapproved SNR was G192.81.1 ([Gao et al. 2011a]). The bright knots on the plateau have been found to be either known background sources or known HII region, plus a newly identified HII region. The plateau itself is found to have a thermal spectrum without any associated polarized emission.
The third one is G16.81.1 ([Sun et al. 2011b]). This object in the very inner Galaxy appears as a depolarization source in our 6cm map embedded in a large polarization patch of the Galactic diffuse emission. It coincides well with the known HII region, SH 2-50.
In addition, the Origem loop is found to to be composed of a SNR arc in the north and HII regions in the South ([Gao & Han 2013]).
3 Summary
We have demonstrated that a small telescope is very useful to observe large objects. By observing large SNRs, of a few degree in size, we obtained many unique polarization images at 6 cm. Many of these images are the first, or are the one at highest frequency so far, to reveal the intrinsic magnetic fields of SNRs. Multi-band observations are very important to calculate spectra of SNRs, or to get the spectral index images. The observations we present are very useful for studying the physical properties of SNRs on particle acceleration and magnetic fields. Using our data, we disapproved three and half “known SNRs” and dismissed the suggested spectral break of a few SNRs.
Readers can get more information from the web-page: http://zmtt.bao.ac.cn/6cm/.
Acknowledgements.
We thank the SOC of IAUS 296 for their invitation to give this summary talk, and we acknowledge financial support from the National Natural Science Foundation of China (10473015, 10773016), specifically for the Sino-German 6 cm polarization survey of the Galactic plane. The Sino-German cooperation was supported via the partner group of the MPIfR at the NAOC as part of the exchange program between the MPG and the CAS for many bilateral visits.References
- [Foster et al. 2006] Foster, T., Kothes, R., Sun, X. H., Reich, W., & Han, J. L., 2006, A&A 454, 517
- [Foster et al. (2013)] Foster, T., Cooper, B, Reich, W., Kothes, R., & West, J. 2013, A&A 549, A107
- [Fürst & Reich 2004] Fürst, E. & Reich, W. 2004, In: The magnetized Interstellar Medium, B. Uyanıker, W. Reich, and R. Wielebinski, ed., Copernicus GmbH, Katlenburg-Lindau, p.141
- [Gao & Han 2013] Gao, X. Y., & Han, J. L. 2013, A&A 551, A16
- [Gao et al. 2011a] Gao, X. Y., Han, J. L., Reich, W., Reich, P., Sun, X. H., & Xiao, L. 2011a, A&A 529, A159
- [Gao et al. 2010] Gao, X. Y., Reich, W., Han, J. L., Sun, X. H., Wielebinski, R., Shi, W. B., Xiao, L., Reich, P., Fürst, E., Chen, M. Z., & Ma, J. 2010, A&A 515, A64
- [Gao et al. 2011b] Gao, X. Y., Sun, X. H., Han, J. L., Reich, W., Reich, P., & Wielebinski, R. 2011b, A&A 532, A144
- [Kundu & Becker 1972] Kundu, M. R., & Becker, R. H. 1972, AJ 77, 459
- [Kundu et al. 1980] Kundu, M. R., Angerhofer, P. E., Fürst, E., & Hirth, W. 1980, A&A 398, 993
- [Sofue et al. 1980] Sofue, Y., Fürst, E., & Hirth, W. 1980, PASJ 32, 1
- [Shi et al. 2008] Shi, W. B., Han, J. L., Gao, X. Y., Sun, X. H., Xiao, L., Reich, P., & Reich, W. L. 2008, A&A 487, 601
- [Sun et al. 2007] Sun, X. H., Han, J. L., Reich, W., Reich, P., Shi, W. B., Wielebinski, R., & Fürst, E. 2007, A&A 463, 993
- [Sun et al. 2006] Sun, X. H., Reich, W., Han, J. L., Reich, P., & Wielebinski, R., 2006, A&A 447, 937
- [Sun et al. 2011a] Sun, X. H., Reich, W., Han, J. L., Reich, P., Wielebinski, R., Wang, C., & Müller, P. 2011a, A&A 527, A74
- [Sun et al. 2011b] Sun, X. H., Reich, P., Reich, W., Xiao, L., Gao, X. Y., & Han, J. L. 2011b, A&A 536, A83
- [Sun et al. 2011c] Sun, X. H., Reich, W., Wang, C., Han, J. L., & Reich, P. 2011c, A&A 535, A64
- [Tian & Leahy (2006)] Tian, W. W., & Leahy, D. 2006, A&A 447, 205
- [Urošević et al. (2007)] Urošević, D., Pannuti, T. G. & Leahy, D. 2007, ApJ 655, L41
- [Uyanıker et al. (2002)] Uyanıker, B., Reich, W., Yar, A., Kothes, R., & Fürst, E. 2002, A&A 389, L61
- [Uyanıker et al. (2004)] Uyanıker, B., Reich, W., Yar, A., & Fürst, E. 2004, A&A 426, 909
- [Xiao et al. 2008] Xiao, L., Fürst, E., Reich, W., & Han, J. L. 2008, A&A 482, 783
- [Xiao et al. 2009] Xiao, L., Reich, W., Fürst, E., & Han, J. L. 2009, A&A 503, 827
- [Xiao et al. 2011] Xiao, L., Han, J. L., Reich, W., Sun, X. H., Wielebinski, R., Reich, P., Shi, H., & Lochner, O. 2011, A&A 529, A15
- [Xu et al. 2007] Xu, J. W., Han, J. L., Sun, X. H., Reich, W., Xiao, L., Reich, P., & Wielebinski, R. 2007, A&A 470, 969