Finite temperature and pressure molecular dynamics for BaFe2As2
Abstract
We study the temperature and pressure dependence of the structural and electronic properties of the iron pnictide superconductor BaFe2As2. We use density functional theory based Born-Oppenheimer molecular dynamics simulations to investigate the system at temperatures from K to 150 K and pressures from GPa to 30 GPa. When increasing the pressure at low temperature, we find the two transitions from an orthorhombic to a tetragonal and to a collapsed tetragonal structure that are also observed in zero temperature structure relaxations and in experiment. However, these transitions are considerably smeared out at finite temperature, whereas the critical pressure for the first transition increases with temperature. We also analyze the electronic structure of BaFe2As2 at finite temperature and work out differences between the time averaged band structure and Fermi surface at finite temperature compared to the known zero temperature results. Our results should be helpful for resolving some open issues in experimental reports for BaFe2As2 under high pressure.
pacs:
74.70.Xa,71.15.Pd,71.15.Mb,61.50.KsI INTRODUCTION
The discovery of superconductivity in FeAs based compounds in 2008 with a critical temperature up to K KamiharaWatanabe2008 was the beginning of a large and fast-evolving field dedicated to these new types of superconductors. These materials like for example LiFeAs TappTang2008 ; WangLiu2008 , SmFeAsO Ren2008 and BaFe2As2 RotterTegel2008Lett share the structural motif of FeAs layers in which superconductivity can emerge either by doping and/or by external pressure with critical temperatures of up to K. One material of great interest is the compound BaFe2As2 of the 122-type family, which shows interesting behavior under external pressure and temperature. At room temperature and ambient pressure, the crystallographic structure of BaFe2As2 is that of the body-centered tetragonal ThCr2Si2-type structure (space group ) with poor Pauli-paramagnetic metallic behavior and high electrical resistivity WangWu2009 . Upon lowering of the temperature, the material undergoes a structural and magnetic transition to the low-temperature orthorhombic structure RotterTegel2008 with a stripe-ordering of the Fe magnetic moments HuangQui2008_2 . External hydrostatic or uni-axial pressure is capable of suppressing the magnetically ordered orthorhombic phase and induces the tetragonal paramagnetic phase with a region of superconductivity AlirezaKo2008 ; ColombierBudko2009 ; PaglioneGreene2010 at low temperatures. At higher pressures, the collapsed tetragonal phase emerges UhoyaStemshorn2010 ; MittalMishra2011 , where experiments as well as recent theoretical investigations Tomic2012 find different values for the critical pressure, which seems to be sensitive to temperature. At K, values of GPa under nonhydrostatic pressure conditions UhoyaStemshorn2010 and GPa MittalMishra2011 under hydrostatic pressure conditions are reported, whereas at K a critical pressure of GPa was found MittalMishra2011 . Also hysteresis effects of the temperature or a coexistence of the orthorhombic and tetragonal phase might be present for a wide range of pressures MittalMishra2011 . These experimental results show that the critical pressures and their possible temperature dependence are not yet fully understood.
In recent years, there have been quite a few theoretical studies of structural effects in BaFe2As2. The phase transitions at zero temperature were studied with Car Parrinello molecular dynamics with friction Zhang2009 , highlighting the importance of Fermi surface nesting for the nature of the phase transitions. A combination of DFT total energies and thermodynamical quantities estimated from experiment was used to rationalize some finite temperature transition points in the phase diagram JiLu2011 . Constant volume DFT relaxations have been used to study the zero temperature pressure-induced structural transitions and equation of state both for hydrostatic Colonna2011a and nonhydrostatic Colonna2011b pressure conditions. The phase transitions in BaFe2As2 have also been studied using the fast inertial relaxation engine Tomic2012 , which allows an unconstrained equilibrium structure search for arbitrary stress tensors. This method has been used to work out effects of uniaxial pressure along c direction Tomic2012 and also in the plane Tomic2013 . Since most studies so far used either experimentally measured or zero-temperature optimized structures, the complex temperature and pressure phase diagram of BaFe2As2 calls for microscopic first principles calculations at finite temperature.
Therefore, in this study we extend the theoretical toolbox for the study of BaFe2As2 to include finite temperatures. We employ ab initio density functional theory (DFT) methods combined with finite temperature and pressure molecular dynamics. We specifically investigate the temperature behavior of the structural transitions and electronic properties. To our knowledge, no theoretical investigations of the finite temperature regime with external pressure of BaFe2As2 have been carried out before. Therefore, our results can provide a useful complement to existing K theoretical calculations and can help to clarify the contradicting observations that are reported for the transition pressures in experiments.
II METHODS
We performed the molecular dynamics calculations using the atomic simulation environment (ASE) ASE interface combined with the DFT Vienna ab-initio simulation package (VASP) Vasp , version 5.2.11, with the projector augmented wave basis pawPotentials in the generalized gradient approximation (GGA) by Perdew, Burke and Ernzerhof GGAPBE . To control the temperature and pressure, the Berendsen dynamics Berendsen provided by ASE were employed, using characteristic time-constants of fs, fs for the thermostat and barostat, respectively, and a time step of fs for the integration of the equations of motion. The energy cut-off in VASP was set to eV and a Monkhorst-Pack uniform grid of k-points was used for the integration of the Brillouin zone. To account for the magnetic stripe-order, we simulate a supercell of the conventional orthorhombic unit cell of BaFe2As2 containing 8 Fe atoms. Calculations were performed on a pressure-temperature grid with 13 different values of going from GPa to GPa in GPa steps and for temperatures of K, K, K and K. The values of observables were obtained by averaging over the last fs of the trajectory after the configuration was sufficiently equilibrated.
III RESULTS
III.1 Effect on transitions
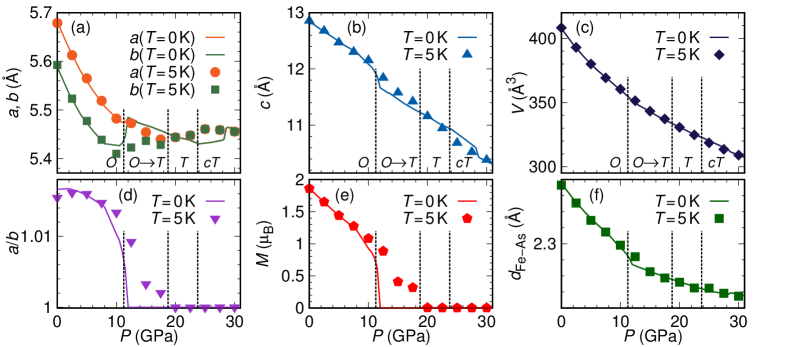
We now present our results for the lattice parameters, magnetic moments and volume at temperatures between K and K compared to a zero-temperature relaxation Tomic2012 . In Fig. 1 we show the pressure dependence of the three lattice parameters , and at K, which is very similar to the K case. We observe a transition from the orthorhombic to tetragonal structure at about GPa and a second transition from the tetragonal to a collapsed tetragonal structure which is around GPa. For low values of pressure, i.e. GPa, our results are almost identical to the K calculation, with our obtained values for the and axis being slightly longer in comparison. The reason for that is clearly given by finite temperature which leads to internal pressure due to the temperature fluctuations of the atomic position and thus increasing the volume of the unit cell compared to the K case.
The position of the transition to the tetragonal phase is visible as a sudden increase in the lattice parameter at around GPa. The position of the transition is in agreement with the K result but the resulting configuration is not a perfect tetragonal unit cell, with the orthorhombic distortion significantly reduced but still non-zero. The -ratio drops from at GPa to at GPa and retains a value larger than one up to GPa.
Even though all the lattice parameters noticeably differ from the K results in some cases, our obtained volume of the unit cell is still very similar (see Fig. 1 c)).
For increasing pressure we find the average distance of the iron and arsenic atoms in the Fe-As tetrahedron layers to be reduced and the orthorhombic transition is visible as a kink in the Fe-As distance plot. Our results closely match the zero temperature calculation and correctly indicate the orthorhombic to tetragonal transition around GPa (see Fig. 1 (f)).
The tetragonal to collapsed tetragonal transition at zero temperature is marked by a sudden increase of the and and a decrease in the lattice constant at GPa. Our results show a smoothed-out transition with less drastic changes in the lattice parameters at GPa. The and lattice parameters increase by from GPa to GPa, whereas the increase for K is from GPa to GPa. The lattice parameter shows a similar behavior, where in the zero temperature case a distinct decrease at GPa is visible, but our results show a smooth behavior of that looks almost linear with no sharp drop.
The most notable difference between finite temperature and previous zero temperature results is the non-tetragonal but intermediate orthorhombic-tetragonal structure of our system for values of pressure where the K structure is already completely tetragonal. Thus, our calculations obtain a smooth transition rather than sudden change of the lattice parameters for the OT transition and also for the TcT transition. This is to be expected since due to the temperature fluctuations the system is allowed to oscillate between two competing structural configurations and magnetic orderings close to the critical pressure at K. Our result suggests that this phase, which is intermediate between orthorhombic and tetragonal phases, is the best approximation we can get with our 20 atom supercell to a mixed phase. As a result, the OT transition is smoothed out to higher pressures, whereas the TcT transition experiences strong smearing effects. This behavior is strongly enhanced for higher temperature, where the OT transition is shifted to even higher pressures of about GPa and the TcT transition becomes almost indiscernible. This gives interesting effects in the relative change of the lattice parameters with temperature, which we will discuss below.
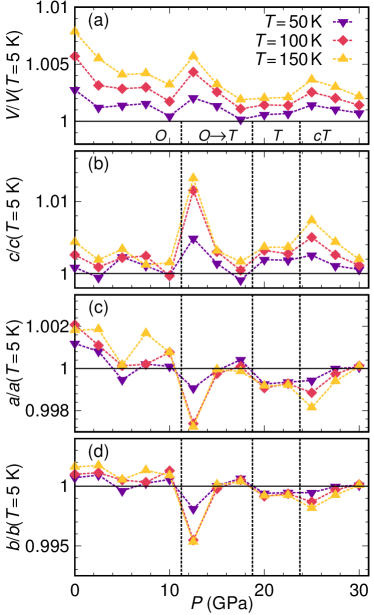
The increase of the volume of the unit cell and the lattice parameters , , with temperature can be seen in Fig. 2. For K the volume increases slightly at all pressures compared to K, with different behavior at the critical pressures. Up to the first transition, the increase of the volume with temperature decreases as expected due to higher pressure and then shows a peak right at GPa, which is caused by the temperature induced shift of the OT transition, i.e. the sudden decrease in volume, to higher pressures. In all of the regions we identified, except in the tetragonal phase the relative volume increase falls off almost monotonically until the transition to the next phase, where it shows a small jump to higher values, after which it decreases again. Only in the tetragonal phase the increase with temperature seems to be pressure independent. Comparatively, the jump of the relative volume increase is largest at the high pressure end of the orthorhombic phase. This behavior is mirrored in the temperature dependence of the lattice parameter at the critical pressures. We observe that at a pressure of GPa the relative change of when increasing the temperature from K to K and from K to K compared to K to K is considerably larger. This can be explained by the temperature-induced transition from the tetragonal phase to the orthorhombic phase. This is also the reason for the relative decrease of the and lattice parameters at GPa. Thus, we obtain a positive slope of the orthorhombic to tetragonal phase transition in the temperature-pressure phase diagram of BaFe2As2.
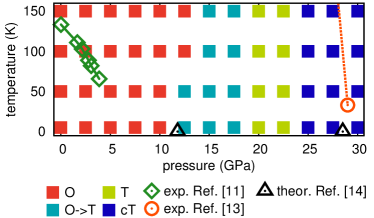
Finally, we set up a temperature pressure phase diagram by specifying the state of the system for each combination we calculated, i.e. by taking into account if the structure is orthorhombic or tetragonal, the magnetic moments, etc. To determine the transition pressures used in the diagram we investigated the pressure-derivative of the and lattice parameters and the volume. In the phase diagram (see Fig. 3) we distinguished four different regions of structural configurations: The first one is the phase of the purely orthorhombically distorted unit cell, in which all the lattice parameters still continue to decrease monotonically with higher pressure. As we have seen, this phase is present for pressures up to GPa for the temperatures K and 50 K and extends to K for the two higher temperatures. The second region is an intermediate orthorhombic-tetragonal state, in which the shorter axis of the unit cell is no longer decreasing but increases with higher pressures and has not reached the same length as the longer axis . This region is quite prominent in our results since the transition is always smoothed out considerably compared to the K result Tomic2012 . The next phase is the one of a pure tetragonal unit cell with equal lattice parameters . After that, at high pressures the collapsed tetragonal phase is dominating, which is defined by the sudden increase in the and and the decrease in the -axis. By comparing the temperature dependence of the lattice parameters at fixed values of the pressure we suspect the TcT transition to be pushed to lower pressures at higher temperature, which was found by Mittal et al. MittalMishra2011 , but due to strong smearing effects we could not determine a slope in the critical pressure. However, we find the transition to the collapsed tetragonal phase to occur at a pressure being GPa lower compared to experiments.
III.2 Band Structure
In order to investigate the effect of the finite temperature fluctuations on the electronic properties of BaFe2As2, we performed band structure calculations using the full-potential local-orbital minimum-basis code (FPLO) FPLO . For the calculation a k mesh was employed and the generalized gradient approximation (GGA) method by Perdew, Burke and Ernzerhof GGAPBE was used for the exchange- and correlation potential. The tetrahedron-integration method was used for the integration of the Brillouin zone and the density was converged with an accuracy of .
As the first configuration we investigated a temperature of K and pressure of GPa, where an orthorhombic unit cell with non-zero magnetic moments is present. At this temperature the volume is periodically fluctuating around a mean value of . The duration for a complete oscillation cycle of the volume is about fs. We took snapshots of the crystal structure in fs intervals, starting from the maximal expanded volume down to the minimum value of the volume, so in total we covered one half of the oscillation cycle of about fs. For the band structure we use the usual path in k-space , , , , , given in units of the reciprocal lattice vectors. We chose this path since it corresponds to the higher symmetry of the Fe lattice rather than to the space group and it can be easily compared to the band structure of the more simple tetragonal LaOFeAs Mazin2008 .
We compared our results to a zero-temperature BaFe2As2 structure at GPa from Tomic2012 to investigate how the finite temperature affects the bands near the Fermi level. Since the most important contribution to the DOS at the Fermi level in this materials is usually given by the Fe bands, which we also confirmed to be the case here, we will now discuss the effect of the finite temperature on the Fe bands exclusively. For a meaningful comparison one has to mind that in the finite temperature case the positions of the atoms in the unit cell are fluctuating and thus the eight Fe atoms are no longer equivalent and the crystal structure is no longer the space group but rather triclinic . Due to the higher number of inequivalent Fe atoms we also get additional Fe bands that are folded back into the Brillouin zone. By using the band unfolding method that was prosed in Ref. Ku2010 and implemented in FPLO vanHeumen2011 , we can unfold the band structure and map the equivalent bands onto a single one.
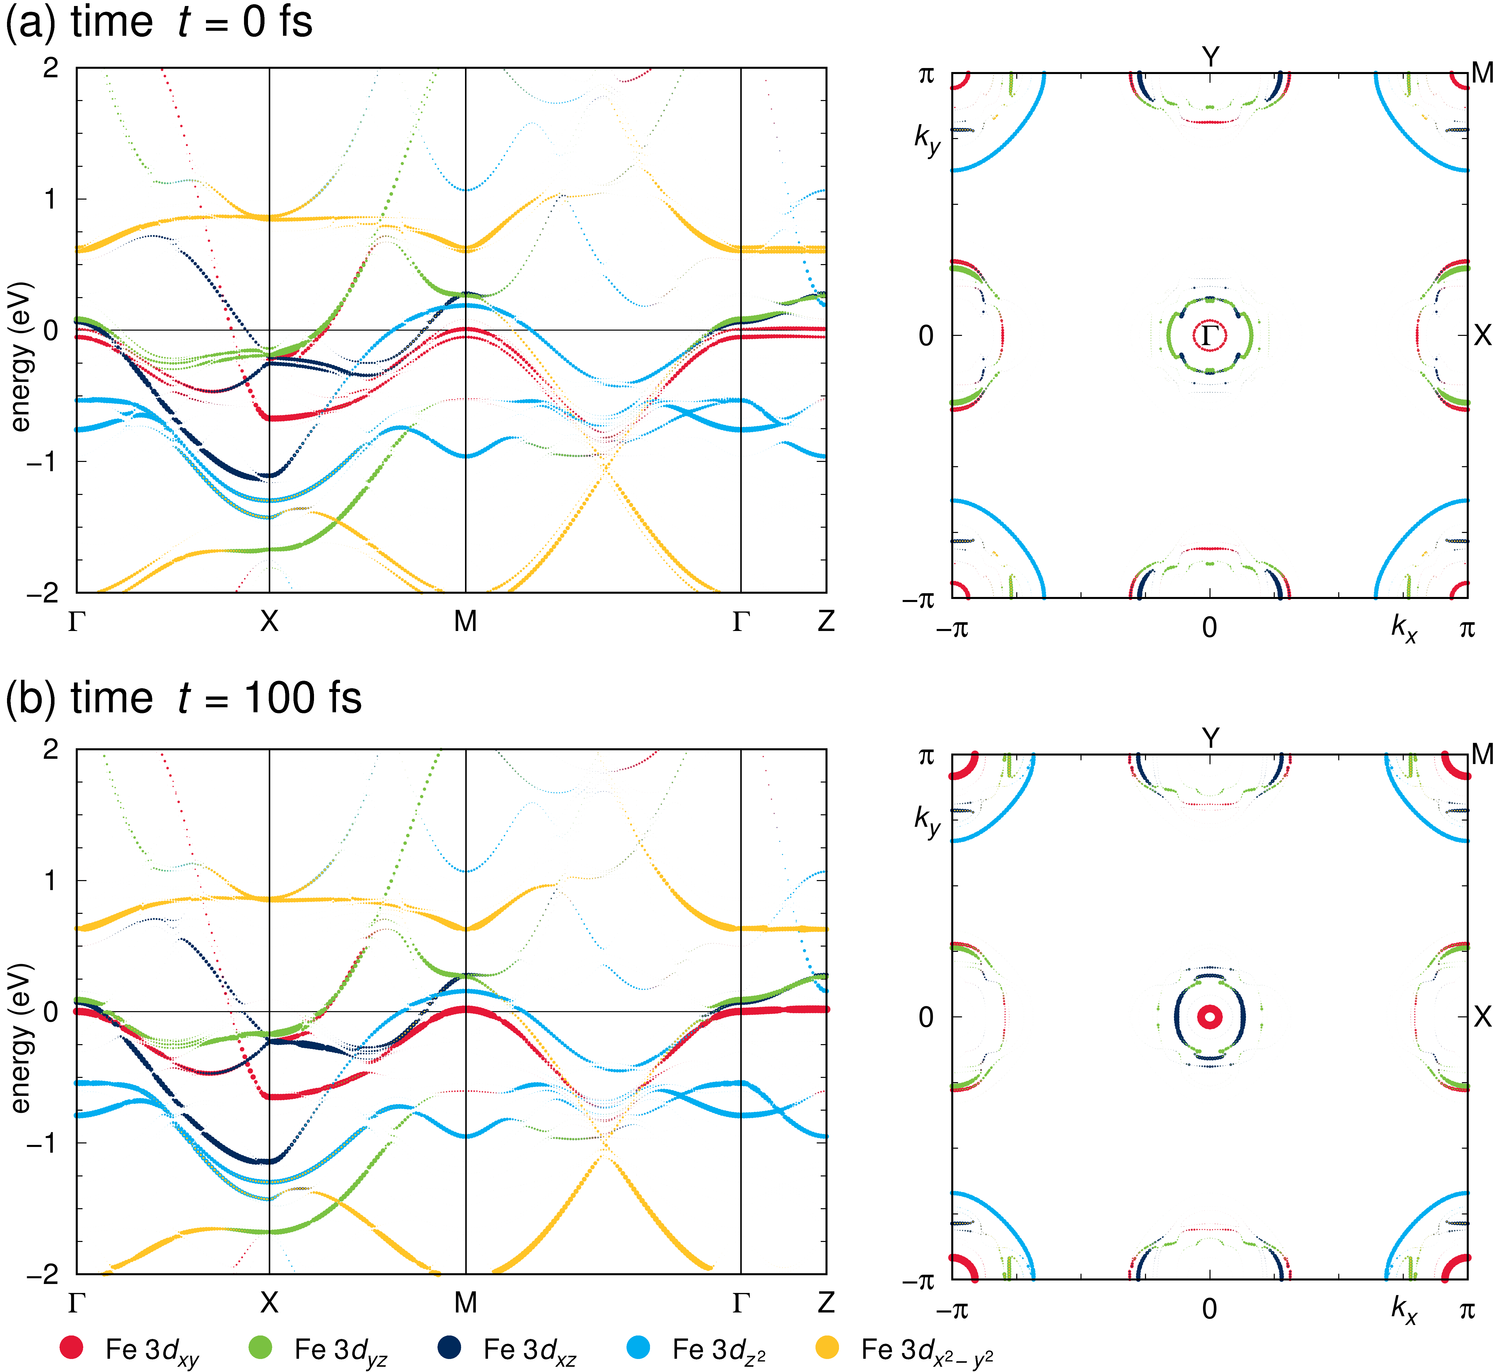
In Fig. 4 we show the Fe orbital weighted band structure and the Fermi surface cut of BaFe2As2 at K and ambient pressure. The figure shows instantaneous electronic structures for two structural configurations during a complete volume oscillation cycle of the unit cell, separated by a time of fs. The first configuration (Fig. 4 (a)) corresponds to the maximal volume and the second one (Fig. 4 (b)) to the minimal volume during the oscillation cycle. Close to the Fermi level the most important bands are the Fe , and states. The unfolding procedure occasionally leads to more crossings of the Fermi surface than at because in their thermal motion the Fe sites are only approximately equivalent. Fe , and bands form hole pockets at the point and in addition character is present at the point. Electron pockets at the X (and Y) points are of , and character. Compared to K calculations, the effect of the finite temperature is clearly present in the shallow inner hole pocket of character at the point, which clearly shows size fluctuations during the trajectory. Shrinking of this hole pocket can be compared to the effect of hydrostatic and uniaxial pressure Tomic2012 , where the Fe band is pushed below the Fermi level at the magnetic OT transition. The structural variations along the MD trajectory at K also show interesting effects on the outer hole cylinders at the point. While they appear elliptical along at fs, they appear elliptical along at fs. This change of shape goes hand in hand with changing importance of and characters: more at fs, more at fs. This feature resembles the electronic structure changes upon uniaxial compressive and tensile stress in the plane of BaFe2As2 (compare Ref. Tomic2013, ). Other bands seem to be less affected by the volume oscillations.
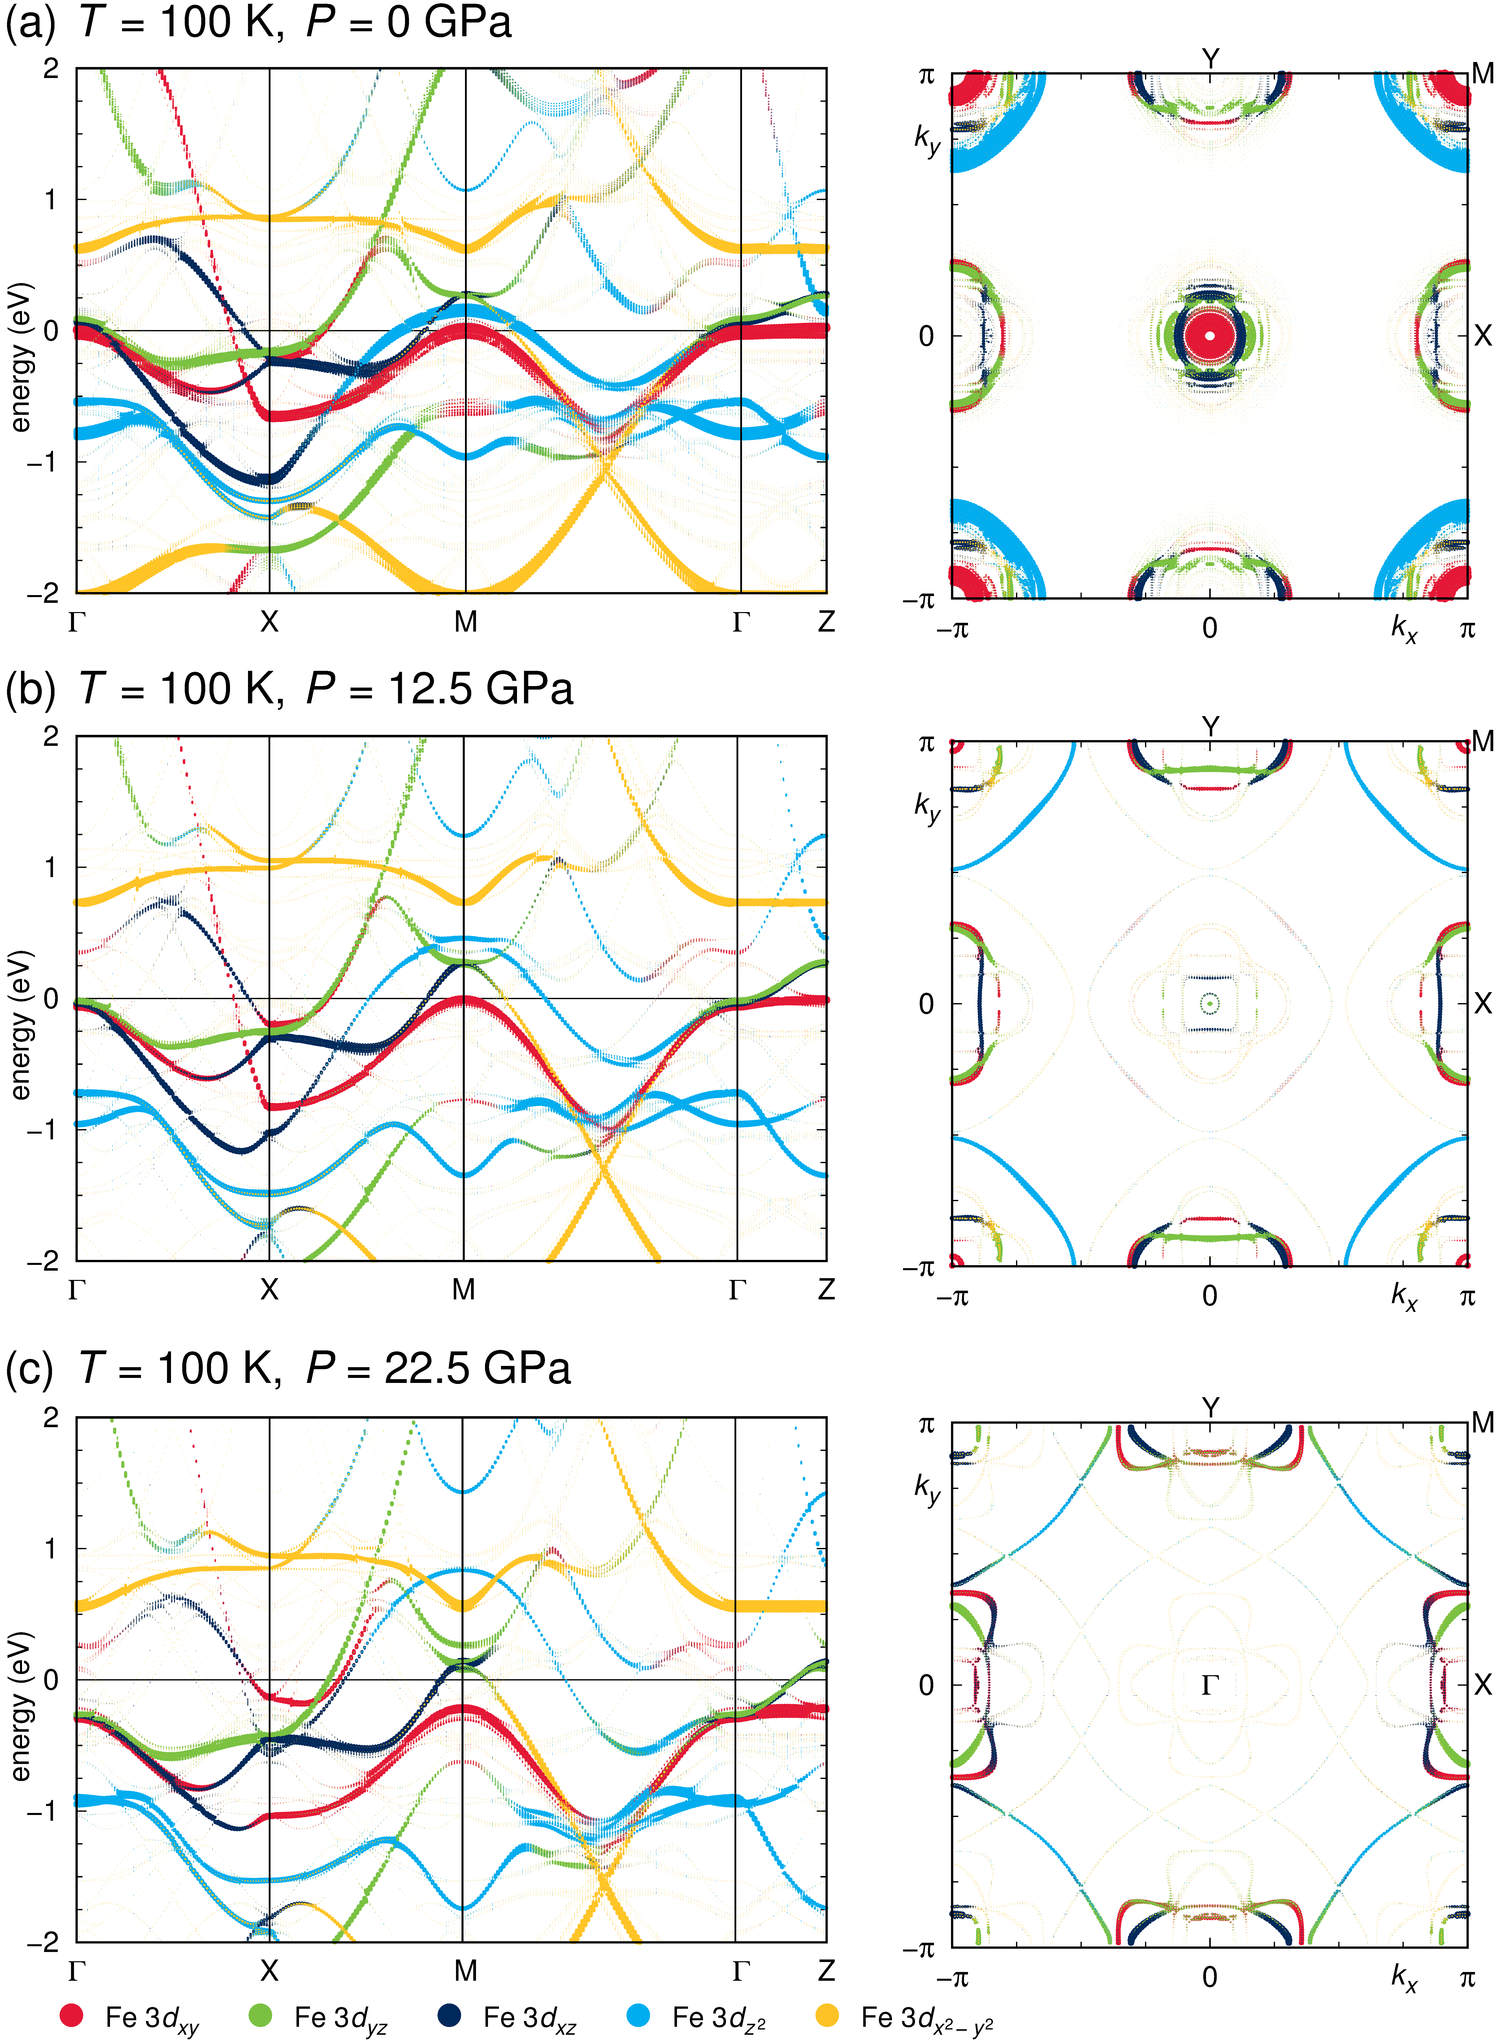
We now proceed from the consideration of transient shapes of the Fermi surface to its thermal average. Transient features of the electronic structure are interesting theoretically and can in principle, at least following the excitation of coherent phonons, be observed in experiments with very high temporal resolution Rettig2012 ; Avigo2013 . Since usual angle resolved photo emission observes time averaged electronic structures, a comparison to the averaged band structures like the ones we show in Fig. 5 might be more appropriate. Note, however, that while our electronic structures include the effect of thermally fluctuating crystal structures, they do not include the thermal broadening of the spectral function which can be described by finite temperature Greens functions. Fig. 5 shows the time averaged band structure at K for the pressures GPa, GPa and GPa, where the first one is deep in the orthorhombic phase, the second is in the smooth transition region between orthorhombic and tetragonal phases and the latter is in the tetragonal phase.
Our results clearly show that the Fe band at the point and the Fe band at the and points experience noticeable changes due to thermal structure fluctuations. In the plot the broadening of the bands is a lot larger than the line width used to draw them, which has implications for interpreting and comparing theoretical iron pnictide band structures and experimentally measured spectral functions. Bands that are below the Fermi level in theoretical zero-temperature calculations can become partially occupied even at temperatures way below room temperature like K just because of the structural fluctuations caused by temperature. This could have implications for the interpretation of angle-resolved photo emission spectroscopy (ARPES) results as it leads to an additional broadening in spectral functions, besides the usual thermal broadening.
As the pressure is increased to GPa, which in our case is in the orthorhombic-tetragonal smoothed transition region, we notice a significant shift of bands away from the Fermi level as already reported previously Zhang2009 ; Tomic2012 . The Fe band becomes fully occupied at the point and fluctuates around at the point, whereas the Fe band is shifted to higher energies. The finite Fe weight at the Fermi level at the point is in contrast to the previous K calculation Tomic2012 and corresponds to the smooth OT transition. Compared to the GPa result, the temperature induced fluctuations are greatly reduced and only little smearing of the Fermi surface is observed.
In the tetragonal phase at GPa the Fe bands are pushed further away from the Fermi level, with no crossings at the point and only small Fe and hole pockets at the point. Thermal smearing of the Fermi surface is further reduced.
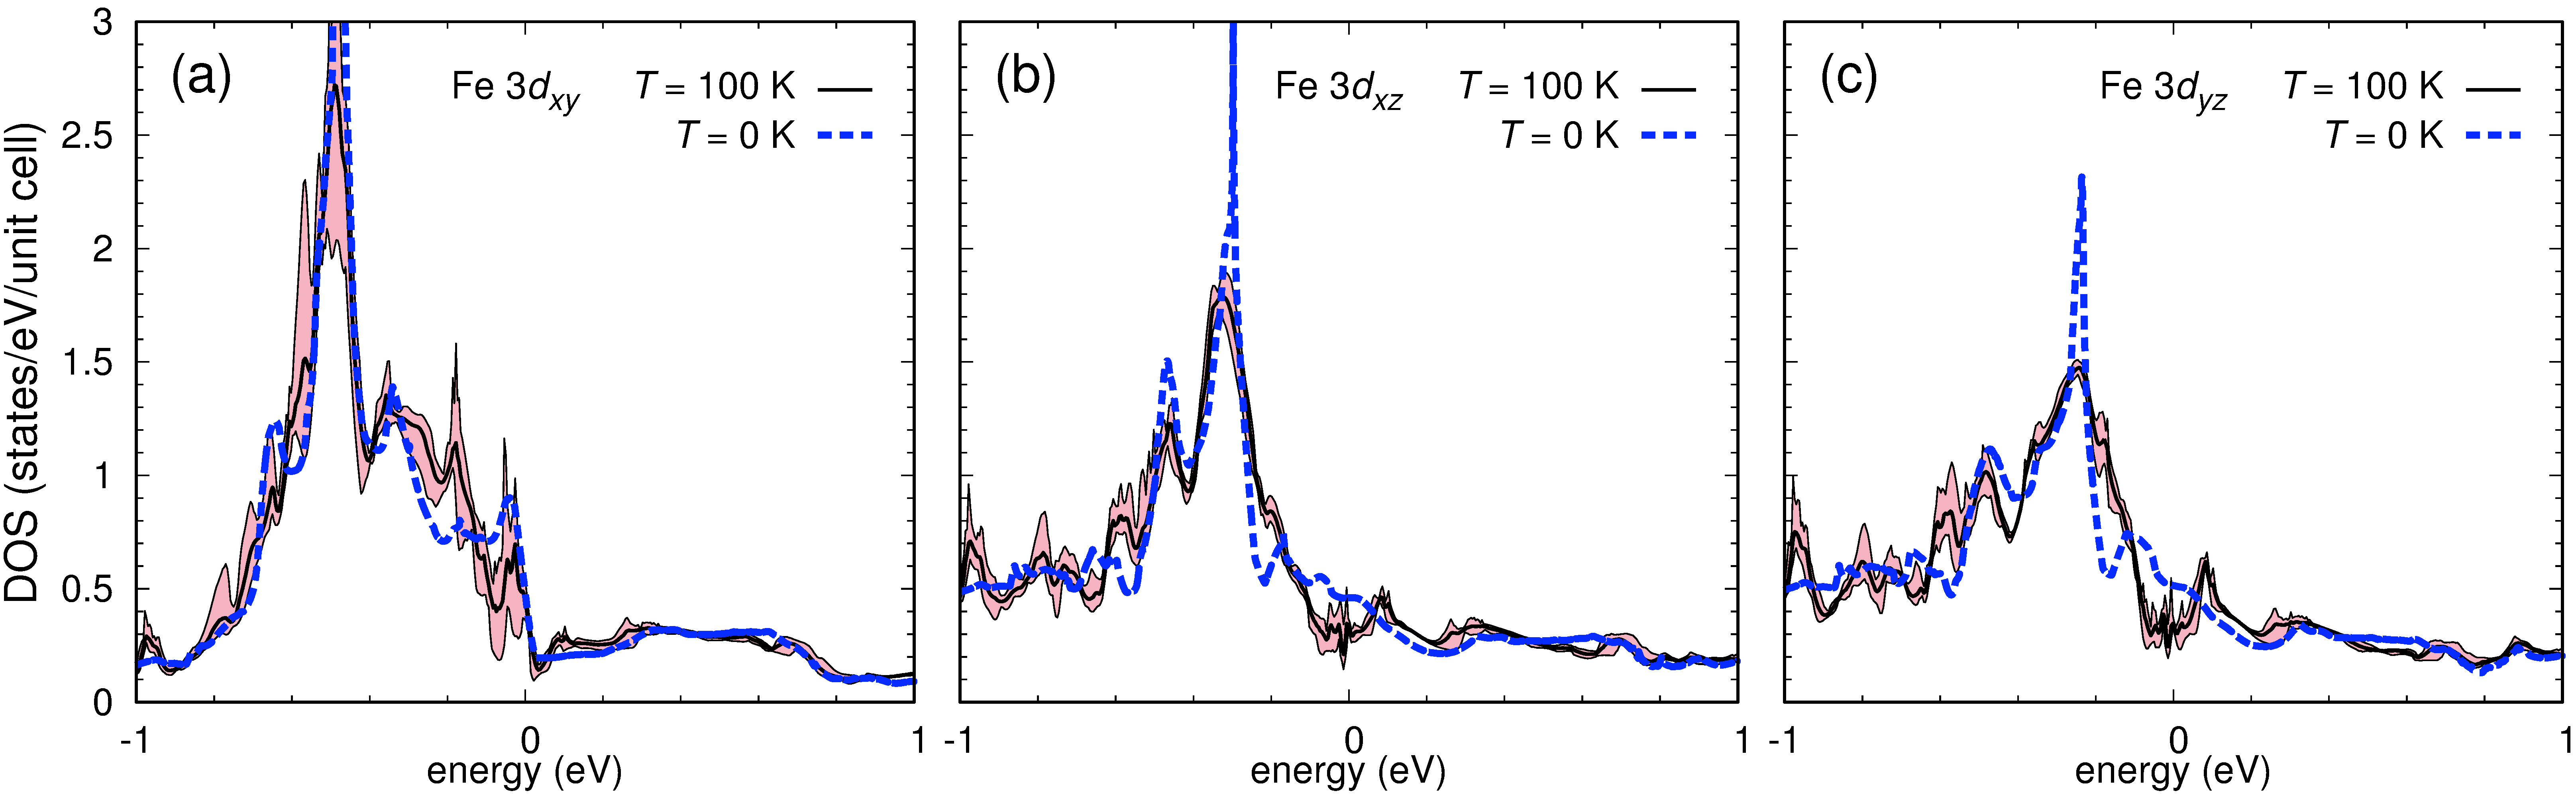
The effect of the temperature fluctuations in the Fe bands is also visible in the density of states (DOS). In Fig. 6 we show the Fe density of states for the three most important Fe , and bands. Compared to the zero temperature case we find our previous results for the K calculations to be confirmed also in the DOS. The change of the DOS for energies above is rather subtle while below we see a general shift of weight to lower energies or an increase of the DOS compared to K. Right at the Fermi level and slightly below the change is strongest, where the DOS is significantly reduced. This lowering of the density of states at the Fermi level is due to a lowering of the symmetry of the system at finite temperature which reduces the energetically unfavourable large (Stoner instability). The thermal fluctuations of the DOS are clearly visible with average fluctuations of around the mean value below the Fermi level and above. Right at the fluctuations seem to reach a local maximum and can approach large peak values of about , like in the Fe orbital at eV. For higher pressures we find the fluctuations to be reduced as expected and do not show them here.
IV CONCLUSION
We used density functional theory based Born-Oppenheimer molecular dynamics to study the behavior of BaFe2As2 under external pressure and finite temperature. For low temperatures, our results are in agreement with existing experimental as well as other theoretical results, correctly indicating the transition from the orthorhombic magnetic structure to a tetragonal paramagnetic phase around GPa and the tetragonal to a collapsed tetragonal phase around GPa. In general, the transitions were found to be considerably smoothed out due to finite temperature and the critical pressure for the OT transition was shifted to higher pressures, whereas the TcT transition becomes almost indiscernible. These effects became more enhanced with higher temperature and we found a positive slope of the OT transition line in the temperature-pressure phase diagram. Thus, our results confirm that temperature is an important factor for the structural transitions in BaFe2As2.
We also investigated the electronic structure of BaFe2As2 and the effect of structural fluctuations at finite temperature on the band structure and density of states. At K and GPa we find a fluctuating size of the hole pockets at the and symmetry points. The Fe band shows strong oscillations at with significant variations in the DOS, and Fe and weights are periodically oscillating at the point due to thermal structural fluctuations. At ambient pressure, the fluctuation in the band energies caused by temperature are significant and lead to a thermal broadening of the the Fermi surface. Therefore, compared to zero temperature calculations which miss the dynamical fluctuations and overestimate the DOS at the Fermi level, our results indicate that thermal fluctuations cause non-negligible effects in the electronic structure even at temperatures well below room temperature, which could be important for the interpretation of experiments like angle-resolved photo emission spectroscopy (ARPES).
Acknowledgements.
The authors would like to thank Roser Valentí for useful discussions and gratefully acknowledge financial support by the Deutsche Forschungsgemeinschaft through grant SPP 1458. We thank the centre for scientific computing (CSC, LOEWE-CSC) in Frankfurt for computing facilities.References
- (1) Y. Kamihara, T. Watanabe, M. Hirano, H. Hosono, J. Am. Chem. Soc., 130, 3296 (2008).
- (2) J. H. Tapp, Z. Tang, B. Lv, K. Sasmal, B. Lorenz, P. C. W. Chu, and A. M. Guloy, Phys. Rev. B 78, 060505(R) (2008).
- (3) X. C. Wang, Q. Q. Liu, Y. X. Lv, W. B. Gao, L. X. Yang, R. C. Yu, F. Y. Li, and C. Q. Jin, Solid State Commun. 148, p. 538 (2008).
- (4) Z.-A. Ren, G.-C. Che, X.-L. Dong, J. Yang, W. Lu, W. Yi, X.-L. Shen, Z.-C. Li, L.-L. Sun, F. Zhou and Z.-X. Zhao, Europhys. Lett. 83, 17002 (2008).
- (5) M. Rotter, M. Tegel, D. Johrendt, Phys. Rev. Lett. 101, 107006 (2008).
- (6) X. F. Wang, T. Wu, G. Wu, H. Chen, Y. L. Xie, J. J. Ying, Y. J. Yan, R. H. Liu, and X. H. Chen, Phys. Rev. Lett. 102, 117005 (2009).
- (7) M. Rotter, M. Tegel, D. Johrendt, I. Schellenberg, W. Hermes, R. Pöttgen, Phys. Rev. B 78, 020503(R) (2008).
- (8) Q. Huang, Y. Qiu, W. Bao, M. A. Green, J. W. Lynn, Y. C. Gasparovic, T. Wu, G. Wu, and X. H. Chen, Phys. Rev. Lett. 101, 257003 (2008).
- (9) P. L. Alireza, Y. T. Chris Ko, J. Gillett, C. M. Petrone, J. M. Cole, G. G. Lonzarich, S. E. Sebastian, J. Phys.: Condens. Matter 21, 012208 (2008).
- (10) J. Paglione and R. L. Greene, Nature Physics 6, 645 (2010).
- (11) E. Colombier, S. L. Bud’ko, N. Ni, and P. C. Canfield, Phys. Rev. B 79, 224518 (2009).
- (12) W. Uhoya, A. Stemshorn, G. Tsoi, Y. K. Vohra, A. S. Sefat, B. C. Sales, K. M. Hope, S. T. Weir, Phys. Rev. B 82, 144118 (2010).
- (13) R. Mittal, S. K. Mishra, S. L. Chaplot, S. V. Ovsyannikov, E. Greenberg, D. M. Trots, L. Dubrovinsky, Y. Su, Th. Brueckel, S. Matsuishi, H. Hosono, and G. Garbarino, Phys. Rev. B 83, 054503 (2011).
- (14) M. Tomić, R. Valentí, H. O. Jeschke, Phys. Rev. B 85, 094105 (2012).
- (15) Y. Z. Zhang, H. C. Kandpal, I. Opahle, H. O. Jeschke, and R. Valentí, Phys. Rev. B 80, 094530 (2009).
- (16) W. Ji, X. W. Yan, Z. Y. Lu, Phys. Rev. B 83, 132504 (2011).
- (17) N. Colonna, G. Profeta, A. Continenza, and S.Massidda, Phys. Rev. B 83, 094529 (2011).
- (18) N. Colonna, G. Profeta, A. Continenza, Phys. Rev. B 83, 224526 (2011).
- (19) M. Tomić, H. O. Jeschke, R. Valentí, arXiv:1210.5504 (unpublished).
- (20) S. R. Bahn and K. W. Jacobsen, Comput. Sci. Eng., Vol. 4, 56 (2002).
- (21) G. Kresse and J. Hafner, Phys. Rev. B 47, 558 (1993). G. Kresse and J. Hafner, Phys. Rev. B 49, 14251 (1994). G. Kresse and J. Furthmüller, Comput. Mat. Sci. Vol. 6, 1, 15 (1996). G. Kresse and J. Furthmüller, Phys. Rev. B 54, 11169 (1996).
- (22) P. E. Blöchl, Phys. Rev. B 50, 17953 (1994). G. Kresse and D. Joubert, Phys. Rev. B 59, 1758-1775 (1999).
- (23) J. P. Perdew, K. Burke, and M. Ernzerhof, Phys. Rev. Lett. 77, 3865 (1996). J. P. Perdew, K. Burke, and M. Ernzerhof, Phys. Rev. Lett. 78, 1396 (1997).
- (24) H. Berendsen, J. Postma, W. van Gunsteren, A. DiNola, and J. R. Haak, J. Chem. Phys. 81, 3684 (1984) ,
- (25) K. Koepernik, H. Eschrig, Phys. Rev. B 59, 1743 (1999). [http://www.FPLO.de]
- (26) I. I. Mazin, D. J. Singh, M. D. Johannes, M. H. Du, Phys. Rev. Lett. 101, 057003 (2008).
- (27) W. Ku, T. Berlijn, C.-C. Lee, Phys. Rev. Lett. 104, 216401 (2010).
- (28) E. van Heumen, J. Vuorinen, K. Koepernik, F. Massee, Y. Huang, M. Shi, J. Klei, J. Goedkoop, M. Lindroos, J. van den Brink, M. S. Golden, Phys. Rev. Lett. 106, 027002 (2011).
- (29) L. Rettig, R. Cortés, S. Thirupathaiah, P. Gegenwart, H. S. Jeevan, M. Wolf, J. Fink, and U. Bovensiepen, Phys. Rev. Lett. 108, 097002 (2012).
- (30) I. Avigo, R. Cortés, L. Rettig, S. Thirupathaiah, H. S. Jeevan, P. Gegenwart, T. Wolf, M. Ligges, M. Wolf, J. Fink and U. Bovensiepen, J. Phys. Condens. Matter 25, 094003 (2013).