Limits on the accuracy of isoelectronic gravity measurements at short separation due to patch potentials
Abstract
In force sensing experiments intended to measure non-Newtonian gravitational signals electrostatic patch potentials can give rise to spurious forces, torques, and noise. Undesired patch-induced interactions can lead to systematic effects which limit accuracy, and noise can place lower limits on precision. In this paper we develop the theory for electrostatic patch effects on isoelectronic experiments, where their mean effect is nullified by design. We derive analytical expressions for the patch force and torque power spectrum to estimate the limitations introduced by patch-induced signals.
pacs:
04.80.Cc, 68.47.De, 12.20.FvThe presence of patch potentials on metallic surfaces has important implications in various experiments, including measurements of gravity on elementary particles Fairbank , heating in ion traps Deslauriers06 ; Hite12 , ionization of Rydberg atoms Pu10 , precision tests of general relativity in space Pollack08 ; Everitt11 , measurements of the Casimir force Decca05b ; Sushkov11a ; Mohideen12 ; Garcia12 , and searches for hypothetical forces Fischbach98 ; Long ; Adelberger03 ; Speake04 ; Decca05 ; Kapner05 ; Kapner07 ; Kapitulnik ; Masuda ; Sushkov11b ; Antoniadis12 . Patches lead to interactions that limit the accuracy and precision of such experiments. To date, the theoretical modeling has focussed on quantifying the mean effect of patches on measured signals Speake03 ; Kim10 ; Carter11 ; Behunin12 ; Behunin12b , but an in-depth analysis of the patch force/torque power spectrum is lacking. Here, we develop such a theory and apply it to the analysis of two ongoing experiments that aim to measure new hypothetical forces in which the mean patch effect is cancelled out by construction, but where variations of the surface potential still detrimentally affect the ability to constrain new physics.
These two experiments, one being performed at the University of Birmingham Clive-new-exp and another at IUPUI Ricardo-new-exp , use the isoelectronic technique. In this approach a flat material sample with inhomogeneous mass density is covered with a sufficiently thick metal coating to electrically screen the underlying materials. This has two important consequences: Both (i) the Casimir interaction and (ii) the mean patch force between the coated sample and a force probe are independent of the location of the latter at fixed separation distance. Force signals that depend on lateral displacements can arise not only from the sought after mass-dependent interactions between the probe and the underlying inhomogeneous mass density, but from spatially dependent patch force fluctuations as well. Hence, although the isoelectronic technique eliminates Casimir and mean patch forces, it is still possible that patch effects contribute to the measured signal. In order to quantify the magnitude of patch systematics, we compute the electrostatic torque and force power spectrum for the above two experiments and show that, for reasonable estimations of parameters describing the sample’s surface potentials, patch effects can be an important limitation to accuracy.
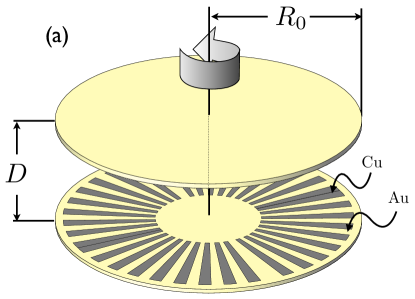
The Birmingham Experiment and Patch Torque: This experiment searches for violations of the inverse square law of gravity by measuring the torque acting between two parallel disks Clive-new-exp . As shown schematically in Fig. 1a, two identical disks (radius mm, thickness 10 m) are fabricated with a pattern of 2048 pairs of gold/copper spokes, and over-laid with a gold film (thickness 1 m, not shown in Fig.1a) for isoelectronic measurements. The 2048 mass pairs are grouped into 16 sectors of alternating phase to provide a further modulation of the signal. In the schematic in Figure 1a, for clarity, only 36 mass pairs are shown in 4 sectors of alternating phase. The lower disk, the test mass, is attached to a torsion pendulum with a superconducting suspension and the upper disk, the source mass, is attached to a micro-positioner. The spacing between the gold surfaces is nominally m. The experiment has been designed to achieve a sensitivity of N m after an integration period of 1 day. The experimental procedure comprises the measurement of the torque as a function of the rotation angle, which should be angle periodic with a frequency determined by the mass density modulation.
To compute the patch torque power spectrum we first obtain an expression for the patch torque as a function of angular displacement between the disks. Given that , we approximate the disks by infinite parallel planes and neglect finite size effects. The electrostatic interaction energy as a function of for given fixed patch potentials on the disks () located at , is
| (1) | |||||
Here , , , is a vector in the plane, , and is the permittivity of free space. The matrix rotates vectors lying in the -plane (see supplementary information). The torque is . Notice that terms containing do not contribute to the torque because they are independent of the relative angle.
Without a precise knowledge of the surface potentials , we proceed by making some statistical arguments. For this purpose we adopt the “quasi-local” model of random surface potentials Behunin12 . A given micro-realization of surface voltages in this model corresponds to a random tessellation of the surface with random and statistically independent voltage assignments to each patch domain. In the following we assume that the patch voltages fluctuate around zero, as a constant background potential does not contribute to the signal in the isoelectronic approach. Provided many elementary patch areas are contained on the plates we can replace the product of surface voltages by the two-point voltage correlation function, (ergodic hypothesis). The angled brackets denote ensemble averaging over all realizations of voltages and geometrical patch layouts. Consequently, and . Because the tesselation of the surface is determined randomly the voltage correlation exhibits translational and rotational invariance, i.e. , with . The explicit form of the quasi-local correlation function is given in Eq.(14) of Behunin12 . For the special case when all patches have the same typical size , and both disks have the same voltage correlation properties, this is given by , where is the root-mean-square of the patch voltage. Unfortunately this correlator is inexpedient for the purposes of computation. Instead, we approximate it by a Gaussian
| (2) |
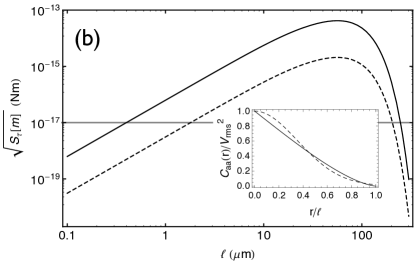
which captures the salient features of the quasi-local correlator and allows an almost analytical treatment (see inset of Fig.1b).
The patch torque signal, although systematic, is random in the experiment. We quantify its variance by means of the patch torque power spectrum defined as
| (3) |
Using the above correlation function we obtain
| (4) | |||||
where is the th order Bessel function of the first kind Gradshteyn (see supplemental information for details). The relevant value of the integer is 2048 because this corresponds to the angular frequency of the mass-modulated signal. Using this expression we compute the expected torque fluctuations as a function of patch size and compare with the design sensitivity of the Birmingham experiment (see Fig.1b). For clean gold surfaces the rms patch torque fluctuations exceed the design sensitivity over nearly the entire range of physical patch sizes, implying that patch effects dominate non-Newtonian signals. Surface contamination is known to lower the typical root-mean-square variations of surface patch potentials Rossi92 . We mimic this effect with a reduced in Fig. 1b, which shows that the patch signal can be lowered by a factor of 20 when the rms potential variation is decreased by a factor of 4.5. This suggests that purposefully contaminating the sample surfaces with adsorbates might beneficially suppress the patch torque power spectrum.
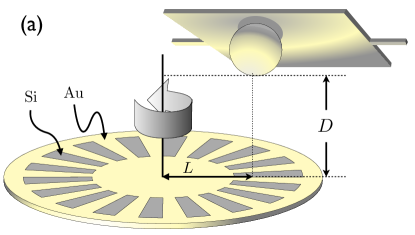
The IUPUI Experiment and Patch Force: In this experiment a Au-coated sapphire sphere (radius m) is glued to a microtorsional oscillator (MTO) Ricardo-new-exp . The sphere-MTO assembly is brought into close proximity to a rotating disk, as schematically shown in Fig.2a. The apex of the sphere is at a distance cm from the axis of rotation. The disk is the source mass formed by () sectors that subtend the same angle, which are alternatively made of Si and Au. All the sectors are covered by a uniform layer of Au (thickness 200 nm), thick enough to make the setup isoelectronic. The disk is set to rotate at an angular frequency , where Hz is the resonant frequency of the MTO-sphere assembly. The experiment is designed to achieve a sensitivity of 0.1 fN with an integration time of 1000 s. The experimental procedure comprises measuring the normal force on the MTO at its resonant frequency as a function of the disk-sphere separation .
The Fourier component of the patch force at the resonance frequency of the MTO adds a systematic signal to the measurement. We estimate the magnitude of this effect by considering the patch force signal as a function of the rotation angle and describe the surface potentials using the approximate correlation function (2). For simplicity, we approximate the disk by an infinite plane, and treat the sphere’s curvature using the proximity force approximation (PFA). The latter assumes that the force between non-planar objects is the sum of the forces between infinitesimal planar sections, and relates the sphere-plane force to the plane-plane energy, , as , where is the area of the plate. In Behunin12b the validity of the PFA for describing patch effects in the sphere-plane geometry was tested and verified for and for a variety of patch sizes (see Fig. 4 in this reference). The plane-plane energy is given by
where now and is a unit vector pointing in the -direction. The origin of the Cartesian coordinate system is centered on the point of closest separation between the sphere and the disk, so that the series of transformations leading to represents a rotation of the plane on an axis centered at . The dots indicate terms independent of the rotation angle that do not contribute to the relevant patch signal. Note that the mean value of the angle-dependent energy is zero since .
The patch force power spectrum is defined as
| (6) |
where is the time period over which the measured signal is averaged, and the time-dependence of the force arises from replacing with in (Limits on the accuracy of isoelectronic gravity measurements at short separation due to patch potentials). The force power spectrum at the resonance frequency of the MTO is then given by
| (7) |
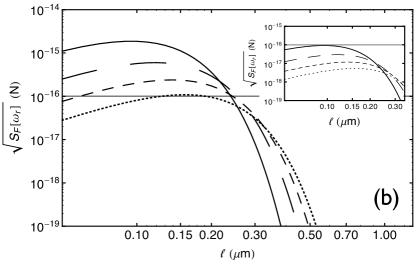
Note that it depends upon the plate area, which is expected given that PFA can be viewed as an area average of the plane-plane force (see supplementary information). The finite size of the sphere limits the sphere-plane interaction to an effective area on the plane. Within the PFA we can estimate it by equating the sphere-plane force to the product of the plane-plane pressure as . Using that , it follows that . Therefore, the relevant area in (7) is . An important observation is that the patch force variance depends upon the rotation frequency (recall ). Hence the influence of patches can be ruled out if one measures the variance of the force signal, assuming no other systematic signals are present, for two different rotation frequencies and their ratio is unity. For example, the ratio of for rotation frequencies and is at nm and for nm patches. By taking the square root of we can estimate the magnitude of the systematic patch force fluctuations at the frequency where the sought-after gravity signal should be present. In Fig.2b the magnitude of the patch signal is computed for several sphere-plate separations. We find that patch force signals are large enough to be measured for clean gold surfaces in the distance range nm and therefore may detrimentally limit constraints on hypothetical new forces. The inset shows that contamination may prevent patches from influencing the IUPUI experiment altogether.
A similar analysis can be performed for the previous isoelectronic experiment done at IUPUI in 2005 Decca05 . In this experiment the inhomogeneous source mass was deposited on a MTO and the sphere was moved from regions of high to low mass density and back, following a periodic motion normal to the MTO and parallel to its axis. The modulation frequencies summed to the resonant frequency of the MTO. The experimental noise was observed to be 0.3 fN with an integration time of 1000 s. The experiment measured a non-vanishing signal (see Fig. 3 of Decca05 ), that was not attributed to a new hypothetical force but to a differential Casimir force arising from a small variation in the height of the coated sample on the MTO. Even in the absence of such height variation, random (although systematic) patch forces could have contributed to the measured signal in Fig. 3 of Decca05 . For this set-up the patch force power spectrum at the MTO’s resonance frequency is given by (see supplementary information)
where is the Fourier transform of (2) and, as before, . In Fig. 3 we plot the magnitude of the expected patch force fluctuations as a function of patch size for different sphere-MTO distances. It is possible that the signal observed in Decca05 is due to patches. The data of Fig.3 together with Fig. 3 of Decca05 can be used to constrain the possible patch sizes which could hypothetically produce the observed force. In order for our model to be compatible with the observations in Decca05 the patches must be smaller than nm for clean gold.

In summary, we have developed the theory for patch effects relevant to isoelectronic experiments aimed at measuring new hypothetical forces, in which the mean effects of patches are nullified by design, but whose fluctuations induce non-zero systematic patch force and torque signals. We have found estimates for the root-mean-square amplitude of such fluctuations, and quantified limits on the accuracy of two proposed isoelectronic set-ups. The application of our analysis to a previous isoelectronic experiment suggests the possibility that part of the force signal could have been due to the presence of patches on the samples. Our analysis indicates that the systematic effects of patches in all these experiments decrease for contaminated samples. Although the patch model employed in this work is inspired by physical arguments, the actual experimental patch distribution need not be precisely described by this model. Consequently, our limits on accuracy to isoelectronic experiments are only qualitative, a quantitative analysis requires the measurement of the patch distribution for the given experimental samples.
RB and DARD acknowledge the support of LANL LDRD program. RSD acknowledges support from the IUPUI Nanoscale Imaging Center, Integrated Nanosystems Development Institute, and the Indiana University Center for Space Symmetries. CCS acknowledges support from STFC (UK).
References
- (1) F. C. Witteborn and W. M. Fairbank, Phys. Rev. Lett. 19, 1049 (1967).
- (2) L. Deslauriers, S. Olmschenk, D. Stick, W. K. Hensinger, J. Sterk, and C. Monroe, Phys. Rev. Lett. 97, 103007 (2006).
- (3) D. A. Hite et al., Phys. Rev. Lett. 109, 103001 (2012).
- (4) Y. Pu, D. D. Neufeld, and F. B. Dunning, Phys. Rev. A 81, 042904 (2010).
- (5) S. E. Pollack, S. Schlamminger, and J. H. Gundlach, Phys. Rev. Lett. 101, 071101 (2008).
- (6) C. W. F. Everitt et al., Phys. Rev. Lett. 106, 221101 (2011).
- (7) R. S. Decca et al., Ann. Phys. 318, 37 (2005).
- (8) A. O. Sushkov, W. J. Kim, D. A. R. Dalvit, and S. K. Lamoreaux, Nat. Phys. 7, 230 (2011).
- (9) C.-C. Chang et al, Phys. Rev. B 85, 165443 (2012).
- (10) D. Garcia-Sanchez, K. Y. Fong, H. Bhaskaran, S. Lamoreaux, and H. X. Tang, Phys. Rev. Lett. 109, 027202 (2012).
- (11) E. Fischbach and C. Talmadge, The Search for Non Newtonian Gravity (AIP Press/Springer Verlag, 1998).
- (12) J. C. Long et al, Nature 421, 922 (2003).
- (13) E. G. Adelberger, B. R. Heckel, and A. E. Nelson, Ann. Rev. Nucl. Part. Sci. 53, 77 (2003).
- (14) C. C. Speake, G. D. Hammond, and C. Trenkel, Gen. Rel. Grav. 36, 503 (2004).
- (15) R. S. Decca et al., Phys. Rev. Lett. 94, 240401 (2005).
- (16) D. J. Kapner, Ph.D. thesis, University of Washington, 2005 (unpublished).
- (17) D. J. Kapner et al, Phys. Rev. Lett. 98, 021101 (2007).
- (18) A. A. Geraci, S. J. Smullin, D. M. Weld, J. Chiaverini, and A. Kapitulnik, Phys. Rev. D 78, 022002 (2008).
- (19) M. Masuda and M. Sasaki, Phys. Rev. Lett. 102, 171101 (2009).
- (20) A. O. Sushkov, W. J. Kim, D. A. R. Dalvit, and S. K. Lamoreaux, Phys. Rev. Lett. 107, 171101 (2011).
- (21) I. Antoniadis et al, Comptes Rendues Physique 12, 755 (2011).
- (22) C. C. Speake and C. Trenkel, Phys. Rev. Lett. 90, 160403 (2003).
- (23) W. J. Kim, A. O. Sushkov, D. A. R. Dalvit, and S. K. Lamoreaux, Phys. Rev. A 81, 022505 (2010).
- (24) J. D. Carter and J. D. D. Martin, Phys. Rev. A 83, 032902 (2011).
- (25) R. Behunin, F. Intravaia, P. A. Maia Neto, D. A. R. Dalvit, and S. Reynaud, Phys. Rev. A 85, 012504 (2012).
- (26) R. O. Behunin, Y. Zeng, D. A. R. Dalvit, and S. Reynaud, Phys. Rev. A 86, 052509 (2012).
- (27) E. C. Chalkley, S. M. Aston, C. J. Collins, M. J. Nelson, and C. C. Speake, Proceedings of the XLVI th Rencontres de Moriond and GPhys Colloquium, E.Auge J. du Marchez and J. Tran Thanh Van editors, The Gioi Publishers p207 (2011).
- (28) R. S. Decca, D. López, D. Krause, and E. Fischbach, in preparation.
- (29) I. S. Gradshteyn and I. M. Ryzhik, Table of Integrals, Series, and Products (Academic Press, London, 1994).
- (30) F. Rossi and G. I. Opat, J. Appl. Phys. D 25, 1349 (1992).