Atmospheric Dependence of the Stopping Cosmic Ray Muon Rate at Ground Level
Abstract
The rate of low energy ( MeV) cosmic ray muons was measured at ground level as a function of several atmospheric parameters. Stopped muons were detected in a plastic scintillator block and correlations were determined using a linear regression model. A strong anti-correlation between fractional changes in the ground-level pressure and stopping muon rate of was found, and also a anti-correlation with the fractional change in atmospheric height at 10 kPa pressure. A weak positive correlation with the 10 kPa temperature was also found, but it was shown not to be statistically significant in our data set. The same analysis was applied to the total rate of all charged cosmic ray particles detected with the same apparatus, and good agreement with previous work was seen. The pressure and height correlation parameters for stopping muons are larger than for the total rate of all charged particles by factors of about 1.6 and 3.7, respectively.
pacs:
96.50.S-, 96.50.sb, 94.20wqI INTRODUCTION
The rate of cosmic rays at ground level varies in time due to changes in both the incident flux at the top of the atmosphere and changes in atmospheric conditions. (For an overview see Ref. Grieder .) Variations in the primary spectrum are thought to be due in part to the indirect effect of the magnetospheric distortions caused by solar activity, and these “Forbush” variations can occur on a timescale of hours and days and be up to about 20% in magnitude. Separately, the evolution of cosmic ray showers in the atmosphere is affected by gas density variations, which are in turn related to measurable pressures and temperatures at various altitudes, as has been discussed in the literature for decades. Incident protons between roughly 15 and 20 km altitude initiate collisions with nuclei that produce primarily pions and spallation nuclear fragments. When this occurs at comparatively higher altitude and at lower air density, the pions are more likely to decay to muons rather than to reinteract to create lower energy pions and nucleonic secondaries. Higher average energy decay muons, though fewer in number, are less likely to suffer enough ionization energy loss to stop and decay before reaching the ground. On the other hand, if the pionic interactions take place at comparatively lower height and higher air density, pions are more likely to reinteract before decaying, ultimately producing a larger number of lower energy muons closer to the ground. The interplay of these processes leads to the well-known broad momentum spread of muons and other particles at ground level Beringer:1900zz , but also to correlations of particle rates and atmospheric conditions.
The ground-level air pressure and cosmic ray rate are anti-correlated, since denser air causes more ionization energy loss to occur, and therefore earlier stoppage of muons. Also, for a given temperature lapse rate, denser air at ground level means a higher altitude at which muons are formed, which in turn gives muons more chance to decay before arriving at the surface.
The mean height of muon formation coincides with roughly the 10 kPa (100 mb) pressure level. Again, an anti-correlation is expected with changes in this height, since formation of muons at higher altitude means that fewer will arrive at ground level. Direct measurements of the height of the atmosphere using balloon-type soundings are available IGRA ; IGRAdata . We used the 10 kPa pressure-level height to analyze our data. We then studied the variability of the results with respect to this choice, as will be shown.
The temperature of the atmosphere at the mean muon production altitude may be supposed to affect the muon rate in the following way: if the air is warmer it is less dense (at fixed pressure), so the pions have greater probability of decaying to muons before they reinteract. This would favor creation of higher average energy muons that reach ground level, and also lead to larger numbers that penetrate deep underground. A positive correlation with temperature is seen underground, for example in Refs. Barrett ; Cini ; Adamson:2012gt . But the expected effect at ground level is less definite, since lower average energy muons created from pions in a denser atmosphere may be more copious in number at the surface, formed together with fewer higher energy muons. Indeed the temperature correlation was too small to measure in Ref. Cotton for vertically incident muons in a sea-level telescope of counters.
Shower creation and propagation can be modeled Dorman ; Adamson:2012gt or simulated in detail, including the correlations among the various parameters characterizing the atmosphere, but this was not the goal of the present study. Our goal was the experimental determination of the correlation among several atmospheric parameters and the ground-level stopping muon rate. We also measured the parameters of the total rate of charged particles to see whether they are measurably different. The properties of the atmosphere that we examined in relation to the particle rates were as follows. First, we used the ground-level air pressure, , measured at the site of the detector. Second, we used weather data giving the height of the atmosphere at certain specific pressures, , via public data IGRA . Third, from the same weather data set, we used the temperature of the atmosphere, , at certain specific pressures. Finally, we looked for correlations with the low-altitude humidity of the air, but these were found to be nonexistent in this work. Atmospheric pressure at any altitude is proportional to air density, as is the inverse of air temperature, and it is the density that ultimately regulates the evolution of cosmic ray showers. Our results were more satisfactory, however, when looking for the separate correlations with the given parameters.
In order to investigate the rate dependence of cosmic rays and stopping muons, the following linear regression model was adopted. As discussed in the next section, a seven week span of time during which the data did not exhibit drastic fluctuations in rate , was defined by inspection of the data from a five month long run. For that span of time the average values of all variables in the data were established (bracketed symbols). The expression for relating the variables was taken to be
| (1) |
where , , and are unitless coefficients of fractional change, and the other variables were defined above. This expression can be viewed as the linear part of the Taylor series that should, to good approximation, capture whatever the effective relationship among the given variables is. A least-squares fit was used to determine , , and , and reduced gave a measure of the goodness of the fits. The parameters are assumed to be uncorrelated for the purpose of comparing our results to historical precedents for non-stopping muons. Note that in the literature there are various names and formulations for these coefficients. For example, is sometimes called the “negative partial barometer coefficient” and reformulated in units of %/cm Hg. If and are not fitted, it is called the “total barometer coefficient”.
II APPARATUS AND PROCEDURES
The detector for both stopping muons and for counting the total rate of through-going cosmic rays is shown in Fig.1. It consisted of a 30 cm cube of polystyrene scintillator, viewed from opposite sides by two 5” diameter photomultipliers (PMT). For vertically impinging particles, this detector stopped muons of kinetic energy less than 100 MeV (177 MeV/c), while for oblique tracks the maximum energy was 150 MeV (233 MeV/c). This defined what we mean by low-energy stopping muons, of which we determined the rate variations. There were no separate trigger counters to select vertically-moving particles, so this apparatus accepted the full-sky angular distribution of arriving cosmic rays. The equipment was located under a thin metal roof in a building with a largely unobstructed view of the full sky.

The signals from each photomultiplier were sent to discriminators which formed logic pulses from all input signals larger than a pre-set threshold of 120 mV. The discriminator signals were sent to a coincidence unit to create pulses only when signals from both tubes were present within a 20 nsec time window, thus reducing noise and allowing only one pulse per particle. These pulses were used for determining the muon lifetimes with use of a time to digital converter (TDC). The data were accumulated event-by-event using a National Instruments data acquisition (DAQ) unit (Model NI USB-6221) and a LabVIEW-based control system. A stopping muon candidate was defined by a pulse pair with a TDC “Start” pulse followed by any “Stop” pulse within 20 sec. Pulse pairs with a longer time interval were plentiful, caused by uncorrelated cosmic ray particles, and these were counted but not individually recorded. The PMT singles rates were Hz, the coincidence total count rate for the experiment averaged 24/sec, while the rate of stopping candidates was about 6/min. For each candidate stopping muon event, the following parameters were recorded: a time-stamp, the decay time in sec with 12.5 nsec (80 MHz) time resolution, three redundant pressure readings, and the total of cosmic ray event pairs detected up to that moment.
The ground-level pressure was measured simultaneously with the cosmic ray data using the same LabVIEW-based DAQ system. We used three single-chip barometers (Motorola MPX4115A) to record the air pressure whenever a stopped-muon event occurred. The average of the three readings was used as the final value for the pressure. We used METAR weather data from the Allegheny County Airport (KAGC) located 16 km away, in order to check the accuracy of the lab pressure data.
The atmospheric data at high altitude was obtained using publicly available Integrated Global Radiosonde Archive (IGRA) data IGRAdata . A parser of the extensive ASCII data set was written to extract the needed pressure, altitude, temperature, and time information. The data from the in-lab detectors and the atmospheric data were merged together chronologically in the off-line analysis. The IGRA data was available in 12 hour intervals. Initially we binned the muon data in one-hour intervals to get the average pressure and the number of both stopping and total events. These data were then rebinned, as needed, to match the available IGRA atmospheric data. Temperature and atmospheric height data were available in this data set at only a small set of pressures. One of them was 10 kPa, which occurs at about 16.6 km altitude, where primary cosmic rays have started to shower. This was the pressure level selected by us to fit our model.
The experiment ran for 21 weeks from July 5, 2011 to December 1, 2011, with some gaps for equipment repair. A total of stopping muons were detected in this time, for an average rate of close to 350 per hour. At the low muon momenta considered in this measurement, there is a slight (%) excess of over particles Beringer:1900zz . Our apparatus did not distinguish between the two. Stopped events are known to undergo atomic capture on carbon atoms in the scintillator, leading to a reduced lifetime due to the weak process. The value is sec Measday . The events decay with their free-space lifetime of sec Beringer:1900zz . The measured muon lifetime from the effective exponential decay distribution was sec, between the two other values, as expected. This verified that our data sample consisted of muons that stopped and decayed. Within the 20 sec time window for selecting stopped muons, the fraction of uncorrelated non-stopping background track pairs was 11.5%. This background was subtracted in the following stopped muon analysis.
III RESULTS
Figure 2 shows the resultant fractional rate variation of stopping muon candidates over the entire data period, together with the model fit discussed below. The rate is presented as the fractional deviation from the mean of the fitted period between July 19 to September 8, 2011. The average variation during this time is zero, by construction. The error bars are purely statistical. One sees day-to-day fluctuations of about %, as well as larger excursions outside the fitted region of up to 20%.
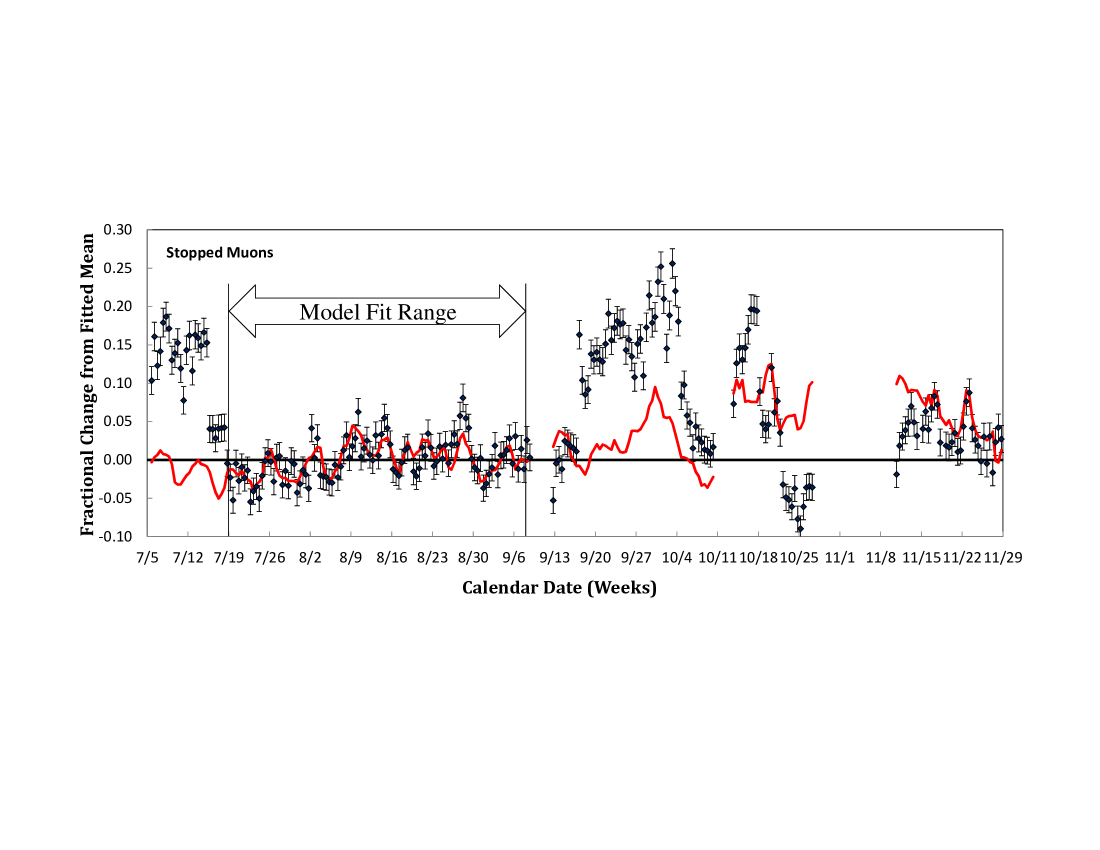
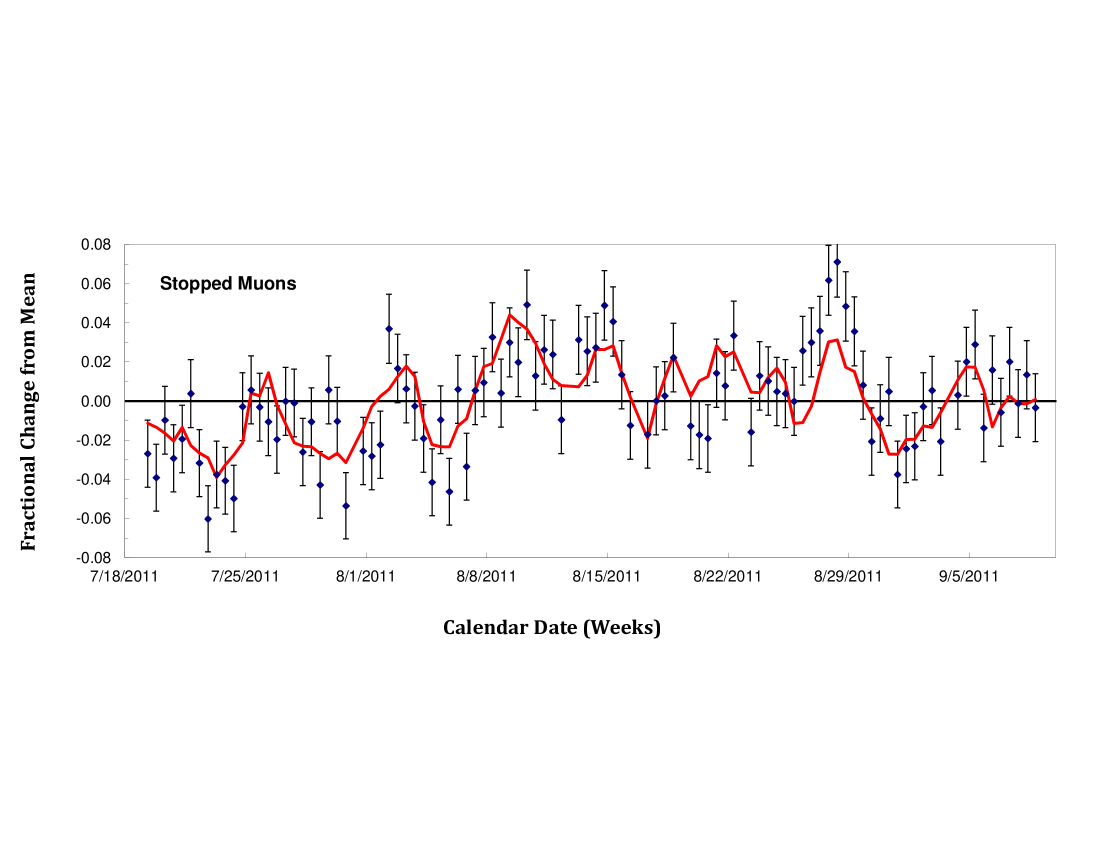
In seeking correlations with atmospheric data, it was found that the large jumps visible in the second week and again after the eleventh week were impossible to match. We ascribed these large jumps to changes in “space weather” of the Forbush variety that were outside of our scope to track and model. An interval of data that was comparatively devoid of drastic fluctuations in rate was used to fit to the model. This was the seven week period marked in the figure as “Model Fit Range”. The data and the model fit (Eq. 1) from this restricted range of data are shown in Fig. 3. The solid red curve in both figures is the result of the regression model fit. Each of the three parameters in the model is a unitless scale factor relating a fractional change in atmospheric condition to a fractional change in particle rate, as seen in Eq. 1. A least-squares fit optimized parameters for the ground-level pressure, for the 10 kPa atmospheric height, and for the 10 kPa temperature. The resultant values of those parameters are given in Table 1. The uncertainties on the parameters come from the diagonal elements of the error matrix associated with the least-squares fit. Our data fits the regression model ansatz with good agreement, as demonstrated by the reduced chi-squared value of 1.07, allowing an rms spread of . The Pearson’s correlation coefficient is 0.73, which is significant in view of the large statistical uncertainties on the data points.
| Parameter | Eq. 1 | Stopped | Total Particles |
|---|---|---|---|
| Muons | |||
| Pressure | |||
| Altitude | |||
| Temperature | |||
| = 1.07 | = 1.09 |
| Parameter | Eq. 1 | Stopped | Total Particles |
|---|---|---|---|
| Muons | |||
| Pressure | |||
| Altitude | |||
| = 1.11 | = 1.13 |
| Parameter | Eq. 1 | Stopped | Total Particles |
| Muons | |||
| Pressure | |||
| = 1.74 | = 2.22 |
The visual appearance of the fit within the fitted range is good. We note that there is an anti-correlation of surface pressure with stopping muons rate, since is large and negative. There is an anti-correlation of similar size with atmospheric height, as given by . Also, there is a weaker positive correlation with temperature at the 10 kPa level, as given by with a fairly large uncertainty.
We tested the significance of the fit by repeating it with fewer parameters. The result with the temperature factor excluded is shown in Table 2. The quality of the fit, as estimated by the reduced , is almost the same, so we can conclude that the temperature of the atmosphere at the altitude of 10 kPa pressure is a statistically insignificant variable. Parameter hardly changes, but gets larger. There was scarcely any visual difference between the curves produced by these two fits. These resultant values are our best result for this measurement.
To further test the model we restricted the parameters again to use only for the ground-level pressure, excluding the height parameter . This is shown in Table 3. The quality of the fit is now significantly worse, as seen in the reduced , and the visual appearance of the fit was poor. Thus, ground level pressure alone is not enough to accurately track the rate of stopping muons.
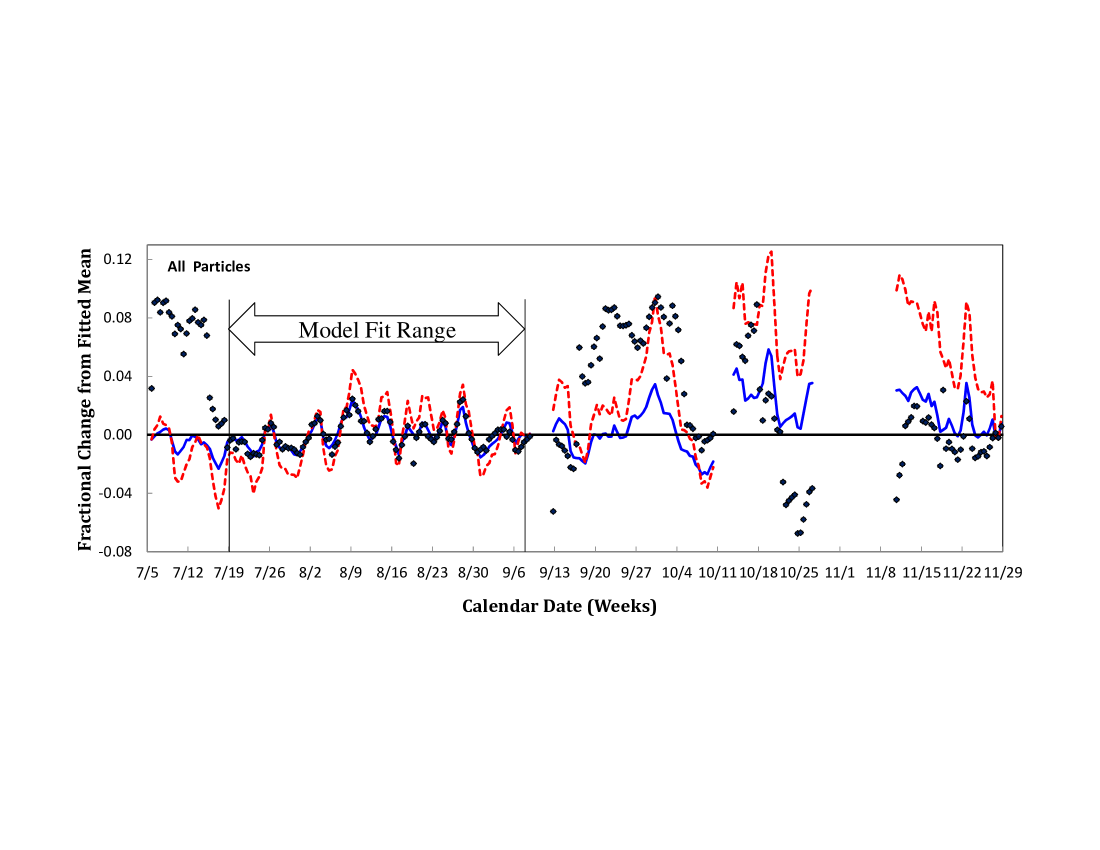
We used the same method to fit our data for the total event rate. This total rate at ground level in this detector consists mostly of higher momentum muons (that do not stop), but with minor contributions from electrons, protons, and neutrons. The total rate includes the very small fraction () of stopped muon rate. The resultant fit is shown in Fig. 4, where one sees immediately the effect of the much higher statistics when counting all particles rather than just the lowest energy muons. The fractional change in total particle rate is now seen to vary quite smoothly on the timescale of days and weeks, albeit with larger variations of order 10%. There are two model curves superimposed. The dashed red curve uses parameters from Table 1 obtained for the fit to stopped muons as per Fig. 3. The solid blue curve shows the new fit to the total particle rate with parameters also shown in Table 1. Within the Model Fit Range, the solid blue fit line is a close match to the data. Outside this range one sees again the large fluctuations we ascribe to space weather conditions that we could not track or reproduce.
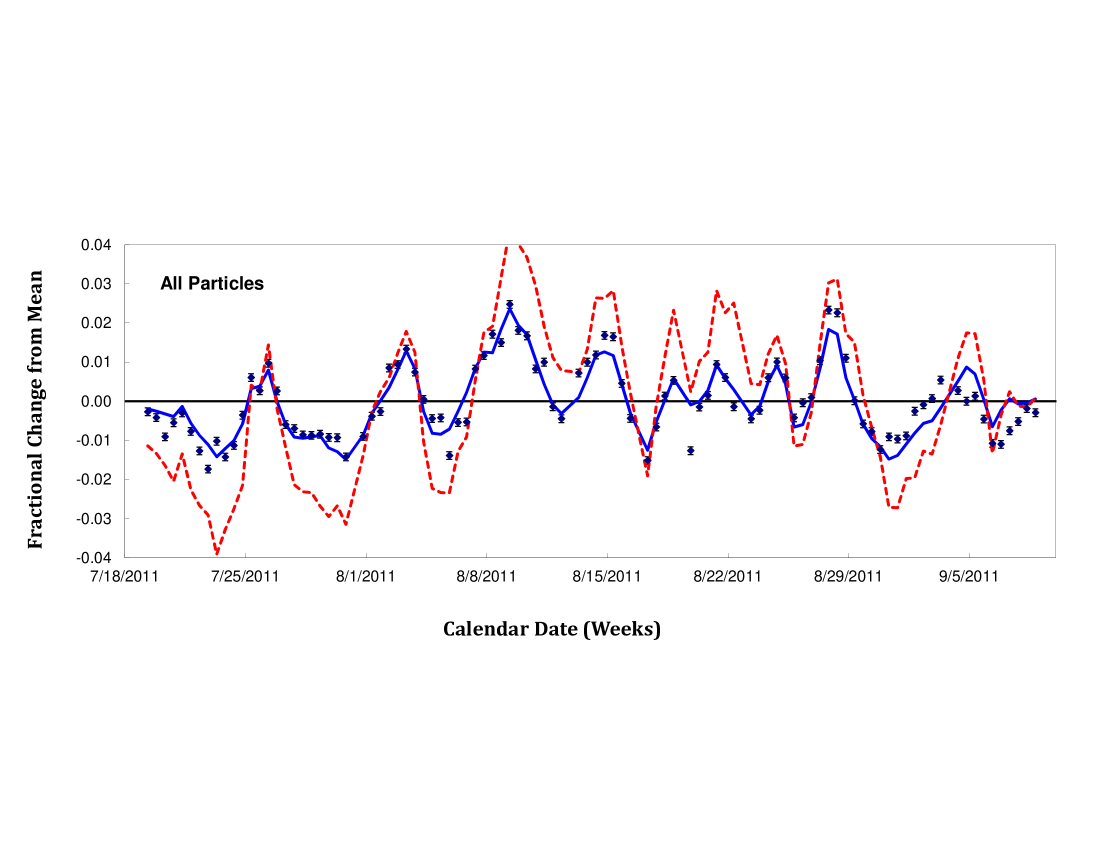
In fact, the fit to the regression model within the fit range led to a large value of of about 15. The statistics of this data set was so high that small fluctuations of unknown origin, presumed to be “space weather”, were evident. In order to compute legitimate uncertainties on the fit parameters in the least-squares algorithm, we increased the point-to-point uncertainties from 0.0010 to 0.0035 to account for these fluctuations. This procedure did not affect the parameter values but allowed for the estimation of reasonable uncertainties for the correlation parameters. The fit result in the Model Fit Range is shown in Fig. 5, showing data points with their unmodified statistical uncertainties. The dashed blue curve fits the data very well. In this case the Pearson’s correlation coefficient is 0.92, also indicating a very good fit.
It can be seen that the amplitude of the fractional changes of the stopped muon rate (dashed red curve) is larger than the amplitude of the total particle rate changes (solid blue curve). However, they track each other very well over time. The fit parameters for the total particle rate are included in Tables 1, 2 and 3. We see that is about 50% larger for the stopped muons, while is about four times as large. Taking into account the uncertainties on the values, is larger for stopping muons at the “1.8 sigma” level, and at the “5 sigma” level in Table 2. From the figure, there can hardly be any doubt that the atmospheric dependencies indeed differ between the total particle rate and the stopping muon rate. Thus we conclude that the lowest energy cosmic ray muons, the ones that stop in this detector, are several times more sensitive to ground-level pressure and atmospheric height variations than the total particle rate.
It will be noted that our results do not include the ground level humidity measurements. Using local METAR data we found that the drastic variations in humidity from day to day and week to week were not correlated in any detectable way to the stopping muon rate. Thus, we simply report that there was no measurable correlation.
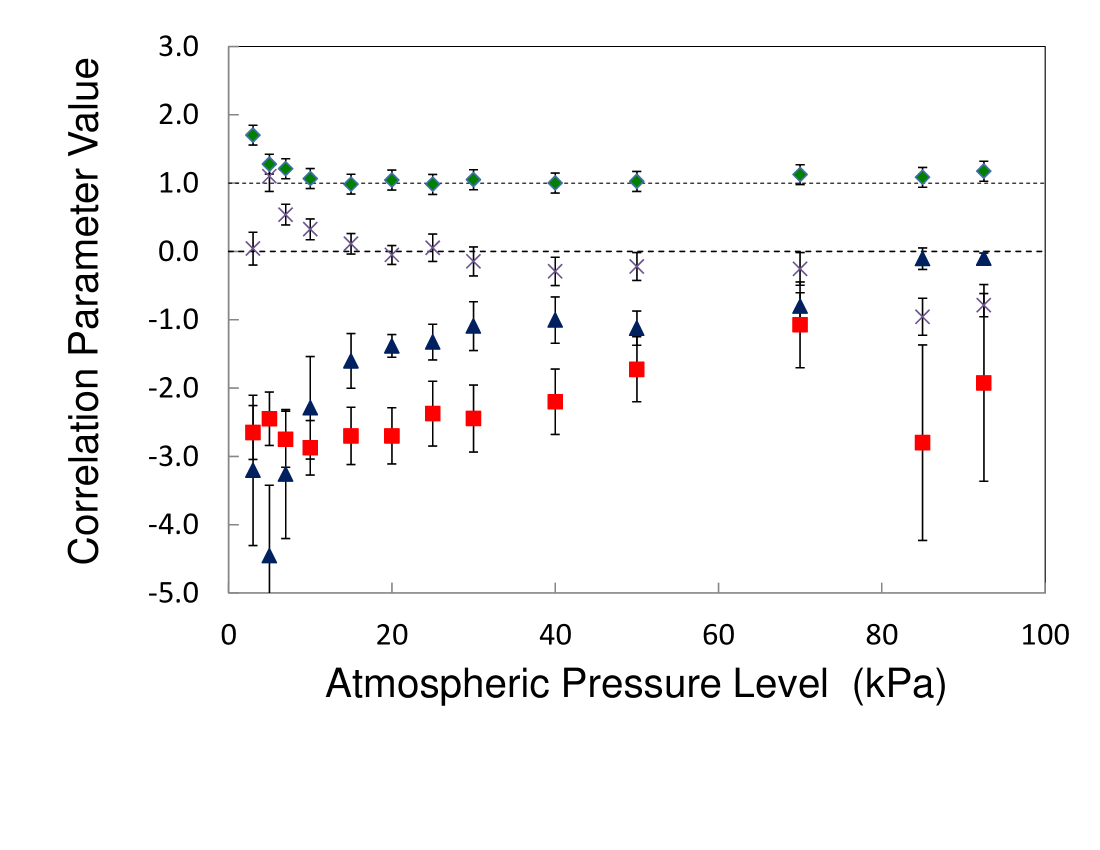
Returning to results for the stopped muons, we assumed initially that the height and the temperature of the atmosphere at 10 kPa pressure was the optimal single level at which to determine the correlations. This was based on the knowledge Grieder that this pressure level in the atmosphere is dominant in the formation of cosmic ray showers. However, one clearly expects the full development of muon showers to depend on the density of the atmosphere throughout an extended region, for which a full theoretical and numerical treatment is required Dorman . Within the limited scope of our work we selected other reference altitudes from the IGRA data at which to compute the correlations for stopped muons to test the 10 kPa assumption. The results are shown in Fig. 6. As can be seen, the values remain statistically close to unity except for the high and low extremes of altitude. This suggests that the parametrization we used works about equally well from to kPa, albeit with differing values for , , and , wherein no single altitude seems more sensitive than the others. We believe that the fit worsens at the high altitude limit, below 10 kPa, because the height and temperature there are increasingly above where the atmosphere has affected the primary cosmic particles. We believe that the increased uncertainties at the lowest altitudes are due to a breakdown of our assumption that the pressure measured in the laboratory is independent of the parameters measured by the IGRA radiosondes. The model fails at low altitudes where the quantities are closely correlated. We note in the figure that the pressure parameter tends to be smaller at lower altitudes. This is consistent with the trend reported in an early study for the total particle rate discussed in Ref. Janossy .
| Parameter | Eq. 1 | Bernero | Trumpy | Chasson | Shamos | Cotton | Grieder | Fenton |
|---|---|---|---|---|---|---|---|---|
| (This Paper) | Ref.Trumpy | Ref.Chasson | Ref.Shamos | Ref.Cotton | Ref.Grieder | Ref.Fenton | ||
| Stopped Data | ||||||||
| Pressure | ||||||||
| Altitude | ||||||||
| Temperature | ||||||||
| Total Rate | ||||||||
| Pressure | ||||||||
| Altitude | ||||||||
| Temperature |
In comparing the results of this measurement to previous work, we have always converted the older results to our preferred unitless parameterizations for and as in Eq. 1. We used 16.6 km as the mean 10 kPa height of the atmosphere and 207 K as the mean temperature at this height. One of the previous experiments comparable to this one was performed by Trumpy and Trefall Trumpy . At ground level, they used stacks of counters separated by 10 or more centimeters of lead to record the total cosmic ray rates, and correlated these rates to the same atmospheric parameters as we do in these measurements. Table 4 includes their data for the total rate. One sees that their results agree with ours within errors for the total particle rate. They then used a model to subtract the “hard” component, defined as tracks passing through at least 10 cm of lead, to arrive at a “soft” component. This soft component is not the same as our stopped muon measurement, but it is related. Additional “soft” contributions to their result could arise from electrons from in-flight muon decay, electrons from knock-on processes, and from very slow hadrons of all sorts. Nevertheless, we can compare their “soft” component with our results, and this is also shown in Table 4. The values for the pressure correlation are in agreement, but they were unable to obtain meaningful results for and .
Another of the scarce measurements of the “soft” cosmic ray correlations was by Chasson Chasson . Using stacks of Geiger counter telescopes with and without lead and iron absorbers between detectors, he factored into “hard” and “soft” components. His result is included in Table 4. For the total particle rate his results are in good agreement with ours, within uncertainties. For the stopped muon data he did not measure all three parameters, but gave only a value for the total barometer version of coefficient . It is in agreement with ours. He did not measure stopping muons directly, as we have.
We also mention the relevant results of Shamos and Liboff Shamos . On the ocean surface they measured using a stack of ionization counters, so that, with some model assumptions, they factored into “hard” and “soft” components. Their result is included in Table 4. Unfortunately, they did not estimate uncertainties and they measured only the “total” coefficient, not the “partial” coefficients as we have. Thus, the poor agreement is difficult to evaluate. Again, they did not measure stopping muons directly, as we have.
Results from Cotton and Curtis Cotton show poor to fair agreement with our results for the total particle rate. Their measurements were made at ground level using a stack of counters to select only the vertical component of the cosmic rate. Note that their temperature correlation is compatible with zero. Taking our experiment and these earlier experiments together, all give barely significant positive values for ; thus, there may be a hint for a small positive temperature correlation for the total particle rate at ground level.
The text by Grieder Grieder offers a set of total rate correlation parameters of unstated provenance and without uncertainty estimates which are in the same range as the other results in the table, including ours.
For comparison of ground level and underground measurements we consider results from Fenton et al. Fenton taken at 42 meters water equivalent depth, shown in the last column of Table 4. For those muons, estimated to have at least 15 GeV energy, the correlations with mean production height and surface pressure are smaller than our results by roughly an order of magnitude, and their small temperature coefficient is consistent within errors. At greater depths it is has been shown Adamson:2012gt that the atmospheric effective temperature is the main correlator with high energy muon rate. Our small value for parameter at the surface is thus consistent with this picture.
IV CONCLUSIONS
We have measured the rate of stopping muons at the surface of the earth and compared it with the rate of all charged particles. As was shown in Tables 1, 2 and 3, the atmospheric coefficients for the low energy stopping muons are significantly larger than for all particles. The linear regression model we have used represents both data sets well, in the sense that the fits to the data capture the behavior over a several-week period of low overall cosmic ray fluctuations, with good fidelity. The results are consistent with the picture that low energy muons, the least penetrating portion of the cosmic ray spectrum, are most sensitive to variations in atmospheric pressure, , and the upper-level density related to . We found no significant correlation with temperature at the mean production height, estimated using . Our results were compared to previous measurements and found to be in fair to good agreement for the total particle rate. We were unable to find any previous measurements of the correlations for the stopping muon rate.
It is also clear, as seen in Figures 2 and 4, that there are large and sudden departures from this model, which we ascribe to changes in the rate of incoming primary cosmic rays, albeit without independent evidence that this was the case. In the same figures it is seen that the model trends were sometimes qualitatively consistent with the rate changes in time periods not included in the fit region. However, certain time intervals exhibited unexplained step-like transitions in particle rates not accounted for in our phenomenological atmospheric weather data fit. Overall, we believe our most significant result is the set of correlation parameters for the rate of low energy muons that are stopped at ground level. We have shown that these correlations are significantly larger than those for the total rate of all cosmic ray particles.
Acknowledgements.
We thank Professor Barry Luokkala and Mr. Albert Brunk for support in obtaining some of the equipment needed for this study.References
- (1) P. K. F. Grieder, Cosmic Rays at Earth, (Elsevier Press, Netherlands, 2001).
- (2) J. Beringer et al. [Particle Data Group Collaboration], “Review of Particle Physics (RPP),” Phys. Rev. D 86, 010001 (2012).
- (3) I. Durre, R. S. Vose and D. Wuertz, “Overview of the Integrated Global Radiosonde Archive” Journal of Climate 19, 53 (2006).
- (4) National Climate Data Center, data set 72520, available at www.ncdc.noaa.gov/oa/climate/igra .
- (5) P. H. Barrett, L. M. Bollinger, G. Coccioni, Y. Eisenberg, and K. Griesen, “Interpretation of Cosmic-Ray Measurements Far Underground,” Rev. Mod. Phys. 24, 133 (1952).
- (6) G. Cini Castagnoli and M. A. Dodero, “Temperature Effect of the Muon Component Underground and Pion Attenuation Length,” Nuovo Cimento 51, 525 (1967).
- (7) P. Adamson et al. [MINOS Collaboration], “Measurements of atmospheric neutrinos and antineutrinos in the MINOS Far Detector,” Phys. Rev. D 86, 052007 (2012).
- (8) E. S. Cotton and H. O. Curtis, “Effects of the Atmosphere on the Penetrating Component of the Cosmic Radiation,” Phys. Rev. 84, 840 (1951).
- (9) L. I. Dorman, Cosmic Rays in the Earth’s Atmosphere and Underground, (Kluwer Acad. Pub., Netherlands, 2004).
- (10) D. F. Measday, “The Physics of Muon Capture”, Physics Reports 354, 243 (2001).
- (11) L. Janossy, Cosmic Rays, p196, (Oxford Clarendon Press, London, 1950).
- (12) B. Trumpy and H. Trefall, “On the Correlation Between the Cosmic Ray Intensity and the Meteorological Conditions” Physica 19, 636 (1953).
- (13) R. L. Chasson, “Cosmic-Ray Intensity Fluctuations at Sea Level” Physical Review, 96, 1116 (1954).
- (14) M. H. Shamos and A. R. Liboff, “A New Measurement of the Intensity of Cosmic-Ray Ionization at Sea Level” Journal of Geophysical Research, 71, 4651 (1966).
- (15) A.G. Fenton, R.M. Jacklyn and R.B. Taylor, “Cosmic Ray Observations at 42 m w.e. Underground at Hobart, Tasmania” Nuovo Cimento, 22, 287 (1961).