direct diagnostics of forming massive stars:
stellar pulsation and periodic variability of maser sources
Abstract
The 6.7 GHz methanol maser emission, a tracer of forming massive stars, sometimes shows enigmatic periodic flux variations over several days. In this Letter, we propose that this periodic variations could be explained by the pulsation of massive protostars growing under rapid mass accretion with rates of . Our stellar evolution calculations predict that the massive protostars have very large radius exceeding at maximum, and we here study the pulsational stability of such the bloated protostars by way of the linear stability analysis. We show that the protostar becomes pulsationally unstable with various periods of several days, depending on different accretion rates. With the fact that the stellar luminosity when the star is pulsationally unstable also depends on the accretion rate, we derive the period-luminosity relation , which is testable with future observations. Our models further show that the radius and mass of the pulsating massive protostar should also depend on the period. It would be possible to infer such protostellar properties and the accretion rate with the observed period. Measuring the maser periods enables a direct diagnosis of the structure of accreting massive protostars, which are deeply embedded in dense gas and inaccessible with other observations.
Subject headings:
stars: massive — stars: oscillations — masers1. Introduction
Massive stars have significant impacts on the interstellar medium through various feedback processes such as supernova explosions, stellar winds, and ultraviolet radiation. These feedback processes would be also important for shaping the stellar initial mass function because stars are mostly formed in clusters including massive stars (e.g., Lada & Lada 2003). However, our understanding of the massive star formation is still limited with observational difficulties, one of which arises from the fact that forming massive stars are deeply embedded in obscuring dense gas.
Observing maser emission is one of the possible methods to see the vicinity ( AU) of forming massive stars because of the high brightness. It is known that the 6.7 GHz methanol maser emission can be thought to be often associated with circumstellar disks around forming massive stars (e.g., Norris et al. 1993; Bartkiewicz et al. 2009; Sanna et al. 2010). Some of the methanol masers show periodic flux variations over days (e.g., Goedhart et al. 2004, 2009). Since the 6.7 GHz methanol masers are radiatively pumped by infrared emission of warm dusts ( K; Cragg et al. 2005), the periodicity could reflect the luminosity variation of nearby forming massive stars or accretion disks.
Several authors have proposed different explanations for this periodic flux variations, e.g., colliding-wind binary (van der Walt 2011), and periodic accretion onto binary systems (Araya et al. 2010). However, these binary-based models do not explain why the periodic variations shorter than days have not been found yet, despite the fact that a number of OB star eclipsing binaries have the periods of days (Harries et al. 2003; Hilditch et al. 2005)
In this Letter, we propose an alternative picture that the periodic variability of the maser emission can be due to the pulsation of protostars growing via rapid mass accretion with , which is expected in the massive star formation (e.g., Osorio et al. 1999; McKee & Tan 2003; Zhang et al. 2005; Beltrán et al. 2006; Krumholz et al. 2009). Our previous work shows that, by numerically modeling the stellar evolution, the massive protostar should have the large radius exceeding with such the high accretion rate (Hosokawa & Omukai 2009; Hosokawa et al. 2010, hereafter HO09 and HYO10 respectively). We here examine the pulsational stability of the bloated massive protostars with the linear stability analysis, and show that the observed periodicity of days can be well explained with the stellar pulsation. Our models predict that, with the observed period of the pulsation, we could infer the radius, mass, and luminosity of the protostars as well as the accretion rate onto the protostar. Measuring the maser periods would thus make a direct diagnosis of the central small-scale ( a few AU) structure of forming massive stars, which is beyond observations in the optical and infrared bands.
2. Pulsational instability of accreting massive stars
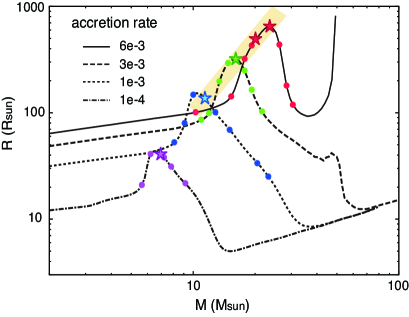
We study the pulsational stability of massive protostars growing at constant accretion rates of . We here adopt the protostellar models with spherical accretion taken from HO09. In Section. 3, we will discuss that the effects of the accretion geometry (disk accretion) does not change the qualitative results from the spherical accretion case. Figure 1 shows the evolution of the stellar radius as the stellar mass increases with different accretion rates. The outline of the evolution is briefly summarized as follows (see HO09 for the details). Initially, the stellar radius gradually increases with increasing the stellar mass. After this stage, e.g., for , the protostar contracts by losing its energy via radiation (Kelvin-Helmholtz or KH contraction). The stellar central temperature increases during this contraction stage and finally reaches K. The hydrogen burning is ignited, and the protostar reaches the zero-age main sequence (ZAMS, except with ). After this point, e.g., for , the stellar radius increases again as the stellar mass increases. We here note that the maximum stellar radius during this evolution is larger with the higher accretion rate. This is because the accreting gas has the higher specific entropy with the more rapid mass accretion, which leads to the higher average entropy in the stellar interior (also see HO09). As a result, the maximum stellar radius exceeds with the high accretion rates .
We apply the linear stability analysis to the above protostellar models (see e.g., Cox 1980; Unno et al. 1989; Inayoshi et al. 2013 for the details). We here consider radial (spherical) perturbations with the time dependence of , where is the eigen frequency, is the frequency of the pulsation, and is the growth or damping rate of the perturbation. The protostar is pulsationally stable (unstable) with the positive (negative) . If unstable, the perturbation grows until reaching the non-linear regime, where the pulsation energy is dissipated by shock waves near the stellar surface. The dissipated energy is partly converted into the kinetic energy of periodic outflows (e.g., Appenzeller 1970; Yoon & Cantiello 2010).
Symbols in Figure 1 represent the stellar models for which we conduct the linear stability analysis. Our calculations show that the protostar becomes pulsationally unstable only when the stellar radius maximally expands at a given accretion rate. This instability is caused by the mechanism in the He+ ionization layer, where the radiative energy flux is blocked and converted into the pulsation energy (e.g., Cox 1980; Unno et al. 1989). In the KH contraction stage, the stellar surface temperature increases and the He+ ionization layer disappears. The protostar is consequently stabilized and the pulsation ceases. Although the protostar would be also unstable with the lower accretion rates (), the growth time is much longer than the duration for which the star is in the instability strip ( yr). The perturbation does not grow enough to cause the stellar pulsation in this case. The instability strip thus does not extend for , where the star becomes unstable with the lower accretion rate (see Figure 1).
3. Period-Luminosity relation
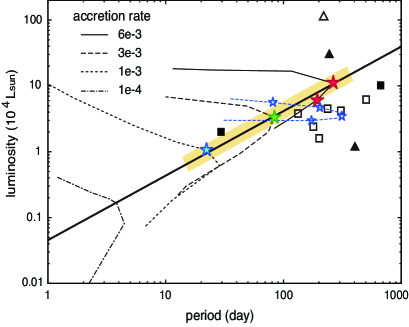
Figure 2 shows the evolution of the pulsation period and stellar luminosity in the examined cases. In each case, the stellar luminosity monotonically increases as the stellar mass increases. The pulsation period increases with the stellar mass in the early expansion phase, and decreases in the later KH contraction phase. The protostar becomes pulsationally unstable around the turning point of the period, which corresponds to that of the stellar radius as seen in Figure 1.
Figure 2 also present the observed sources with periodic flux variations in the 6.7 GHz methanol masers, whose parameters are summarized in Table 1. The luminosities of these sources are estimated with the far-infrared data of Infrared Astronomical Satellite (IRAS) following Casoli et al. (1986) and Guzmán et al. (2012). We see that the pulsation periods of the unstable models are several days, the same order of the observed periods of the maser sources. Although the pulsation period is shorter than days with the low accretion rates , the instability strip does not cover such cases as explained above. This explains well why the maser sources which have such the short periodic variability have not been observed.
Our calculations predict that both the period and luminosity of the pulsationally unstable protostars increase with the accretion rate. We thus predict a positive correlation between the maser periodicity and the stellar luminosity. We fit the unstable models by a single power law and obtain the period-luminosity (P-L) relation (thick line in Fig. 2)
| (1) |
which is similar to that of the Cepheids (), which is well-used as a cosmic distance ladder (e.g., Tammann et al. 2003; Sandage et al. 2004). The above P-L relation and the instability strip can explain the distribution of the observed parameters in the periodic methanol masers within errors of an order of magnitude. We show that, in Appendix A, a similar P-L relation is analytically derived.
The instability strip shown in Figures 1 and 2 is not broad. The duration for which a protostar spends in the strip, i.e., the prospective lifetime of each periodic maser source is only years. This actually matches the rarity expected with observations. The number of 6.7 GHz methanol masers observed ever is (e.g., Pestalozzi et al. 2005; Caswell et al. 2011; Green et al. 2012), and 56 masers of that have been monitored for more than a year at intervals shorter than a week or month (Goedhart et al., 2007, 2009; Araya et al., 2010; Szymczak et al., 2011). About % of such the sources show the characteristic periodic variabilities (Table 1). Figure 2 might suggest that our models are more applicable to the sources with the shorter periods, e.g., year, which is only % of the monitored sources. Since the appearance time of the methanol masers during massive star formation is thought to be yr (van der Walt, 2005), the lifetime of the periodic maser sources should be as short as expected with our calculations.
| Source | Ref. | ||||
| (Galactic name) | [day] | [kpc] | [] | ||
| 009.6210.196 | 244 | 5.2 | 30.0 | 1 | 6 |
| 012.6810.182 | 307 | 4.5 | 4.2 | 2 | 7 |
| 012.8890.489 | 29.5 | 2.34 | 2.0 | 3 | 8 |
| 022.3570.066 | 179.2 | 4.6 | 2.4 | 4 | 9 |
| 037.5500.200 | 237 | 5.0 | 4.5 | 5 | 9 |
| 188.9460.886 | 404 | 2.10 | 1.2 | 1 | 10 |
| 196.4541.677 | 668 | 5.28 | 10.2 | 2 | 11 |
| 328.2370.547 | 220 | 12.0 | 117.2 | 1 | 9 |
| 331.1320.244 | 504 | 4.7 | 6.2 | 1 | 7 |
| 338.9350.062 | 133 | 2.9 | 3.8 | 1 | 9 |
| 339.6220.121 | 201 | 2.6 | 1.6 | 1 | 9 |
An uncertainty of the P-L relation arises from possible variations of our stellar evolution tracks. While HO09 study the protostellar evolution with the spherical accretion, for instance, HYO10 present that the evolution slightly changes with different accretion geometries, e.g., accretion via a geometrically thin disk. 111 While the “disk accretion” mentioned here assumes the lowest entropy of the accreting gas, the rapid mass accretion could enhance the entropy (e.g., Hosokawa et al. 2011). In this case, the stellar evolution with the spherical accretion would be more realistic even if gas accretes through the disk (see HYO10). We also perform the stability analysis of case MD3-D-b0.1 in HYO10, whose model has the largest radius among the cases for . Figure 2 shows that the protostar also becomes pulsationally unstable in this case, and that the periods are 10 times longer than those with the spherical accretion at the same rate. This effect might explain the observed sources which have the longer periods than predicted by the P-L relation (1).
4. Conclusion and Discussion
In this Letter, we have shown that the pulsation of massive protostars could explain the periodic variability of the 6.7 GHz maser sources. Our linear stability analysis clearly shows that a rapidly accreting () massive protostar becomes pulsationally unstable when the star is bloated before reaching the ZAMS. Typical periods of the pulsation are several days, which explain the observed periodicity well. The period depends on the adopted accretion rate, getting longer with the higher rate. On the other hand, the protostar with the lower becomes unstable but does not produce the periodicity, which could also explain why the periodic variability shorter than 10 days has not been observed. Our stability analysis predicts the period-luminosity (P-L) relation for the pulsationally unstable protostars, .
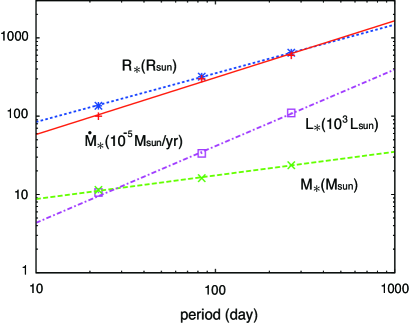
Moreover, our stellar evolution models predict that other stellar properties such as the mass, radius, and accretion rate as well as the luminosity should depend on the pulsation period. We show this in Figure 3. Single power-law functions which fit the results are,
| (2) |
| (3) |
| (4) |
If the P-L relation (1) is confirmed by further observations, we can infer the above quantities with equations (2) - (4) only from the maser period. As seen in Figure 2, the periods of the observed maser sources are longer than 10 days. Our stellar-pulsation models predict that, in particular to explain the periods longer than days, very rapid mass accretion with is required. In this way, we can make a direct diagnosis of the small-scale structure of accreting massive protostars and their vicinities ( a few AU), which are difficult to see in the optical and infrared bands, by measuring the maser periods.
The stellar pulsation examined above should cause the periodic variation of the stellar luminosity . Although it is still uncertain where the maser emission is excited around protostars, some observations suggest that the maser sources are located on circumstellar disks at AU (e.g., Bartkiewicz et al. 2009). The temperature of the circumstellar disk irradiated by the stellar radiation obeys , where is the distance from the protostar. The variation of the stellar luminosity changes the dust temperature following . Since the response of the dust temperature to the irradiating flux variation is so rapid ( a few sec), should synchronize with . As evaluating is beyond our linear analysis, we here consider the flux variation of Mira variables, which are also excited by the -mechanism. Interestingly, SiO maser sources associated with some Mira variables are likely pumped by the stellar radiation, and show periodic variations which synchronize with the stellar pulsation (Pardo et al. 2004). With the typical flux variations of magnitudes of Mira-type stars (Samus et al. 2009), the amplitude of the variation is estimated as , which results in K around K. Cragg et al. (2005) show that the variations of the dust temperature K could produce the observed amplitudes of the maser variability ( Jy). Therefore, the stellar pulsation could produce the flux variations of the observed 6.7 GHz methanol masers.
In the above, we have supposed that the stellar radiation reaches the irradiated disk surface without significant time delays, i.e., the light path from the star to the disk surface is optically thin. This should be valid with the disk accretion, where the density above the disk quickly decreases as the gas falls onto the disk. If outflow is launched from the disk, however, the disk wind would enhance the density above the disk and increase the optical depth. According to a disk wind model by Zhang, Tan & McKee (2013), the optical depth when the protostar is pulsationally unstable is estimated as , where is the mean opacity of dusts. The diffusion time with this optical depth is days, which is shorter than the typical periods of the maser sources. This effect would smear out only variabilities shorter than a few days. Nonetheless, the launching mechanism of the disk wind and the detailed density structure above the disk are still highly uncertain. Some periodic maser sources which have days also show rapid fluctuations of light curves over a few 10 days (G009.621, G022.357, and G338.935). The above estimate of the diffusion time do not explain such the rapid changes. Although the variations of these sources might be explained with different models rather than ours (also see below), it would be also possible that the disk wind is weaker and the diffusion time is shorter than evaluated above. Simultaneous monitoring of the maser sources in the infrared band will verify the relation between the periodic variations of the stellar luminosity and the maser variability.
Finally, we compare our pulsation model to alternative models for explaining the periodic variability of the 6.7 GHz methanol maser sources. For instance, van der Walt (2011) proposes that radiation from shocked gas in the colliding binary wind explains both the periodicity and shapes of the light curves of some maser sources. This model supposes a particular condition, the binary system surrounded by an ultracompact HII region ( AU), and explains the periodic maser sources for which ultracompact HII regions have been observed (triangles in Fig 2). On the other hand, a number of the sources presented in Figure 2 do not show associating HII regions at least at 5 and 8 GHz. Our models could explain these sources, as the protostar becomes pulsationally unstable when the stellar radius is very large and effective temperature is only K, with which the UV luminosity is too low to create a detectable HII region. This suggests that measuring the UV luminosities of massive protostars would be a key for discriminating the models. Further observations at the higher frequencies ( a few tens GHz) would detect hypercomact HII regions, which are too small and optically thick to be detected at the lower frequencies. Such the observations with the higher spatial resolution (e.g., with ALMA) are sure to advance our understanding of the enigmatic periodic variability of the maser sources.
Appendix A Analytic derivation of the P-L relation
In this Appendix, we analytically derive a P-L relation similar to equation (1) with considering the protostellar evolution. Stahler et al. (1986, hereafter SPS86) show that the evolution of an accreting protostar is well understood with the balance between following two timescales: the accretion time scale , and the Kelvin-Helmholtz timescale . As seen in Figure 1, the protostar gradually expands in the early stage with , and turns to contract in the later stage with . The turnaround of the radius occurs when (also see HO09 and HYO10). According to our linear stability analysis, the protostar becomes unstable at the epoch of the maximum radius, i.e., (see star symbols in Figure 1).
SPS86 also show that the stellar expansion in the early evolutionary stage is well described as . With Kramers’ law , which approximates the dependences of opacity in the stellar interior in this early stage, the stellar luminosity generally obeys (e.g., Cox & Giuli 1968). Using these relations, we can express the luminosity of the unstable protostar (i.e., ) as a function of the pulsation period and obtain the period-luminosity (P-L) relation .
References
- Appenzeller (1970) Appenzeller, I. 1970, A&A, 5, 355
- Araya et al. (2010) Araya, E. D., Hofner, P., Goss, W. M., et al. 2010, ApJ, 717, L133
- Bartkiewicz et al. (2009) Bartkiewicz, A., Szymczak, M., van Langevelde, H. J., Richards, A. M. S., & Pihlström, Y. M. 2009, A&A, 502, 155
- Beltrán et al. (2006) Beltrán, M. T., Cesaroni, R., Codella, C., et al. 2006, Nature, 443, 427
- Bovy et al. (2009) Bovy, J., Hogg, D. W., & Rix, H.-W. 2009, ApJ, 704, 1704
- Casoli et al. (1986) Casoli, F., Combes, F., Dupraz, C., Gerin, M., & Boulanger, F. 1986, A&A, 169, 281
- Caswell et al. (2011) Caswell, J. L., Fuller, G. A., Green, J. A., et al. 2011, MNRAS, 417, 1964
- Cox & Giuli (1968) Cox, J. P., & Giuli, R. T. 1968, Principles of Stellar Structure, New York, Gordon and Breach
- Cox (1980) Cox, J. P. 1980, Theory of Stellar Pulsation, Princeton University Press, Princeton, NJ
- Cragg et al. (2005) Cragg, D. M., Sobolev, A. M., & Godfrey, P. D. 2005, MNRAS, 360, 533
- Goedhart et al. (2004) Goedhart, S., Gaylard, M. J., & van der Walt, D. J. 2004, MNRAS, 355, 553
- Goedhart et al. (2007) Goedhart, S., Gaylard, M. J., & van der Walt, D. J. 2007, IAU Symposium, 242, 97
- Goedhart et al. (2009) Goedhart, S., Langa, M. C., Gaylard, M. J., & van der Walt, D. J. 2009, MNRAS, 398, 995
- Green & McClure-Griffiths (2011) Green, J. A., & McClure-Griffiths, N. M. 2011, MNRAS, 417, 2500
- Green et al. (2012) Green, J. A., Caswell, J. L., Fuller, G. A., et al. 2012, MNRAS, 420, 3108
- Guzmán et al. (2012) Guzmán, A. E., Garay, G., Brooks, K. J., & Voronkov, M. A. 2012, ApJ, 753, 51
- Harries et al. (2003) Harries, T. J., Hilditch, R. W., & Howarth, I. D. 2003, MNRAS, 339, 157
- Hilditch et al. (2005) Hilditch, R. W., Howarth, I. D., & Harries, T. J. 2005, MNRAS, 357, 304
- Honma et al. (2007) Honma, M., Bushimata, T., Choi, Y. K., et al. 2007, PASJ, 59, 889
- Hosokawa & Omukai (2009) Hosokawa, T., & Omukai, K. 2009, ApJ, 691, 823 (HO09)
- Hosokawa et al. (2010) Hosokawa, T., Yorke, H. W., & Omukai, K. 2010, ApJ, 721, 478 (HYO10)
- Hosokawa et al. (2011) Hosokawa, T., Offner, S. S. R., & Krumholz, M. R. 2011, ApJ, 738, 140
- Inayoshi et al. (2013) Inayoshi, K., Hosokawa, T., & Omukai, K. 2013, MNRAS, 1079
- Krumholz et al. (2009) Krumholz, M. R., Klein, R. I., McKee, C. F., Offner, S. S. R., & Cunningham, A. J. 2009, Science, 323, 754
- Lada & Lada (2003) Lada, C. J., & Lada, E. A. 2003, ARA&A, 41, 57
- McKee & Tan (2003) McKee, C. F., & Tan, J. C. 2003, ApJ, 585, 850
- Norris et al. (1993) Norris, R. P., Whiteoak, J. B., Caswell, J. L., Wieringa, M. H., & Gough, R. G. 1993, ApJ, 412, 222
- Osorio et al. (1999) Osorio, M., Lizano, S., & D’Alessio, P. 1999, ApJ, 525, 808
- Pardo et al. (2004) Pardo, J. R., Alcolea, J., Bujarrabal, V., et al. 2004, A&A, 424, 145
- Pestalozzi et al. (2005) Pestalozzi, M. R., Minier, V., & Booth, R. S. 2005, A&A, 432, 737
- Reid et al. (2009a) Reid, M. J., Menten, K. M., Brunthaler, A., et al. 2009a, ApJ, 693, 397
- Reid et al. (2009b) Reid, M. J., Menten, K. M., Zheng, X. W., et al. 2009b, ApJ, 700, 137
- Samus et al. (2009) Samus, N. N., Durlevich, O. V., & et al. 2009, VizieR Online Data Catalog, 1, 2025
- Sandage et al. (2004) Sandage, A., Tammann, G. A., & Reindl, B. 2004, A&A, 424, 43
- Sanna et al. (2009) Sanna, A., Reid, M. J., Moscadelli, L., et al. 2009, ApJ, 706, 464
- Sanna et al. (2010) Sanna, A., Moscadelli, L., Cesaroni, R., et al. 2010, A&A, 517, A78
- Stahler et al. (1986) Stahler, S. W., Palla, F., & Salpeter, E. E. 1986, ApJ, 302, 590 (SPS86)
- Szymczak et al. (2011) Szymczak, M., Wolak, P., Bartkiewicz, A., & van Langevelde, H. J. 2011, A&A, 531, L3
- Tammann et al. (2003) Tammann, G. A., Sandage, A., & Reindl, B. 2003, A&A, 404, 423
- Unno et al. (1989) Unno, W., Osaki, Y., Ando, H., Saio, H., & Shibahashi, H. 1989, Nonradial oscillations of stars, 2nd ed. University of Tokyo Press, Tokyo
- Urquhart et al. (2007) Urquhart, J. S., Busfield, A. L., Hoare, M. G., et al. 2007, A&A, 461, 11
- van der Walt (2005) van der Walt, J. 2005, MNRAS, 360, 153
- van der Walt (2011) van der Walt, D. J. 2011, AJ, 141, 152
- Walsh et al. (1998) Walsh, A. J., Burton, M. G., Hyland, A. R., & Robinson, G. 1998, MNRAS, 301, 640
- Yoon & Cantiello (2010) Yoon, S.-C., & Cantiello, M. 2010, ApJL, 717, L62
- Xu et al. (2011) Xu, Y., Moscadelli, L., Reid, M. J., et al. 2011, ApJ, 733, 25
- Zhang et al. (2005) Zhang, Q., Hunter, T. R., Brand, J., et al. 2005, ApJ, 625, 864
- Zhang et al. (2013) Zhang, Y., Tan, J. C., & McKee, C. F. 2013, ApJ, 766, 86