Estimates for Lorentz factors of gamma-ray bursts
from early optical afterglow observations
Abstract
The peak time of optical afterglow may be used as a proxy to constrain the Lorentz factor of the gamma-ray burst (GRB) ejecta. We revisit this method by including bursts with optical observations that started when the afterglow flux was already decaying; these bursts can provide useful lower limits on . Combining all analyzed bursts in our sample, we find that the previously reported correlation between and the burst luminosity does not hold. However, the data clearly shows a lower bound which increases with . We suggest an explanation for this feature: explosions with large jet luminosities and suffer strong adiabatic cooling before their radiation is released at the photosphere; they produce weak bursts, barely detectable with present instruments. To test this explanation we examine the effect of adiabatic cooling on the GRB location in the plane using a Monte Carlo simulation of the GRB population. Our results predict detectable on-axis “orphan” afterglows. We also derive upper limits on the density of the ambient medium that decelerates the explosion ejecta. We find that the density in many cases is smaller than expected for stellar winds from normal Wolf-Rayet progenitors. The burst progenitors may be peculiar massive stars with weaker winds or there might exist a mechanism that reduces the stellar wind a few years before the explosion.
1 Introduction
The prompt emission of gamma-ray bursts (GRBs) is likely produced by dissipative mechanisms inside the relativistic ejecta of the explosion, while the GRB afterglow is associated with the ejecta deceleration by a circum-burst medium (see e.g. Piran 2004 for a review). The afterglow emission is attributed to a relativistic blast wave that involves a pair of shocks – forward and reverse.
One of the most important parameters of GRBs is the Lorentz factor of the relativistic ejecta, , as the models of the prompt and afterglow emissions strongly depend on its value. Useful constraints on may be derived using the timescale and spectrum of the prompt GRB (Paczynski 1986; Goodman 1986), which typically gives (e.g. Lithwick & Sari 2001; Hascoët et al. 2012). Another possible way to constrain the GRB Lorentz factor is to use the afterglow peak time as a proxy for the deceleration time of the blast wave, , at which the dissipation rate peaks (e.g. Meszaros & Rees 1997; Sari & Piran 1999). Using this method Liang et al. (2010, 2013) and Ghirlanda et al. (2012) studied a sample of GRBs with detected optical peaks and found a correlation between and the burst luminosity .
The key assumption of this method, , is questionable, as optical emission could reach its peak at a different time. This possibility is illustrated by the simple model of synchrotron emission from a self-similar blast-wave, where the optical light curve can peak at (e.g. Sari et al. 1998). However, observations conflict with the late- models and lend some support to the assumption. In many bursts, optical emission peaks early and steeply, as may be expected at .111This expectation depends on the model for the circum-burst density. A steep rise is firmly predicted if the density is uniform, , but questionable if (wind-type medium, Chevalier & Li 2000). In the latter case, additional effects such as pair loading could produce the steep rise toward the peak (Beloborodov 2002). The optical peak may be dominated by the forward- or reverse-shock emission (e.g. Meszaros & Rees 1997; Sari & Piran 1999; Uhm & Beloborodov 2007; Genet et al. 2007). In this paper, we accept as a reasonable assumption and investigate its implications.
In Sections 2 and 3, we extend the previous analysis by including bursts whose afterglow peaked before observations started, which provides a useful upper limit on . We also identify the cases where the blast wave at is significantly slower than the ejecta, which corresponds to a relativistic reverse shock; in these cases the measurement of provides only a lower bound on the ejecta Lorentz factor . Our analysis does not support the existence of the correlation claimed in previous studies. Instead, the data shows a lack of bright bursts with low Lorentz factors. In Section 4, we suggest an explanation of this fact. Section 5 summarizes our results and discusses implications of observed for the nature of the circum-burst medium.
2 Sample
2.1 Bursts with detected optical afterglow peaks
Table 1 gives the list of 20 GRBs with detected early afterglow peaks that are included in our sample. This list is a selection from the GRB samples of Liang et al. (2010); Lü et al. (2012); Liang et al. (2013), where we keep only bursts with reliable detection of the peak time. We removed (1) GRBs that have optical light-curves with more than one bump, making the peak measurement ambiguous, (2) GRBs for which the peak was measured during a plateau phase (i.e. where the optical light-curve is flat in logarithmic scale), and (3) GRBs with optical light-curves that are sampled too sparsely or whose temporal range is too small to provide significant constraints on .
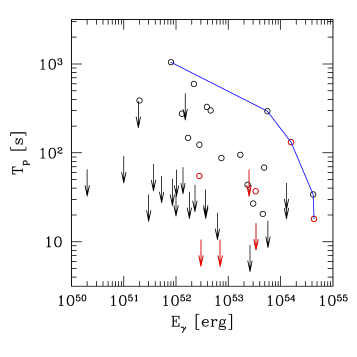
The redshift-corrected peak times are shown in 1 versus the GRB isotropic equivalent gamma-ray energy and the corresponding average luminosity
| (1) |
where
| (2) |
and is an approximate measure of the observed burst duration (time during which % of the emission is received). One can notice a good correlation between and (or ); we argue below that this correlation is spurious.
| GRB | z | References | |||
|---|---|---|---|---|---|
| 990123 | 1.60 | 436.5260.31 | 4710 | 63.30.3 | 1, 2 |
| 050820A | 2.612 | 159.212.4 | 4776 | 60050 | 2, 3 |
| 060418 | 1.489 | 48.610.6 | 1705 | 521 | 2, 3, 4 |
| 060605 | 3.78 | 2.80.5 | 59045 | 191 | 2, 3 |
| 060607A | 3.082 | 23.41.5 | 1793 | 1005 | 2, 3, 4 |
| 061007 | 1.261 | 42141.9 | 771 | 755 | 2, 3 |
| 070318 | 0.836 | 1.30.3 | 50746 | 635 | 2, 3 |
| 070419A | 0.97 | 0.20.02 | 76530 | 1122 | 2, 3 |
| 071010B | 0.947 | 1.70.9 | 287145 | 35.740.5 | 2, 3 |
| 071031 | 2.692 | 3.90.6 | 12132 | 18010 | 5, 3 |
| 080603A | 1.68742 | 2.20.8 | 1600400 | 15010 | 6, 7 |
| 080710 | 0.845 | 0.80.4 | 193446 | 12017 | 2, 3 |
| 080810 | 3.35 | 3020 | 1172 | 1085 | 2, 3 |
| 081008 | 1.967 | 2.80.5 | 1632 | 18539 | 8, 3 |
| 081203A | 2.1 | 174 | 2952 | 29471 | 9, 3 |
| 090313 | 3.375 | 4.60.5 | 1315109 | 7819 | 2, 3 |
| 090812 | 2.452 | 45.96 | 718 | 705 | 10, 3 |
| 091029 | 2.752 | 7.4074 | 32850 | 39.25 | 11, 2 |
| 100906A | 1.727 | 33.43 | 1014 | 114.41.6 | 2, 3 |
| 110205A | 2.22 | 566 | 9483 | 25725 | 2, 3 |
2.2 Bursts with upper limits on
For some bursts the peak is not observed because observations start too late. These bursts are also useful for our purposes, as some of them give strong upper-limits on . A sample of such GRBs is listed in Table 2 and the corresponding upper limits are shown in 1. The number of available strong limits (24) is comparable to the number of peak detections. The limits are robust. For many bursts in the sample, the optical decay was already well established when the observations started, without any evidence for an increasing decay index. This suggests that the peak was reached well before the beginning of observations.
The obtained limits on are never below a few tens of seconds, which reflects the typical delay in response of robotic optical telescopes to alerts from -ray telescopes.222Due to a fortunate chain of events, optical observations of GRB 080319B started before the -ray trigger (Racusin et al. 2008). However in this special case the rise of the optical afterglow is hidden by the bright prompt optical component. Note also that the limits tend to be less constraining for weak (low ) bursts. It is easier to obtain strong limits for bright bursts for a few reasons: they are easily localized by -ray telescopes; they have brighter afterglows (Gehrels et al. 2008); and they have higher redshifts which move to a later
While it is easy to miss an early optical peak, s, we are not aware of any selection effects that could lead to preferential non-detection of late peaks s. In this range, the data should represent the true distribution of . The data presented in 1 may be summarized as follows: there is no intrinsic correlation between and (or ). Instead we observe a lack of bright bursts with late afterglow peaks. For a given , there appears to exist a maximum peak time which corresponds to the blue boundary in 1. A crude approximation to this boundary is given by .
| GRB | z | References | |||
|---|---|---|---|---|---|
| 021211 | 1.004 | 1.020.1 | 3.50.5 | 1, 2, 3 | |
| 040924 | 0.858 | 1.50.5 | 2.390.24 | 4 | |
| 050319 | 3.24 | 3.71 | 149.60.7 | 5, 6 | |
| 050401 | 2.9 | 261 | 332 | 7, 8, 9 | |
| 050525A | 0.606 | 2.31 | 8.80.5 | 10 | |
| 050824 | 0.828 | 0.190.05 | 251 | 11 | |
| 050908 | 3.35 | 1.360.1 | 202 | 12, 13,14 | |
| 050922C | 2.17 | 3.71 | 51 | 15, 16, 17 | |
| 051109A | 2.346 | 31 | 375 | 18, 19 | |
| 051111 | 1.55 | 71 | 471 | 20, 21 | |
| 060512A | 0.4428 | 0.020.005 | 8.62 | 22, 23, 24 | |
| 060908 | 1.884 | 6.20.7 | 19.30.3 | 25 | |
| 060912 | 0.937 | 0.850.15 | 71 | 26 | |
| 071003 | 1.60435 | 344 | 1481 | 27 | |
| 071112C | 0.823 | 0.530.1 | 1512 | 28 | |
| 080319B | 0.937 | 13010 | 555 | 29 | |
| 080413B | 1.1 | 1.80.5 | 8.01 | 30 | |
| 080430 | 0.767 | 0.30.1 | 16.22.4 | 31, 32, 33, 34, 35 | |
| 080721 | 2.591 | 13010 | 16.24.5 | 36 | |
| 081007 | 0.5295 | 0.10.02 | 10.04.5 | 37, 38, 39 | |
| 090102 | 1.547 | 57.55 | 272.2 | 40 | |
| 090618 | 0.54 | 25.1 | 1131 | 41 | |
| 091018 | 0.971 | 0.370.1 | 4.40.6 | 42 | |
| 091208B | 1.063 | 10.2 | 14.93.7 | 43 |
References: (1) Crew et al. 2003; (2) Li et al. 2003; (3) Pandey et al. 2003; (4) Wiersema et al. 2008; (5) Cusumano et al. 2006; (6) Quimby et al. 2006; (7) Sakamoto et al. 2005; (8) Fynbo et al. 2005; (9) Rykoff et al. 2005; (10) Blustin et al. 2006; (11) Sollerman et al. 2007; (12) Sato et al. 2005; (13) Fugazza et al. 2005; (14) Zaninoni et al. 2013; (15) Hunsberger et al. 2005; (16) Crew et al. 2005; (17) Krimm et al. 2005a; (18) Rykoff et al. 2009; (19) Golenetskii et al. 2005; (20) Butler et al. 2006; (21) Krimm et al. 2005b; (22) Cummings et al. 2006; (23) Bloom et al. 2006; (24) de Pasquale & Cummings 2006; (25) Covino et al. 2010; (26) Deng et al. 2009; (27) Perley et al. 2008; (28) Huang et al. 2012; (29) Racusin et al. 2008; (30) Filgas et al. 2011; (31) Jelinek et al. 2008; (32) Landsman & Guidorzi 2008; (33) Oksanen & Hentunen 2008; (34) Cucchiara & Fox 2008; (35) Guidorzi et al. 2008; (36) Starling et al. 2009; (37) Markwardt et al. 2008; (38) Wren et al. 2008; (39) Berger et al. 2008; (40) Gendre et al. 2010; (41) Page et al. 2011; (42) Wiersema et al. 2012; (43) Uehara et al. 2012
 |
 |
 |
 |
 |
3 Estimates for
The GRB afterglow is likely emitted by the blast wave resulting from the interaction of the relativistic ejecta with the ambient medium. The blast wave involves two shocks: the forward shock sweeping the external medium and the reverse shock propagating back into the relativistic ejecta. As discussed in Section 1, it is reasonable to assume that the afterglow peaks at the deceleration time when most of the ejecta energy has been transmitted to the blast-wave through the reverse shock. This happens at the “deceleration radius,”
| (3) |
where is the energy of the ejecta and is the Lorentz factor of the blast wave at ; is the external density at , and describes the slope of the external density profile, . A uniform medium is described by and a wind medium by . We assume that the afterglow peaks at the deceleration time,
| (4) |
Then the measured provides an estimate for the blast wave Lorentz factor,
| (5) |
where is the fraction of the initial energy of the GRB ejecta that is converted into prompt radiation.
Two aspects of Equation (5) should be noted: (1) the estimate depends on the poorly known ambient density as and the prompt efficiency as . (2) The estimate gives the Lorentz factor of the blast wave, , not the ejecta Lorentz factor .
We expect if . Indeed, is associated with the time it takes the ejecta to transfer most of its energy to the blast wave, i.e. the time it takes the reverse shock to cross the main, most energetic part of the ejecta of thickness . The crossing time is long and gives if the reverse shock is non relativistic, , which is equivalent to . In this case Equation (5) effectively gives an estimate of the mean Lorentz factor of the ejecta. In contrast if , the reverse shock may be highly relativistic. Then is significantly smaller than and Equation (5) significantly underestimates . GRBs with are highlighted in red in 1.
Note that that we use as a measure of the GRB duration may overestimate the duration of the main part of the GRB if the burst has a temporally extended tail of relatively weak emission. For such bursts is possible. A better estimate for would give , so that is not smaller than . In agreement with theoretical expectations, we found no burst in our sample where the optical afterglow peaks before the main part of the GRB emission has been received.
Equation (5) assumes a static external medium and neglects the fact that the prompt GRB radiation exerts pressure and accelerates the medium ahead of the blast wave (Thompson & Madau 2000; Beloborodov 2002). This pre-acceleration is strong (relativistic) up to the radius,
| (6) |
If exceeds given by Equation (5), the true deceleration radius is increased, and the dissipation rate peaks at
| (7) |
We found for all bursts in our GRB sample as long as . For most bursts in our sample, would imply low values for , which would contradict the constraint from the prompt emission (see discussion in Section 5.2). Therefore we will assume and neglect the pre-acceleration effect.
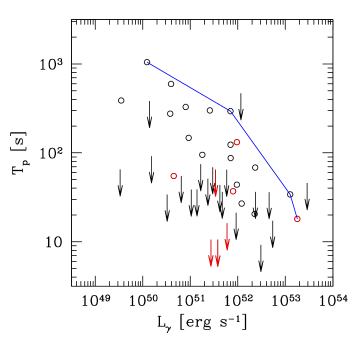
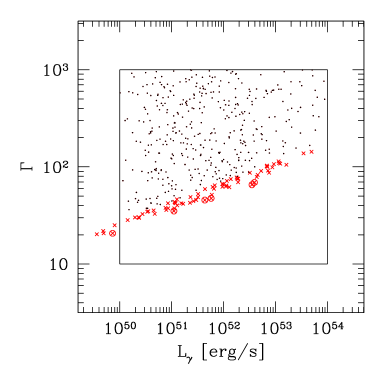
Using Equation (5) we estimated for each burst in the sample (2). We fixed and in our numerical estimates; the uncertainty in their exact values weakly affects the results. If only the peak “detections” are considered, 2 would suggest that there is a correlation between and . However, the numerous lower limits show that the upper part of the diagram must be broadly populated by GRBs. Also note that four detections of correspond to the relativistic reverse shock regime and give only lower limits on . We conclude that there is no evidence for a correlation between and . However the lack of bright bursts with low appears to be a robust feature.
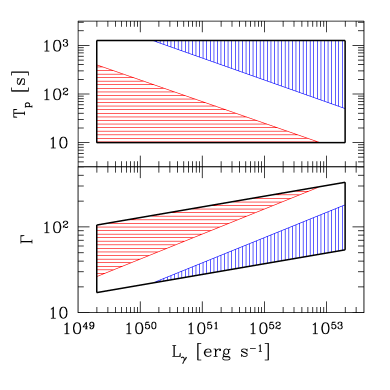
3 illustrates how the GRB sample is transformed from plane to plane, following the relation between and , (Equation (5)). This transformation compresses the sample along the axis and induces a dependence of on with a positive slope of . In combination with the selection effect that suppresses short- and low- bursts in the sample, this enhances the spurious correlation between and .
As mentioned in Section 1, the key assumption that the optical afterglow peaks at the deceleration radius may not be reliable. Therefore, it is useful to consider a more general model where the afterglow peaks at a radius related to and by
| (8) |
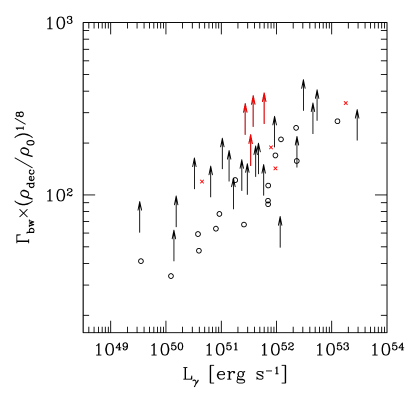
The simplest model with corresponds to and (see Equation (3)). For other values of , , the observed upper boundary (where ; see 1) in the diagram still transforms into a lower-boundary in the diagram. As an illustration, 4 shows estimated assuming (i.e. ). The results are similar to those in 2. The conclusion that grows with holds as long as . Violation of this condition would require and that are significantly different from and . If then weakly depends on , and cannot be used to estimate .
4 Lack of bright bursts with a large : a result of adiabatic cooling?
4.1 Adiabatic cooling below the photosphere
The photospheric radius (the characterisitic radius where the explosion ejecta becomes transparent to Thomson scattering) is given by
| (9) |
where is the isotropic power of the outflow, and is the Thomson opacity (in units of ); may be significantly increased by pair creation. For the most powerful explosions () with relatively low Lorentz factors () the photospheric radius is exceptionally large. If the GRB radiation is produced at a smaller radius (where internal dissipation peaks) the burst may be buried by the large optical depth, since it implies strong adiabatic cooling of the radiation trapped in the expanding ejecta.
To illustrate this possibility, suppose that the GRB emission is generated before the ejecta reaches a radius
| (10) |
where is a fixed constant. The scaling of the cutoff radius is expected for mechanisms that dissipate the energy of internal motions or magnetic energy. Combining Equations (9) and (10), one finds the optical depth at ,
| (11) |
If dissipation occurs far below the photosphere (), the resulting radiation released at the photosphere is adiabatically cooled by the factor of (Beloborodov 2011). Then for given ejecta power and dissipation efficiency at the observed burst luminosity scales as
| (12) |
The slope of this relation is suggestively close to the slope of relation seen in 2.
4.2 Properties of adiabatically cooled bursts
Even though the dissipation mechanism at can be non-thermal, the produced radiation will be progressively thermalized during the subsequent adiabatic expansion between and . Let be the electron temperature (measured in the ejecta frame), and be the Thomson optical depth at . Two different regimes can be distinguished: (1) For , an exponential cutoff would form in the radiation spectrum at energy
| (13) |
This cutoff is a result of significant Compton downscattering (recoil effect) at ; the spectrum at is weakly affected. (2) For , the spectrum is exponentially suppressed above . The low-energy part of the spectrum is also affected by multiple Compton scattering — the spectral slope steepens as the photons tend to thermalize with electrons.
Thus, one expects significant changes in the burst spectrum after strong adiabatic cooling. Such unusual GRBs have been observed. Ghirlanda et al. (2003) and Ryde (2004) found that some bursts have spectra with very hard low energy indices and possibly exponential cutoffs. Similar quasi-thermal GRBs are found in both BATSE (Kaneko et al. 2006) and Fermi Gamma Burst Monitor (Goldstein et al. 2012) catalogs. These bursts — especially those with a low peak energy — may be generated by adiabatically cooled explosions with a large photospheric radius .
Another expected feature of bursts with small and large is the suppression of variability on short timescales. In these bursts, the minimum variability timescale can be as large as s (see Equation (17) below), and their lightcurves are expected to be smooth.
While adiabatic cooling can significantly reduce the emitted GRB energy , the ejecta energy remains large. Thus, adiabatically cooled bursts are expected to have unproportionally bright afterglows. They should lie in the upper part of the gamma-ray fluence/X-ray afterglow flux distribution, which spreads over two orders of magnitude (see for example Fig. 2 in Gehrels et al. 2008). As we show below, the majority of GRBs with strong adiabatic cooling avoid detection. Then they become prime candidates for “orphan” afterglows (e.g. Huang et al. 2002). These afterglows are expected to peak at late times , as they are generated by the low- ejecta.
4.3 Monte Carlo simulation of a GRB population
To illustrate how bright bursts with low Lorentz factors are depleted by adiabatic cooling,
we produced a synthetic GRB population using a Monte Carlo simulation,
with the following assumptions:
(1) We adopted the GRB rate RSF3 from Porciani & Madau (2001).
We assume that the rate
keeps increasing at as suggested by observations (e.g. Daigne et al. 2006; Wanderman & Piran 2010; Salvaterra et al. 2012);
we cut it off at .
(2) The GRB luminosity function is assumed to follow a power-law distribution of index as suggested by Daigne et al. (2006),
in a broad range of
.
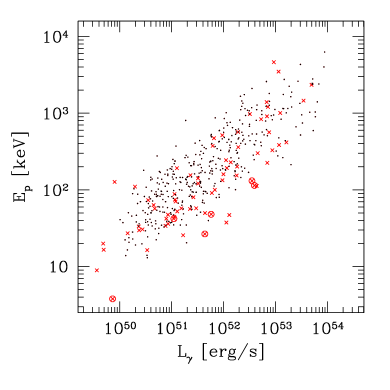
(3) For each GRB, the spectrum of generated radiation at
is assumed to be a broken power-law with a low energy index and a high energy index .
The rest-frame peak energy of the spectrum, , is assumed to correlate with ;
we use the relation
with a scatter
(e.g. Wei & Gao 2003; Yonetoku et al. 2004; Nava et al. 2012).
(4) The radiation spectrum is injected with at
(which would correspond to a variability timescale
ms if ).
(5) The logarithm of Lorentz factor is randomly chosen for each burst from
a uniform distribution in the range .
The adiabatic cooling effect is calculated as follows:
(6) The photospheric radius of each GRB is obtained from Equation (9), with .
If , the burst is cooled by a factor of changing and from their initial values at .
The burst spectrum is changed as explained in Section 4.2; the cutoff at is approximated by a step function.
(7) The simulated GRB is assumed to be detected if its observed photon flux in the Swift band keV is above the threshold of (Band 2006).
The results of our simulation are shown in 5. One can see that adiabatic cooling depletes the low-/high- corner of the diagram. The resulting distribution resembles the observed one in 2. This simulation also allows one to estimate the impact of adiabatic cooling on the observed distribution of (6). A burst that suffers adiabatic cooling is moved along a track , which tends to create GRBs with below the original correlation. However, the effect on the population of detected GRBs is weak, because cooled bursts become undetected (due to the reduced and the spectral cutoff at ) before they become outliers in the correlation.
 |
 |
 |
 |
5 Discussion
5.1 Adiabatic cooling
If the peak time of optical afterglow, , is indeed a good proxy for the blast wave deceleration radius , observations imply a lack of bright bursts with low Lorentz factors (Section 3). We argued that this lack may be expected, as energetic explosions with low Lorentz factors should have unusually large photospheres cm. Since the dissipation mechanism generating radiation in these bursts is likely limited to smaller radii, , the burst is expected to suffer strong adiabatic cooling and become undetectable (Section 4).
Most models of the prompt GRB emission place the emission source at radii smaller than cm, especially if is small. For example, dissipation of internal motions or magnetic energy in the ejecta is expected to end at a radius that scales as and becomes smaller than at small . Then the trapped radiation is adiabatically cooled and the burst becomes inefficient. This argument is applicable to any dissipation mechanism generating the burst — e.g. collisionless shocks (Rees & Meszaros 1994; Daigne & Mochkovitch 1998), collisional heating (Beloborodov 2010), or magnetic reconnection (Spruit et al. 2001). Note also that the neutron component of the jet, which can play a significant role in collisional dissipation, may not survive to in low- bursts. The mean radius of neutron decay is cm, and its ratio to the photospheric radius is given by
| (14) |
The cooled bursts still produce energetic ejecta that can drive an energetic blast wave in the external medium and generate bright afterglow emission. We argued that one could observe “orphan” afterglows from such explosions, with undetected prompt GRBs, even when the burst is observed “on-axis,” i.e. the relativistic jet is directed toward the observer. As this paper was completed, Palomar Transient Factory detected an event consistent with on-axis orphan afterglow (Cenko et al. 2013).
We also argued that the prompt emission of strongly cooled bursts can be occasionally detected. As discussed in Section 4, these bursts have special properties. They should have soft spectra resembling quasi-thermal emission and their light curves should be smooth.
5.2 GRB ambient medium: a low density wind?
 |
As some long GRBs are associated with Type Ib,c supernovae, their progenitors are expected to be Wolf-Rayet stars. Wolf-Rayet stars in our galaxy are observed to lose mass at a typical rate through strong winds of velocity (e.g. Crowther 2007). If the wind has constant , its density follows the density profile,
| (15) |
where
| (16) |
As discussed in Section 3, the peak time of the optical afterglow provides an estimate of the ejecta Lorentz factor if . This estimate scales as . On the other hand, an independent constraint on can be derived by considering the Thomson opacity of the ejecta and its photosphere.333For GRBs with detected high-energy emission (above 100 MeV) another constraint on could be derived from the requirement that the high-energy photons avoid - absorption (e.g. Lithwick & Sari 2001; Granot et al. 2008; Hascoët et al. 2012). There are no such bursts in our sample. The photospheric radius (Equation (9)) implies a minimum variability timescale . Thus, the observed is expected to satisfy the condition,
| (17) |
From this condition, using the observed and , one obtains a lower bound on the ejecta Lorentz factor. Then, combining Equations (5) and (17), an upper limit on can be derived. For a wind medium this limit translates into an upper bound on ,
| (18) |
This upper limit is sensitive to the Thomson opacity , which may be significantly increased by creation in the ejecta. The numerical value for in Equation (18) is given for the lowest possible cm2 g-1, which gives a conservative upper limit on . 7 shows the upper limits obtained for our GRB sample, where we used , , and s. In some bursts, the inferred is well below . For GRB 060605, is times smaller than . Even stronger limits could be derived with more sensitive detectors and more detailed analysis of variability timescales. GRBs that give the lowest have relatively low luminosities, and poor photon statistics make it difficult to see the true minimum , which might be shorter than 1 s.
7 suggests that at least some GRB progenitors are peculiar massive stars whose winds are weaker than typical Wolf-Rayet stars observed in our galaxy. This may be the result of a lower metallicity of the star (e.g. Vink et al. 2001), a property that seems to be preferred by GRB progenitors, and agrees with observations of their host galaxies (e.g. Perley et al. 2013). Weaker winds extract less angular momentum from the progenitor, leading to collapse with faster rotation, which is required for GRB central engines producing collimated jets (e.g. Woosley & Heger 2006). Note also that GRBs with bright optical afterglows (such as bursts in our sample) imply a selection against high-metallicity environment, which tends to obscure the optical emission (e.g. Levesque 2013).
The low wind density could also be explained by a change in the stellar mass loss rate shortly before the explosion. The wind medium at a characteristic radius was ejected by the progenitor yr before the explosion. The mass loss rates of Wolf-Rayet stars in the last few years of their lives are uncertain; might decrease as the star evolves toward the collapse.
References
- Band (2006) Band, D. L. 2006, ApJ, 644, 378
- Beloborodov (2002) Beloborodov, A. M. 2002, ApJ, 565, 808
- Beloborodov (2010) —. 2010, MNRAS, 407, 1033
- Beloborodov (2011) —. 2011, ApJ, 737, 68
- Berger et al. (2008) Berger, E., Fox, D. B., Cucchiara, A., & Cenko, S. B. 2008, GRB Coordinates Network, 8335, 1
- Bloom et al. (2006) Bloom, J. S., Foley, R. J., Koceveki, D., & Perley, D. 2006, GRB Coordinates Network, 5217, 1
- Blustin et al. (2006) Blustin, A. J., Band, D., Barthelmy, S., et al. 2006, ApJ, 637, 901
- Butler et al. (2006) Butler, N. R., Li, W., Perley, D., et al. 2006, ApJ, 652, 1390
- Cenko et al. (2013) Cenko, S. B., Kulkarni, S. R., Horesh, A., et al. 2013, ApJ, 769, 130
- Chevalier & Li (2000) Chevalier, R. A., & Li, Z.-Y. 2000, ApJ, 536, 195
- Covino et al. (2010) Covino, S., Campana, S., Conciatore, M. L., et al. 2010, A&A, 521, A53
- Crew et al. (2005) Crew, G., Ricker, G., Atteia, J.-L., et al. 2005, GRB Coordinates Network, 4021, 1
- Crew et al. (2003) Crew, G. B., Lamb, D. Q., Ricker, G. R., et al. 2003, ApJ, 599, 387
- Crowther (2007) Crowther, P. A. 2007, ARA&A, 45, 177
- Cucchiara & Fox (2008) Cucchiara, A., & Fox, D. B. 2008, GRB Coordinates Network, 7654, 1
- Cummings et al. (2006) Cummings, J., Barthelmy, S., Barbier, L., et al. 2006, GRB Coordinates Network, 5124, 1
- Cusumano et al. (2006) Cusumano, G., Mangano, V., Angelini, L., et al. 2006, ApJ, 639, 316
- Daigne & Mochkovitch (1998) Daigne, F., & Mochkovitch, R. 1998, MNRAS, 296, 275
- Daigne et al. (2006) Daigne, F., Rossi, E. M., & Mochkovitch, R. 2006, MNRAS, 372, 1034
- de Pasquale & Cummings (2006) de Pasquale, M., & Cummings, J. 2006, GRB Coordinates Network, 5130, 1
- Deng et al. (2009) Deng, J., Zheng, W., Zhai, M., et al. 2009, arXiv:0912.5435
- Filgas et al. (2011) Filgas, R., Krühler, T., Greiner, J., et al. 2011, A&A, 526, A113
- Fugazza et al. (2005) Fugazza, D., Fiore, F., Patat, N., et al. 2005, GRB Coordinates Network, 3948, 1
- Fynbo et al. (2005) Fynbo, J. P. U., Jensen, B. L., Hjorth, J., et al. 2005, GRB Coordinates Network, 3176, 1
- Gehrels et al. (2008) Gehrels, N., Barthelmy, S. D., Burrows, D. N., et al. 2008, ApJ, 689, 1161
- Gendre et al. (2010) Gendre, B., Klotz, A., Palazzi, E., et al. 2010, MNRAS, 405, 2372
- Genet et al. (2007) Genet, F., Daigne, F., & Mochkovitch, R. 2007, MNRAS, 381, 732
- Ghirlanda et al. (2003) Ghirlanda, G., Celotti, A., & Ghisellini, G. 2003, A&A, 406, 879
- Ghirlanda et al. (2012) Ghirlanda, G., Nava, L., Ghisellini, G., et al. 2012, MNRAS, 420, 483
- Goldstein et al. (2012) Goldstein, A., Burgess, J. M., Preece, R. D., et al. 2012, ApJS, 199, 19
- Golenetskii et al. (2005) Golenetskii, S., Aptekar, R., Mazets, E., et al. 2005, GRB Coordinates Network, 4238, 1
- Goodman (1986) Goodman, J. 1986, ApJ, 308, L47
- Granot et al. (2008) Granot, J., Cohen-Tanugi, J., & do Couto e Silva, E. 2008, ApJ, 677, 92
- Grupe et al. (2009) Grupe, D., Marshall, F. E., Cummings, J. R., et al. 2009, GCN Report, 260, 1
- Guidorzi et al. (2008) Guidorzi, C., Stamatikos, M., Landsman, W., et al. 2008, GCN Report, 139, 1
- Guidorzi et al. (2011) Guidorzi, C., Kobayashi, S., Perley, D. A., et al. 2011, MNRAS, 417, 2124
- Hascoët et al. (2012) Hascoët, R., Daigne, F., Mochkovitch, R., & Vennin, V. 2012, MNRAS, 421, 525
- Huang et al. (2012) Huang, K. Y., Urata, Y., Tung, Y. H., et al. 2012, ApJ, 748, 44
- Huang et al. (2002) Huang, Y. F., Dai, Z. G., & Lu, T. 2002, MNRAS, 332, 735
- Hunsberger et al. (2005) Hunsberger, S. D., Marshall, F., Holland, S. T., et al. 2005, GCN Report, 4041, 1
- Jelinek et al. (2008) Jelinek, M., Kubanek, P., Gorosabel, J., et al. 2008, GRB Coordinates Network, 7648, 1
- Kaneko et al. (2006) Kaneko, Y., Preece, R. D., Briggs, M. S., et al. 2006, ApJS, 166, 298
- Krimm et al. (2005a) Krimm, H., Barbier, L., Barthelmy, S., et al. 2005a, GRB Coordinates Network, 4020, 1
- Krimm et al. (2005b) Krimm, H., Ajello, M., Barbier, L., et al. 2005b, GRB Coordinates Network, 4260, 1
- Landsman & Guidorzi (2008) Landsman, W. B., & Guidorzi, C. 2008, GRB Coordinates Network, 7660, 1
- Levesque (2013) Levesque, E. M. 2013, arXiv:1302.4741
- Li et al. (2003) Li, W., Filippenko, A. V., Chornock, R., & Jha, S. 2003, ApJ, 586, L9
- Liang et al. (2010) Liang, E.-W., Yi, S.-X., Zhang, J., et al. 2010, ApJ, 725, 2209
- Liang et al. (2013) Liang, E.-W., Li, L., Gao, H., et al. 2013, ApJ, 774, 13
- Lithwick & Sari (2001) Lithwick, Y., & Sari, R. 2001, ApJ, 555, 540
- Lü et al. (2012) Lü, J., Zou, Y.-C., Lei, W.-H., et al. 2012, ApJ, 751, 49
- Markwardt et al. (2008) Markwardt, C. M., Barthelmy, S. D., Baumgartner, W. H., et al. 2008, GRB Coordinates Network, 8338, 1
- Martin-Carrillo et al. (2008) Martin-Carrillo, A., Hanlon, L., McGlynn, S., et al. 2008, in Proc. 7th INTEGRAL Workshop, 2008 September 8–11 (Proceedings of Science: Copenhagen, Denmark), 16
- Meszaros & Rees (1997) Meszaros, P., & Rees, M. J. 1997, ApJ, 476, 232
- Molinari et al. (2007) Molinari, E., Vergani, S. D., Malesani, D., et al. 2007, A&A, 469, L13
- Nava et al. (2012) Nava, L., Salvaterra, R., Ghirlanda, G., et al. 2012, MNRAS, 421, 1256
- Oksanen & Hentunen (2008) Oksanen, A., & Hentunen, V.-P. 2008, GRB Coordinates Network, 7657, 1
- Paczynski (1986) Paczynski, B. 1986, ApJ, 308, L43
- Page et al. (2011) Page, K. L., Starling, R. L. C., Fitzpatrick, G., et al. 2011, MNRAS, 416, 2078
- Pandey et al. (2003) Pandey, S. B., Anupama, G. C., Sagar, R., et al. 2003, A&A, 408, L21
- Perley et al. (2008) Perley, D. A., Li, W., Chornock, R., et al. 2008, ApJ, 688, 470
- Perley et al. (2013) Perley, D. A., Levan, A. J., Tanvir, N. R., et al. 2013, arXiv:1301.5903
- Piran (2004) Piran, T. 2004, Reviews of Modern Physics, 76, 1143
- Porciani & Madau (2001) Porciani, C., & Madau, P. 2001, ApJ, 548, 522
- Quimby et al. (2006) Quimby, R. M., Rykoff, E. S., Yost, S. A., et al. 2006, ApJ, 640, 402
- Racusin et al. (2008) Racusin, J. L., Karpov, S. V., Sokolowski, M., et al. 2008, Nature, 455, 183
- Rees & Meszaros (1994) Rees, M. J., & Meszaros, P. 1994, ApJ, 430, L93
- Ryde (2004) Ryde, F. 2004, ApJ, 614, 827
- Rykoff et al. (2005) Rykoff, E. S., Yost, S. A., Krimm, H. A., et al. 2005, ApJ, 631, L121
- Rykoff et al. (2009) Rykoff, E. S., Aharonian, F., Akerlof, C. W., et al. 2009, ApJ, 702, 489
- Sakamoto et al. (2005) Sakamoto, T., Barthelmy, S., Barbier, L., et al. 2005, GRB Coordinates Network, 3173, 1
- Salvaterra et al. (2012) Salvaterra, R., Campana, S., Vergani, S. D., et al. 2012, ApJ, 749, 68
- Sari & Piran (1999) Sari, R., & Piran, T. 1999, A&AS, 138, 537
- Sari et al. (1998) Sari, R., Piran, T., & Narayan, R. 1998, ApJ, 497, L17
- Sato et al. (2005) Sato, G., Barbier, L., Barthelmy, S., et al. 2005, GRB Coordinates Network, 3951, 1
- Sollerman et al. (2007) Sollerman, J., Fynbo, J. P. U., Gorosabel, J., et al. 2007, A&A, 466, 839
- Spruit et al. (2001) Spruit, H. C., Daigne, F., & Drenkhahn, G. 2001, A&A, 369, 694
- Stamatikos et al. (2007) Stamatikos, M., Barthelmy, S. D., Cummings, J., et al. 2007, GRB Coordinates Network, 7029, 1
- Stamatikos et al. (2009) Stamatikos, M., Cummings, J. R., Evans, P. A., et al. 2009, GRB Coordinates Network, 9768, 1
- Starling et al. (2009) Starling, R. L. C., Rol, E., van der Horst, A. J., et al. 2009, MNRAS, 400, 90
- Thompson & Madau (2000) Thompson, C., & Madau, P. 2000, ApJ, 538, 105
- Uehara et al. (2012) Uehara, T., Toma, K., Kawabata, K. S., et al. 2012, ApJ, 752, L6
- Uhm & Beloborodov (2007) Uhm, Z. L., & Beloborodov, A. M. 2007, ApJ, 665, L93
- Ukwatta et al. (2008) Ukwatta, T. N., Barthelmy, S. D., Baumgartner, W. H., et al. 2008, GRB Coordinates Network, 8599, 1
- Vink et al. (2001) Vink, J. S., de Koter, A., & Lamers, H. J. G. L. M. 2001, A&A, 369, 574
- Wanderman & Piran (2010) Wanderman, D., & Piran, T. 2010, MNRAS, 406, 1944
- Wei & Gao (2003) Wei, D. M., & Gao, W. H. 2003, MNRAS, 345, 743
- Wiersema et al. (2008) Wiersema, K., van der Horst, A. J., Kann, D. A., et al. 2008, A&A, 481, 319
- Wiersema et al. (2012) Wiersema, K., Curran, P. A., Krühler, T., et al. 2012, MNRAS, 426, 2
- Woosley & Heger (2006) Woosley, S. E., & Heger, A. 2006, ApJ, 637, 914
- Wren et al. (2008) Wren, J., Vestrand, W. T., Wozniak, P. R., Davis, H., & Norman, B. 2008, GRB Coordinates Network, 8337, 1
- Yonetoku et al. (2004) Yonetoku, D., Murakami, T., Nakamura, T., et al. 2004, ApJ, 609, 935
- Yuan et al. (2010) Yuan, F., Schady, P., Racusin, J. L., et al. 2010, ApJ, 711, 870
- Zaninoni et al. (2013) Zaninoni, E., Bernardini, M. G., Margutti, R., Oates, S., & Chincarini, G. 2013, A&A, 557, A12