A portrait of the extreme Solar System object 2012 DR30††thanks: Herschel is an ESA space observatory with science instruments provided by European-led Principal Investigator consortia and with important participation from NASA.
2012 DR30 is a recently discovered Solar System object on a unique orbit, with a high eccentricity of 0.9867, a perihelion distance of 14.54 AU and a semi-major axis of 1109 AU, in this respect outscoring the vast majority of trans-Neptunian objects. We performed Herschel/PACS and optical photometry to uncover the size and albedo of 2012 DR30, together with its thermal and surface properties. The body is 185 km in diameter and has a relatively low V-band geometric albedo of 8%. Although the colours of the object indicate that 2012 DR30 is an taxonomy class TNO or Centaur, we detected an absorption feature in the -band that is uncommon among these bodies. A dynamical analysis of the target’s orbit shows that 2012 DR30 moves on a relatively unstable orbit and was most likely only recently placed on its current orbit from the most distant and still highly unexplored regions of the Solar System. If categorised on dynamical grounds 2012 DR30 is the largest Damocloid and/or high inclination Centaur observed so far.
Key Words.:
Kuiper belt: general – individual (2012 DR 30)1 Introduction
2012 DR30 was discovered on February 26, 2012 (MPEC 2012-D67) as part of the Siding Spring Survey111http://www.mso.anu.edu.au/ rmn/index.htm. Shortly after the discovery of 2012 DR30, it was realised that the object was identical to the object 2009 FW54. As a result of that identification, it has been possible for the object’s orbit to be determined with relatively high precision, based on 142 observations made between February 2008 and April 2012. The orbit is rather peculiar with a semi-major axis of a = 1109 AU, eccentricity of e = 0.9869 and inclination of i = 7800. The object is currently close to its perihelion, q = 14.54 AU on its 37 thousand-year long orbit (see also the Minor Planet Center page of 2012 DR30222http://www.minorplanetcenter.net/db_search/ show_object?object_id=2012+dr30).
Following Gladman et al. (2008), 2012 DR30 would most likely be classified as a Scattered Disk Object. However, the Gladman et al. scheme was mainly focussed on understanding the behaviour of objects originating in the trans-Neptunian region, and so such a classification would naturally lead the reader to infer an origin for 2012 DR30 in the trans-Neptunian population. On the other hand, Brasser et al. (2012) consider objects on orbits like that of 2012 DR30 to be high inclination Centaurs, and, along with Emel’yanenko et al. (2005), have suggested that the origin for these objects could well be the inner Oort cloud, rather than the trans-Neptunian belt. Currently, only three objects are categorised as high inclination Centaurs: 2002 XU93, 2008 KV42 and 2010 WG9 (Brasser et al., 2012).
Considering the high eccentricity and inclination of 2012 DR30’s orbit, another way to categorise it might be to consider it a high-perihelion, long-period comet since it shares many characteristics with those objects (as its perihelion distance is 15 AU, it is not classified as having cometary dynamics according to the Gladman et al. (2008) scheme that requires TJ 3.05 and q 7.35 AU). Many objects moving on typical Centaur orbits were classified as comets on the basis of cometary activity at discovery – this has not, to date, been observed in the case of 2012 DR30.
Given the similarity of the orbit of 2012 DR30 to those of the long period comets it is worth considering a different mechanisms proposed to emplace objects in such orbits. An object with an aphelion distance of 1000 AU is typically considered to be too tightly bound to the Sun for its orbit to be significantly perturbed by the influence of the galactic tide or close encounters with passing stars (processes which are considered far more important at aphelion distances of 10,000 AU, or greater). The orbital evolution of such objects is thought to currently be driven by chance encounters with the giant planets: cometary bodies moving on short-period orbits within the outer Solar System are regularly scattered to longer period orbits – or even entirely ejected from the Solar system (Horner et al., 2004b). Typically, however, objects on highly eccentric orbits (with aphelia at thousands, or tens of thousands of AU) are thought to have been be recently injected from the Oort cloud. The classical route through which such objects are emplaced to their current orbits involves their injection from the outer Oort cloud, where their orbits can be strongly modified by the influence of the galactic tide and the gravitational influence of passing stars (e.g. Wiegert & Tremaine, 1999; Dones et al., 2004; Rickman et al., 2008).
Whilst this mechanism is good at explaining the observed distribution of long-period comets with perihelion distances in the range 5–10 AU, it has great difficulties explaining the existence of the high-inclination Centaurs (as described by e.g. Brasser et al., 2012). These objects display high perihelion distances (e.g. 14.54 AU, in the case of 2012 DR30), which would typically be considered as too distant for Jupiter and Saturn to easily decouple the object’s orbital evolution from the influence of passing stars and the galactic tide. The aphelion distance of these objects, however is significantly too small for them to have been injected to their current orbit by a passing star or by the galactic tide. For this reason, a number of authors have proposed that such objects are instead sampling the inner Oort cloud population (e.g. Emel’yanenko et al., 2005; Brasser et al., 2012).
Since 2012 DR30 falls very close to the tenuous q 15 AU boundary between those objects that could theoretically be decoupled from the outer Oort cloud by the influence of Jupiter and Saturn, and those objects that could not be captured in this way, it is clearly had to definitively argue for one particular origin over the other. In either case, however, it seems reasonable that it could well be a relatively recent entrant to the inner reaches of the Solar System.
On dynamical grounds 2012 DR30 also shows similarities to the group of Damocloids which are thought to be inactive Halley-type or long-period comets. According to the definition given by Jewitt (2005) objects in this group have a Tisserand-parameter relative to Jupiter TJ , and indeed, this parameter for 2012 DR30 is TJ = 0.198. On the other hand, these objects have perihelion distances typically q 5 AU and are small (HV 10) in most cases, unlike 2012 DR30 (HV 7). Some of the few exceptions are the three high incination Centaurs mentioned above which are also Damocloids according to their TJ-s. These objects should be relatively large (HV 80-90). A reliable size estimate is only available for 2002 XU93, which has an effective diameter of 1649 km, based on thermal emission measurements with the Herschel Space Observatory (Santos-Sanz et al., 2012). The surfaces of the Damocloids are among the darkest ones known in the Solar System – the objects for which albedos are known so far all have pV 0.04 (see Jewitt, 2005; Santos-Sanz et al., 2012).
In the case of 2012 DR30 it is clearly interesting to consider whether there might be any observational evidence that could support one possible origin over another, particularly if 2012 DR30 could be recently placed to its current orbit from the inner Oort cloud. Apart from dynamical behaviour, evidence may also come e.g. from surface characteristics reflecting the different evolutionary paths this object might have taken. In this paper we investigate the basic physical properties of 2012 DR30 with the help of thermal emission and optical follow-up photometry observations and try to relate these to the dynamics of the orbit of this peculiar object.
| Telescope | OBSID | Band | Start-time | Start time | r | ||
|---|---|---|---|---|---|---|---|
| & instrument | (JD-2450000) | (AU) | (AU) | (deg) | |||
| Herschel/PACS | 13421246148 | 70/160m | 2012-May-25 23:31 | 6073.479 | 14.671 | 14.509 | 3.971 |
| Visit-1 | 13421246149 | 70/160m | 2012-May-25 23:55 | 6073.496 | 14.671 | 14.509 | 3.971 |
| 13421246150 | 100/160m | 2012-May-26 00:20 | 6073.513 | 14.671 | 14.509 | 3.972 | |
| 13421246151 | 100/160m | 2012-May-26 00:45 | 6073.531 | 14.671 | 14.509 | 3.972 | |
| Herschel/PACS | 13421246215 | 70/160m | 2012-May-27 21:48 | 6075.408 | 14.672 | 14.539 | 3.985 |
| Visit-2 | 13421246216 | 70/160m | 2012-May-27 22:13 | 6075.425 | 14.672 | 14.539 | 3.985 |
| 13421246217 | 100/160m | 2012-May-27 22:38 | 6075.443 | 14.672 | 14.540 | 3.985 | |
| 13421246218 | 100/160m | 2012-May-27 23:02 | 6075.459 | 14.672 | 14.540 | 3.986 | |
| WISE | – | 11/22m | 2010-May-25 20:37 | 5342.359 | 14.600 | 14.482 | 3.964 |
| W3/W4 | – | 11/22m | 2010-May-26 04:33 | 5342.690 | 14.600 | 14.488 | 3.966 |
| – | 11/22m | 2010-May-26 06:09 | 5342.756 | 14.600 | 14.489 | 3.966 | |
| – | 11/22m | 2010-May-26 07:44 | 5342.822 | 14.600 | 14.490 | 3.966 | |
| – | 11/22m | 2010-May-26 09:19 | 5342.888 | 14.600 | 14.491 | 3.967 | |
| – | 11/22m | 2010-May-26 10:54 | 5342.954 | 14.600 | 14.492 | 3.967 | |
| – | 11/22m | 2010-May-26 14:05 | 5343.087 | 14.600 | 14.494 | 3.968 | |
| 2.2m/WFI | – | B (451 nm) | 2012-Jun-07 00:51 | 6085.036 | 14.671 | 14.520 | 3.975 |
| 2.2m/WFI | – | V (540 nm) | 2012-Jun-06 23:55 | 6084.996 | 14.671 | 14.520 | 3.975 |
| 2.2m/WFI | – | R (652 nm) | 2012-Jun-07 01:00 | 6085.042 | 14.671 | 14.520 | 3.975 |
| 2.2m/WFI | – | I (784 nm) | 2012-Jun-07 01:10 | 6085.049 | 14.671 | 14.520 | 3.975 |
| 2.2m/WFI | – | Z (964 nm) | 2012-Jun-07 01:29 | 6085.062 | 14.671 | 14.520 | 3.975 |
2 Observations and data reduction
2.1 Herschel/PACS observations
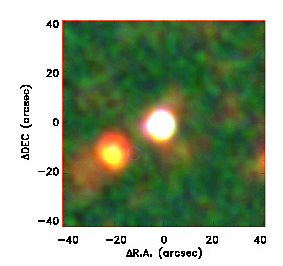
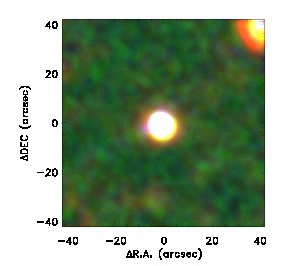
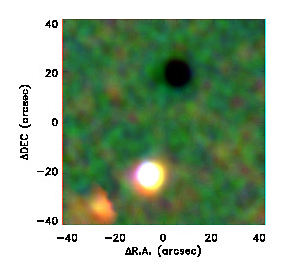
Thermal emission of 2012 DR30 was observed with the PACS photometer camera (Poglitsch et al., 2010) of the Herschel Space Observatory (Pilbratt et al., 2010) using the time awarded in a DDT proposal exclusively for 2012 DR30 (proposal ID: DDT_ckiss_2). The observations were performed in mini-scanmap mode, homogeneously covering a field of roughly 1′ in diameter (Fig. 1). This mode is suited for our needs and offers more sensitivity than other observation modes of the PACS photometer (Müller et al., 2010).
The reduction of raw data was performed in the Herschel Interactive Pipeline Environment (HIPE, Ott 2011) using an optimized version of the PACS bright point source pipeline script without the application of proper motion correction due to slow motion of the target relative to the telescope beam size during a single OBSID (1″). We derived single epoch co-added images in each Herschel/PACS band, as well as differential and ”double-differential” images combining the data of the two epochs in order to get rid of the confusion due to the sky background. Differential images are created by subtracting the co-added image of the second visit from that of the first visit image of the same band. This eliminates the background and leaves a positive and a negative beam of the target on the image. The ideal matching of the two image frames is obtained using a fluctuation minimalisation method. To create a double differential image, a copy of the differential image is folded and shifted in a way that the positive beams of the two visits are matched in position and then co-added, providing a positive beam with the average flux of the target, plus two negative beams on the sides with fluxes about half the central, positive beam (the photometry is performed on the central beam). The procedure to create these images, and also the photometry of the target was performed in the same way as it is described in detail in Pál et al. (2012); Vilenius et al. (2012); Santos-Sanz et al. (2012). The photometric fluxes we obtained are summarized in Table 2.
| Band | Epoch | Fcoadd | Fdiff | Fddiff |
|---|---|---|---|---|
| (m) | (mJy) | (mJy) | (mJy) | |
| 70 | Visit-1 | 92.831.45 | 91.800.88 | 88.560.62 |
| 70 | Visit-2 | 89.411.25 | 87.180.88 | |
| 100 | Visit-1 | 64.121.46 | 63.871.20 | 62.400.91 |
| 100 | Visit-2 | 66.221.94 | 62.081.20 | |
| 160 | Visit-1 | 37.832.38 | 32.821.34 | 34.481.13 |
| 160 | Visit-2 | 40.372.66 | 36.521.34 |
2.2 MPG/ESO 2.2 m optical follow-up at La Silla
We performed photometric measurements of 2012 DR30 in a service mode Max-Planck-Institut für Astronomie (MPIA) DDT observation at La Silla Observatory, Chile, using the MPG/ESO 2.2m telescope (PID 089.A–9031(A)).
Data were taken with the Wide Field Imager on June 6, 2012 and consist of images in filters B (BB#B/123_ESO878, 60s), V (BB#V/89_ESO843, 60s), R (BB#Rc/162_ESO844, 60s), I (BB#I/203_ESO879, 60s) and Z (BB#Z+/61_ESO846, 280s). We used three individual exposures for the B, V, R and I filters each, while the Z had six exposures. The Cambridge Astronomical Survey Unit pipeline (Irwin & Lewis, 2001) was used to combine the bias frames and dome flat fields, obtained on the same night, into master bias and master flat frames which were then used for the bias subtraction and flat fielding. Preliminary source extraction and astrometry, crossmatched with the 2MASS point source catalogue (Skrutskie et al., 2006), were determined for all the reduced frames allowing the multiple observations per filter to be each stacked into a deeper image. The multiple I and Z frames were median combined to form fringe frames which were then used to defringe the individual I and Z frames before stacking. The source extraction and astrometry were then repeated and refined on the stacked frames with an accuracy of better than 0. The seeing was typically better than 1 during the observations.
standard stars were taken from SA 104 in the Landolt (1992) catalog to measure the photometric nature of the night. A field overlapping with SDSS was observed to provide a reference for the Z band. images were then transformed to SDSS magnitudes following two methods: (i) synthetic magnitudes calculated for field stars (Rodgers et al., 2006), and (ii) standard stars in the SDSS stripe #1540 (RA= 11:29:30 Dec= –07:00:02) in 15∘ vicinity of 2012 DR30. The two methods gave consistent zeropoints within mag. Atmospheric extinction coefficients were taken from ESO website for La Silla333www.ls.eso.org.
2.3 WISE observations of 2012 DR30
2012 DR30 was not seen by the Wide-field Infrared Survey Explorer (WISE Wright et al., 2010) according to the MPC entries and the WISE search tools. It might be that 2012 DR30 was not yet known at the time the Solar System search programmes were executed (see e.g. Mainzer et al., 2011) or that it simply was not recognised as moving target due to its slow apparent sky motion of only 1-5′′/h. But based on the PACS measurements and flux extrapolations to the WISE W3 (11.56 m) and W4 (22.09 m) bands it became clear that WISE must have seen 2012 DR30.
We found the source J103104.77+005635.9 within 1′′ of the 2012 DR30 path in the WISE all-sky source catalog444http://irsa.ipac.caltech.edu/applications/wise/. The W3 and W4 magnitudes are 12.037 and 6.900, respectively. The WISE image catalog shows a sequence of several detections in W4, but the source is clearly moving and appears elongated. We therefore used the WISE all-sky single exposure (L1b) source table which includes several source detections along the apparent sky path of 2012 DR30. The seven W3-detections (with S/N 2) and the nine W4-detections were taken in the period MJD 55341.85947 – 55342.58708 (mean: 55342.24166). The weighted mean W3-band magnitude was 1088022 and the typical S/N was about 3, the weighted mean W4-band magnitude was 595016 and the typical S/N was about 10.
We converted the observed magnitudes via the Vega model spectrum into fluxes. Due to the red colour of 2012 DR30 (compared to the blue calibration stars) there is an additional correction needed (see Wright et al., 2010) and the W3-flux has to be increased by 17% and the W4-flux has to be lowered by 9%. It is also necessary to apply a colour correction, which we calculated via a TPM prediction of the spectral energy distribution of 2012 DR30 (corresponding roughly to a black body temperature of slightly above 100 K). The colour correction factors are 2.35 ( 10%) in W3 and 1.00 ( 1%) in W4. The large error for the W3 colour correction is due to the uncertain shape of the SED at these short wavelengths. We also added a 10% error for the absolute flux calibration in W3 and W4 which was estimated from the discrepancy between red and blue calibrators (Wright et al., 2010) and we combined all errors quadratically. The final mono-chromatic flux densities at the WISE reference wavelengths are listed in Table 3.
| Instrument | Band/Wavelength | Cλ | rcorr | rcal | Fmeas | Finp |
|---|---|---|---|---|---|---|
| (m) | (mJy) | (mJy) | ||||
| WISE (W3) | 11.6 m | 2.350.24 | 1.17 | 0.10 | 1.290.26 | 0.640.16 |
| WISE (W4) | 22.1 m | 1.000.01 | 0.91 | 0.10 | 34.505.10 | 31.45.6 |
| Herschel/PACS | 70 m | 0.990.02 | 1.00 | 0.05 | 88.560.62 | 89.453.29 |
| Herschel/PACS | 100 m | 1.010.02 | 1.00 | 0.05 | 62.400.91 | 61.782.39 |
| Herschel/PACS | 160 m | 1.0450.020 | 1.00 | 0.05 | 34.481.13 | 33.002.07 |
2.4 Light curve observations
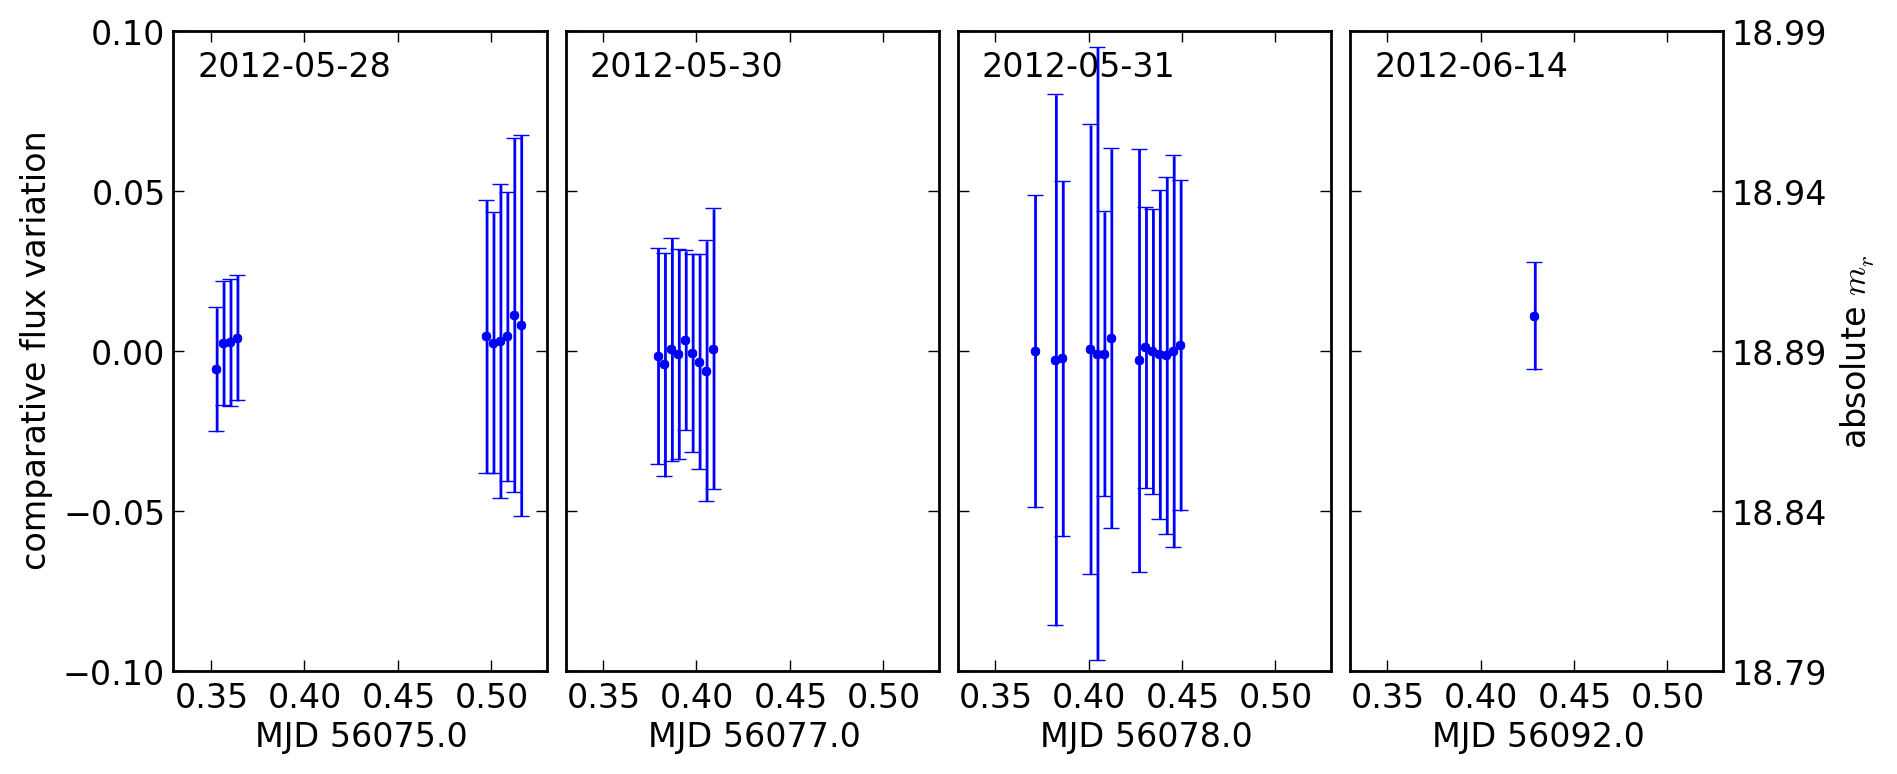
We obtained visible-light imagery of 2012 DR30 with queue observations on the 2 m Faulkes South telescope at Siding Spring Observatory, NSW. The Spectral camera of Faulkes South that we used has a plate scale of 0.304 arcsec/pixel, with a 4k4k CCD array, giving a field of view of 10.5 arcmin.
We observed 2012 DR30 through the Sloan Digital Sky Survey r’ filter on four nights, as detailed in Table 5. On each night, consecutive 300 s exposures were obtained with 2012 DR30 centred on the array; the 2x2 binning set a readout time between exposures of 22 s. The rate of motion of 2012 DR30 across the sky was 0.9″/hr (a quarter-pixel, 75 milliarcsec, in 5 minutes), which kept it well within the seeing disk of ″over each integration. Due to the low altitude of 2012 DR30, the longest continuous set of observations were made over less than two hours. 34 integrations were made in total, excluding nine images where the seeing deteriorated below where 2012 DR30 could be detected.
Bias subtraction, flatfielding and astrometry were provided by the standard Faulkes queue pipeline. The flatfielding varied in quality due to proximity to the Moon on some of the nights, creating a pocked ”golf course” effect in places, but 2012 DR30 did not fall on any problematic locations in these observations. We then used SExtractor (Bertin & Arnouts, 1996) to obtain the flux of 2012 DR30 from the reduced images.
The 10 arcmin field of view provided ample suitably bright field stars, from which we selected eleven to act as comparison stars and cancel the effects of atmospheric variability (Table 6). The selection was based on their photometric stability, lack of saturation, no blends or other close stars, and their spatial distribution on the field; the mutual relative photometry of these eleven stars varied by less than 0.01 mag across all the observations. We then measured the differential brightness variation of 2012 DR30 against these stars.
The field on which 2012 DR30 fell during our observations (R.A. , decl. ) was too far south to be within the SDSS photometric catalog. We instead used the AAVSO Photometric All-Sky Survey (APASS) Data Release 6 survey catalog for absolute calibration of the magnitudes of the comparison stars. Four had matches within 2.2″-0.5″in the catalogue (Table 6); these matches were confirmed by visual inspection of the images. The known catalogue magnitudes allowed us to tie the zeropoint of the differential variation of 2012 DR30 to an absolute magnitude. The scatter in the shift between the observed stellar magnitude and the catalogue value for the four comparison stars was 0.2 magnitudes; we therefore note that the internal precision in the relative photometry is much greater and provides a better measure of the variability of 2012 DR30.
We used these comparative photometric measurements of 2012 DR30 to construct a light curve (Fig. 2). This showed very little variation and indicated an upper limit of 0004 1-sigma variability when only the standard deviation of the target’s band brightness values are considered. Note that the uncertainty of the individual measurements are dominated by the error of absolute calibration with a typical value 005 (see also Fig. 2). We tried to fit a rotation period but the periodogram showed aliases only at one- and half-day periods, which would be spurious effects from the cadence of the observations. As a summary of these observations we can conclude that we have not been able to detect the light curve of 2012 DR30 at the 005 level in the band. It would be useful in the future to obtain a further light curve in multiple colours ( and ) to confirm if there is any more subtle colour-dependent variability, which could indicate either surface composition or topographic variation.
3 Characteristics derived from visual range and infrared measurements
3.1 Absolute brightness, colours and phase correction
We used the MPG/ESO 2.2m to calculate HV of 2012 DR30 as well as 66 points of V-band data in the Minor Planet Center database as auxiliary data to calculate the absolute brightness of 2012 DR30. As these data points cover the phase angle range of 10 37, we were able to fit the slope parameter with a straight line and we obtained = 0.1370.089. We assigned a general error bar of 03 to the MPC V-band data points, the median difference reported between MPC and well-calibrated photometry (Romanishin & Tegler, 2005; Benecchi et al., 2011).
The MPG/ESO 2.2 m telescope observations provided absolute magnitudes and colours, as listed in Table 4. Using the V-band brightness, the geometry information at the observation epoch and the value we obtained from MPC data we calculated the V-band absolute brightness of 2012 DR30. The heliocentric and observer-to-target distances and the phase angle of the observation were r = 14.678 AU, = 14.70 AU and = 3952, respectively. Based on the observed brightness of V = 192540.023 we obtained HV = 704035.
| Band | Magnitude | Uncertainty |
| B | 19.901 | 0.030 |
| V | 19.254 | 0.023 |
| R | 18.691 | 0.025 |
| I | 18.269 | 0.026 |
| Z | 18.900 | 0.075 |
| B–V | 0.647 | 0.038 |
| V–R | 0.563 | 0.034 |
| R–I | 0.422 | 0.036 |
| B–I | 1.632 | 0.040 |
3.2 NEATM models of the thermal emission
We used the Near-Earth Asteroid Thermal Model (NEATM, Harris 1998) to estimate the main characteristics of the target combining the fluxes of its reflected light and thermal infrared emission. The input fluxes used for the NEATM model (as well as for the thermophysical model discussed in the next subsection), are calculated from the observed fluxes in the way described in Sect. B.
In our NEATM modelling the beaming parameter , in addition to the effective diameter and geometric albedo, was treated as a free parameter and therefore fitted to our data points. The quality of the fit is characterised by the reduced values (described e.g. in Vilenius et al., 2012).
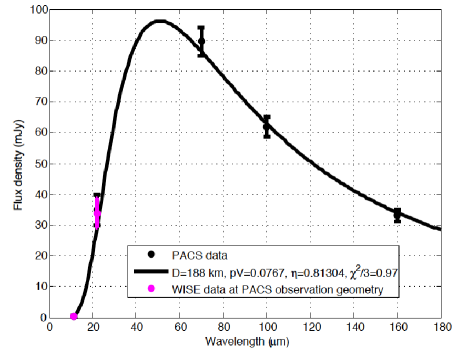
We considered two sets of data points. In the first one we used the combined, ”double differential” Herschel/PACS fluxes in the 70, 100 and 160 m bands (three data points, see Table 3), while in a second set we used the 11 and 22 m WISE fluxes as well (altogether five data points). The ”best-fit” result is presented in Fig. 3. The ”PACS only” fit provides the best-fit parameters of Deff = 17317 km, pV = 9.1% and = 0.57. Using the five ”PACS+WISE” data points the best-fit quantities are Deff =188.0 9.4 km, pV = 7.6% and = 0.813.
The low value of the parameter (0.8) is very close to the canonical value 0.756 used for main belt asteroids and is different from the mean value of = 1.200.35 in the trans-Neptunian population (Stansberry et al., 2008; Lellouch et al., 2012). Trans-Neptunian objects, however, show a rather wide range of beaming parameters. Recent results indicate an average value of = 1.110.15 for Plutinos (Mommert et al., 2012), = 1.140.15 for Scattered Disk Objects (Santos-Sanz et al., 2012) and = 1.470.43 for Classicals (Vilenius et al., 2012). Although the beaming parameters derived for Centaurs are rather similar to those of other trans-Neptuinan object classes (with a median value of = 1.120.38 Lellouch et al., 2012), there are a few Centaurs with values close to or below that of 2012 DR30, down to 0.4.
3.3 Thermophysical modeling of the infrared emission
We also used a thermophysical model (TPM) approach (Müller & Lagerros, 1998, 2002, and references therein) to obtain the main surface characteristics of our target (size, albedo, thermal inertia, surface roughness), based on the Herschel/PACS and WISE data (for details of the present model see Müller et al., 2010). As the object was bright, and photometry could be performed with a relatively high signal-to-noise ratio, we used the thermal fluxes of the two epochs independently (the differences in the fluxes at the two epochs might reflect rotational variations). Unfortunately the rotation period could not be inferred from the light curve observations (see Sect. 2.4). The results we obtained show that the object has a low thermal inertia below 4 (assuming Psid = 6 h) or below 9 (Psid = 24 h), except if we have seen it pole-on (in this latter case our model is not able to provide any constraints on the object’s thermal inertia). These two rotation periods encompass the majority of the known TNO/Centaur rotation periods. We note from this that the influence of the rotation period on the derived results for 2012 DR30 is very minor. A low surface roughness (very smooth surface) is not compatible with the observed fluxes, independent of spin-vector orientation, rotation period or thermal inertia. The possible size range is 183 - 198 km, using the requirement that reduced -values can be allowed up to = 1.38 in the case of five independent measurement points. The possible albedo range is 0.060 - 0.085, allowing the same range and also including a 01 error for the H-magnitude Allowing for the full 0.35 mag error for HV (see Section 3.1) would lead to a possible albedo range of 0.055 – 0.111 in our TPM analysis. The best fit TPM solution for equator-on geometry provides = 0.4 , high roughness, D = 184.1 km and pV = 0.078, with a corresponding value of 0.58. The pole-on situation produces an even better fit with a -value of 0.51, and with the corresponding size and albedo ranges of D =183 - 186 km and pV = 0.070 - 0.085 while in this case the thermal inertia is not constrained.


3.4 Colours and visual reflectance
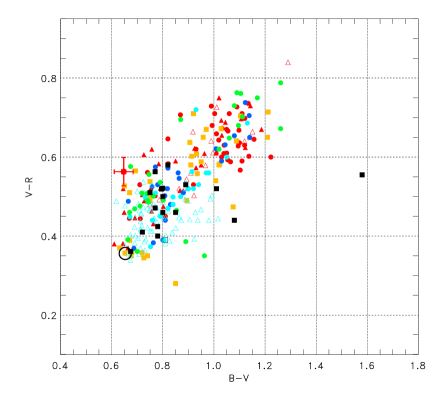
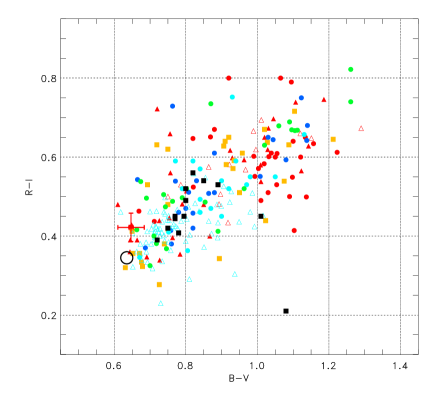
We plotted the B–V vs. V–R and B–V vs. R–I colours of 2012 DR30 along with those of other outer Solar System objects using the MBOSS-2 database (see fig.5 in Hainaut et al., 2012). Compared to the colours of other bodies, 2012 DR30 is certainly ”blue” when its B–V colour is considered (close to the solar value), while it shows colours closer to the population average in R–I, and especially in R–I.
When comparing our observations of 2012 DR30 to the observed colours of the Centaurs alone (the green filled circles in Fig. 5), we find that 2012 DR30 has a noticeably lower B–V colour than any of the Centaurs in the MBOSS sample. In the other colours (V–R and R–I) its colours are not vastly different to those of the Centaurs, but are close to the ”blue” side of the distributions. We note that the colours of 2012 DR30 are in general very close to those of 2002 DH5.
As dynamically 2012 DR30 would also fit into the group of Damocloids (black symbols in Fig. 6) we also compared the colours of these objects with those of 2012 DR30. While Damocloids seem to follow the main colour trend (blue dashed line) of the TNO taxonomy classes, the colours of 2012 DR30 are rather different form those of the other group members. In addition we also plotted the average colours of S- and V-type asteroids. The colours of 2012 DR30 are definitely different from the S-type colours, but are close to the colours of V-type asteroids (green and orange symbols in Fig. 6, respectively).
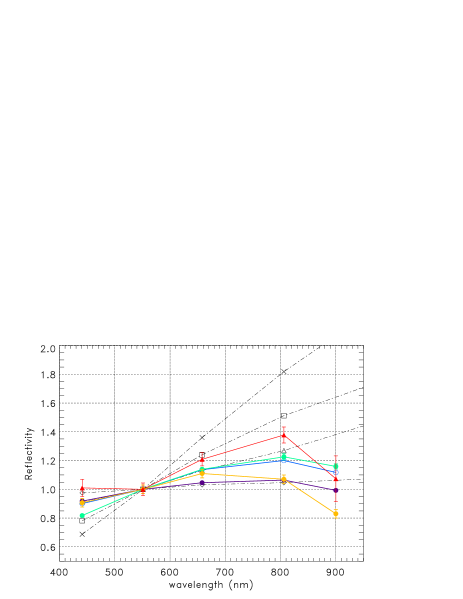
Using the absolute brightness values derived from the MPG/ESO 2.2 m measurements we calculated normalized reflectance using the solar colours of the SDSS magnitude transformation page555http://www.sdss.org/dr5/algorithms/sdssUBVRITransform.html. 2012 DR30 is represented by the red curve in Fig. 7. The most obvious feature one can identify is the presence of a strong Z-band absorption feature which is not seen in any of the main TNO taxonomy classes. Some objects with methane on their surfaces show absorption in the Z-band due to the 890 nm CH4 line. However, these are large and very high albedo objects, like Eris and Makemake (Alvarez-Candal et al., 2011; Brown et al., 2007, respectively). The normalized reflectivity curves of these objects are plotted in Fig. 7 as well. As 2012 DR30-s geometric albedo is 8 per cent only, it would be very challenging to construct a surface composition which can reproduce the observed reflectivity, since even a smaller amount of methane could increase the albedo considerably and this is incompatible with the present albedo of the object.
Z-band absorption, however, can be relatively easily reproduced if it is due to the presence of olivine or pyroxene (with the strongest absorbance at 1 m), as it is the case in S- and V-type asteroids. Concerning just the depth of the -band absorption, the reflectance of V-type asteroids ressembles the most to that of 2012 DR30, however, with a notably different spectral slope at the shorter wavelengths. On the other hand, reflectivities of V-type asteroids may be modified by space weathering effects (Hiroi & Sasaki, 2012; Binzel et al., 2004), resulting in a reflectance more similar to that of 2012 DR30. A-type asteroids have similar reflectance spectra due to olivine (DeMeo et al., 2009).
4 The dynamics of 2012 DR30
In order to examine the dynamical behaviour of 2012 DR30, we used the Hybrid integrator within the n-body dynamics package MERCURY (Chambers, 1999) to follow the evolution of the orbit under the gravitational influence of Jupiter, Saturn, Uranus and Neptune for a period of 4 Gyr into the future. Following a procedure established in earlier works (Horner et al., 2004a; Horner & Lykawka, 2010; Horner et al., 2012a, b) we created a suite of test particles distributed in even sized steps across the 3-sigma error ellipses of the object’s best-fit orbit in perihelion distance, , eccentricity, , and inclination, . In this way, we created a grid of 454545 = 91,125 test particles in q-e-i space, centred on the nominal best-fit orbit for 2012 DR30. Each of these test particles was then followed in our integrations until it was removed from the system, either by colliding with one of the massive bodies (i.e. the Sun or one of the giant planets) or being ejected to a heliocentric distance of 10,000 AU.

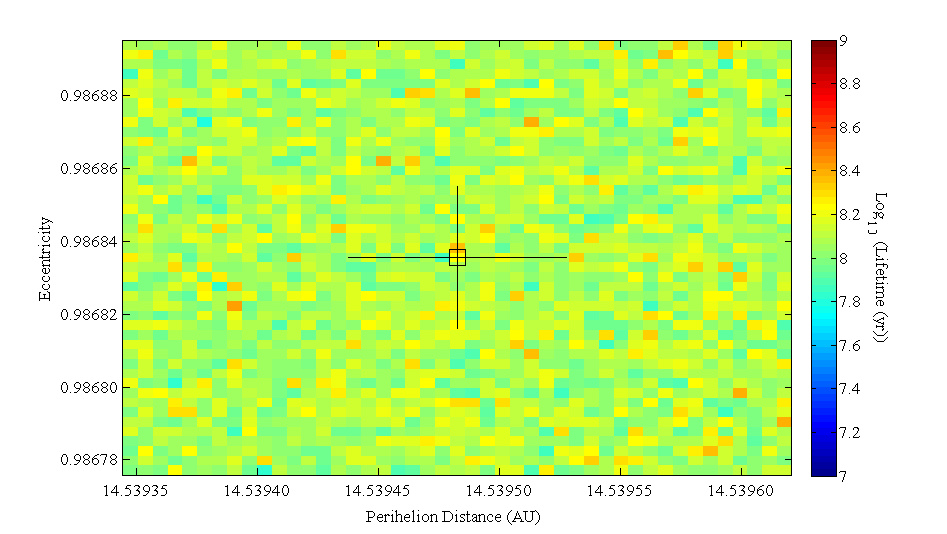
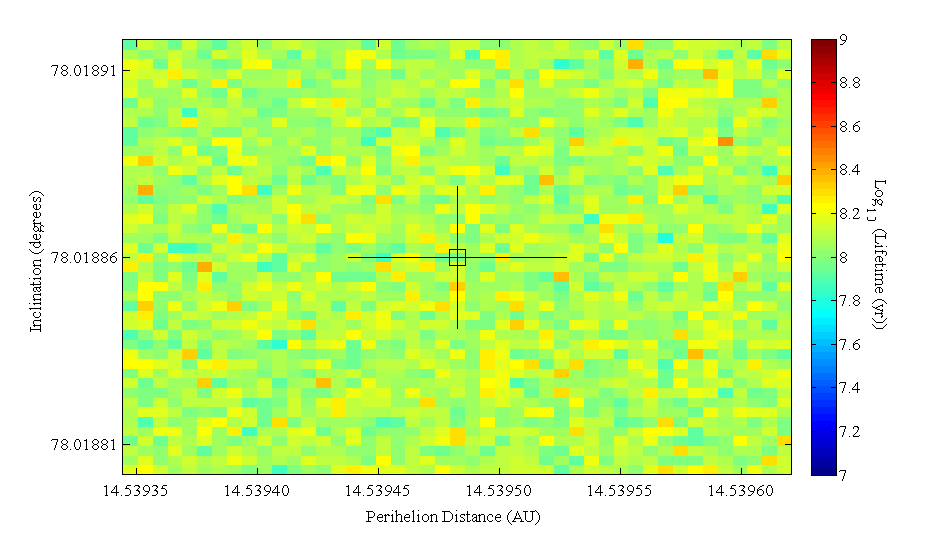
Lower panel: The same as the upper panel but for inclination instead of eccentricity. We note that the stability of 2012 DR30 does not vary significantly as a function of the initial eccentricity or inclination and perihelion distance used, a reflection of the relatively high precision with which the object’s orbit is known.

It is immediately apparent (see Fig. 8) that 2012 DR30 is moving on a relatively dynamically unstable orbit, and that the number of clones that survive, as a function of time, decays exponentially. Half of the test particles are removed from the Solar System within just 75.5 Myr. Only 16 of the test particles survived for the full 4 Gyr of our integrations -– just 0.0176 per cent of the total! The exhibited instability is independent of the initial perihelion distance, eccentricity, and inclination tested (see Fig. 9), although this is not hugely surprising, given the remarkably small uncertainties in the orbit of the object. Nevertheless, this result is reassuring, in that it tells us that the dynamical behaviour we observe for the object is truly representative, in contrast to previous studies of Solar System objects such as the Neptun trojan 2008 LC18, whose long-term behaviour was strongly dependent on the initial conditions considered (Horner et al., 2012a).
With our large dynamical dataset on the evolution of 2012 DR30, it is possible to work out the frequency with which clones of that object become Earth-crossing objects, or how much time they spend approaching the Sun to within a given distance. Since dynamical evolution under the influence of gravity alone is a time-reversible process, this can then give us some indication of the likelihood that 2012 DR30 has, in the past, occupied such orbits, as well as enabling us to estimate how long it has already spent within a given heliocentric distance.
Taken over all the clones in our runs, the mean clone lifetime was 124.26 Myr. As the clones of 2012 DR30 evolved, they diffused in orbital element space such that 10808 became Earth-crossing objects at some point in their evolution, albeit typically only for very short periods of time. Just over a third of the test particles evolved onto orbits with perihelia under the control of Jupiter (i.e. within a heliocentric distance of 6 AU), a result entirely in keeping with previous studies of the Centaurs (Horner et al., 2004a).
Given that 2012 DR30 currently spends the great majority of its time at vast heliocentric distances, it is interesting to ask what fraction of its life it has likely spent closer to the Sun than a given heliocentric distance. Over the entirety of our runs (91,125 test particles with a mean lifetime of 124.26 Myr), we find that the mean amount of time clones spent at heliocentric distances of less than 1 AU was just 1.5 years ( % of their lifetime). The mean time spent within 10 AU of the Sun was 4,400 years ( % of their lives), while the mean time spent within 100 AU was 3.3 Myr (2.7 % of their lifetime).
In terms of the time spent at less than 100 AU, our simulations reveal a wide spread of outcomes -– from those objects that spend just a few hundred years within 100 AU before being ejected from the Solar System to those few that spend well over a billion years in that region. In Fig. 10, we plot the number of clones that spend at least a certain amount of time within 100 AU of the Sun, as a function of the total time elapsed within that heliocentric distance.
We note that, although the mean amount of time spent within 100 AU is 3.3 Myr, this mean is heavily biased by a relatively small population of objects that are trapped onto relatively long lived orbits within 100 AU, which contribute vastly to the total time spent within that distance. Indeed, the median amount of time that clones spent within 100 AU of the Sun was just 18.8 kyr, with 975 of them spending under a thousand years within that distance, and almost 21,000 of the test particles spending under five thousand years within 100 AU.
5 Discussion
As 2012 DR30 spent a relatively short time at small heliocentric distances ( 100 AU) it is interesting to consider whether the surface could have some memories of the long years spent at the far-out reaches of the Solar System. Volatiles kept on the surface might be one possibility.
As we mentioned it in Sect. 3.4, the 890 nm methane absorption band is at the right position to explain the strong Z-band absorption of 2012 DR30. However, this possibility is ruled out by the relatively low albedo of the object. In addition to this, for an object with the size of 2012 DR30 the methane volatility limit is at a 100 AU distance from the Sun (Brown, 2011). Although 2012 DR30 spends the vast majority of its lifetime beyond this heliocentric distance, in those short periods when it is close to its perihelion (closer than 100 AU) the volatile escape rate of methane is so large that 2012 DR30 certainly cannot retain this molecule on the surface even for a few thousand years, considering either Jeans or hydrodynamic escape rates (Schaller & Brown, 2007; Levi & Podolak, 2011). Replenishment of methane from subsurface resources is indeed a possibility, however, no cometary activity has been observed so far which otherwise would support this scenario. When mixed with or diluted in other ices (e.g. H2O), the escape rate of methane could be significantly different. But even the clathrate hydrate of methane has a stability limit of 53 K at p 1 nbar, and hence it cannot survive at the current distance of 2012 DR30, about 15 AU (Gautier & Hersant, 2005). In addition, dilution of methane in other ices would decrease the depth of the absorption features.
Another reason to rule out methane on the surface could be that if 2012 DR30 was originated from the Oort cloud and not from the trans-Neptunian region, then cosmic ray impacts on the surfaces so far away from the solar magnetosphere protection would be destructive for CH bonds and hence methane could not survive.
The very likely lack of methane on the surface favors a scenario in which the Z-band absorption is due to e.g. olivine or pyroxene, like in V-type asteroids – if the object were really V-type, this would certainly suggest a main belt origin. V-type asteroids are usually believed to be originated as impact ejecta from Vesta itself (Binzel & Xu, 1993), but due to its large size, it is very unlikely that 2012 DR30 could be one of them (as indicated by its size, 2012 DR30 might be a differentiated object itself). Probably the same is true for the relation of 2012 DR30 to the very rare A-type asteroids that show similar reflectance spectra with strong olivine absorption, and are supposed to come from a completely differentiated mantle of an asteroid (DeMeo et al., 2009). Note that space weathering may also be an important factor in shaping the observable spectra and colours of these bodies (Lucas et al., 2012).
6 Conclusions
In this paper we determined the basic physical parameters (size, albedo) of 2012 DR30, determined its visible colours and also discussed the dynamics of its orbit.
Considering dynamical evolution, it seems highly unlikely that 2012 DR30 originated within the main belt. The most likely origins are either within the inner Oort cloud (as suggested for the high-inclination Centaurs by e.g. Emel’yanenko et al., 2005 and Brasser et al., 2012) or the outer Oort cloud (following the classical cometary capture route put forth by e.g. Wiegert & Tremaine, 1999). Despite the fact that it is highly unlikely, a main belt origin seems to explain more readily our observations that indicate a space-weathered V-type asteroidal surface, as discussed in the previous section. However, it is a question whether such a surface could be the result of a long time exposure of Galactic cosmic rays in the inner Oort cloud, beyond the protection of the heliosphere. A reflectance spectrum of 2012 DR30 would be highly desirable to confirm and better characterise the Z-band absorption feature and likely rule out some of these possiblilties.
Both the ”PACS+WISE” NEATM and the thermophysical model results indicated a size of 185 km and a V-band geometric albedo of 8 per cent for 2012 DR30. With these characteristics, 2012 DR30 is definitely the largest and highest albedo Damocloid or high inclination Centaur ever observed; and it is the fifth largest even among the Centaurs, just after 2002 GZ32, Chariklo, Chiron and Bienor (Lellouch et al., 2012). This size and albedo is rather incompatible with the ”extinct Halley-type comet” picture which is often used to explain the properties of Damocloids. The mere existence of 2012 DR30 indicates that objects on Damocloid orbits may be of mixed origin and may not just be the once active nuclei of cometary bodies.
Acknowledgements.
This project was supported by the Hungarian OTKA grants K76816, K83790, K104607, the HUMAN MB08C 81013 project of the MAG Zrt., the PECS-98073 program of the European Space Agency (ESA) and the Hungarian Space Office, the Lendület 2009/2012 Young Researchers’ Programs; the Bolyai Research Fellowship of the Hungarian Academy of Sciences, and the European Community’s Seventh Framework Programme (FP7/2007- 2013) under grant agreement no. 269194. JLO aknowledges support from grant AYA2011-30106-C02-01 and FEDER funds. Part of this work was supported by the German DLR project number 50 OR 1108. We are grateful to the Herschel Science Centre (ESA/ESOC) for providing us Director’s Discretionary Time for the Herschel Space Observatory, as well as to the European Southern Observatory through the Max-Planck-Institut für Astronomie for the MPG/ESO 2.2 m telescope DDT time. We are particularly indebted to an anonymous referee for his numerous thoughtful comments and suggestions.References
- Alvarez-Candal et al. (2011) Alvarez-Candal, A., Pinilla-Alonso, N., Licandro, J., et al., 2011, A&A, 532, A130
- Benecchi et al. (2011) Benecchi, S.D., Noll, K.S., Stephens, D.C., et al., 2011, Icarus, 213, 693
- Bertin & Arnouts (1996) Bertin, E. & Arnouts, S., 1996, A&AS, 117, 393
- Binzel & Xu (1993) Binzel, R.P. & Xu, S., 1993, Science, 260, 186
- Binzel et al. (2004) Binzel, R.P., Rivkin, A.S., Stuart, J.S., 2004, Icarus, 170, 259
- Brasser et al. (2012) Brasser, R., Schwamb, M.E., Lykawka, P.S. & Gomes, R.S., 2012, MNRAS, 420, 3396
- Brown (2005) Brown, M.E., 2005, IAU Circ., 8610, 1
- Brown (2011) Brown, M.E., 2011, Annu. Rev. Earth Planet. Sci., 40, 467
- Brown et al. (2007) Brown, M.E., Barkume, K.M., Blake, G.A., et al., 2007, AJ, 133, 284
- Chambers (1999) Chambers, J. E., 1999, MNRAS, 304, 793
- Chapman et al. (1993) Chapman, C.R., Gaffey, M., & McFadden, L., 24-color Asteroid Survey. EAR-A-DBP-3-RDR-24COLOR-V2.1. NASA Planetary Data System, 1993.
- Cutri et al. (2012) Cutri, R.M., Wright, E.L., Conrow, T., et al., 2012, ”Explanatory Supplement to the WISE All-Sky Data Release Products”, version July 30, 2012
- DeMeo et al. (2009) DeMeo, F.E., Binzel, R.P., Slivan, S.M. & Bus, S.J., 2009, Icarus, 202, 160
- Dones et al. (2004) Dones, L., Weissman, P.R., Levison, H.F., & Duncan, M.J., 2004, Comets II, 153
- Emel’yanenko et al. (2005) Emel’yanenko, V.V., Asher, D.J. & Bailey, M.E., 2005, MNRAS, 361, 1345
- Gaffey et al. (1993) Gaffey, M. J. et al., 1993, Icarus, 106, 573
- Gautier & Hersant (2005) Gautier, D. & Herssant, F., 2005, Space Science Reviews, 116, 25
- Gladman et al. (2008) Gladman, B., Marsden, B.G., VanLaerhoven, C., 2008, in The Solar System Beyond Neptune, Nomenclature in the Outer Solar System, (Tuscon, AZ: Univ. Arizona Press), p.43
- Hainaut et al. (2012) Hainaut, O.R., Böhnhardt, H. & Protopapa, S., 2012, A&A, 546, A115
- Hiroi & Sasaki (2012) Hiroi, T. & Sasaki, S., 2012, ”Asteroidal Space Weathering: Compositional Dependency and Influence on Taxonomy”, Asteroids, Comets, Meteors 2012, LPI Contribution No. 1667, id.6109
- Horner et al. (2004a) Horner, J., Evans, N.W. & Bailey, M. E., 2004a, MNRAS, 354, 798
- Horner et al. (2004b) Horner, J., Evans, N.W., & Bailey, M.E., 2004b, MNRAS, 355, 321
- Horner & Lykawka (2010) Horner, J. & Lykawka, P.S., 2010b, MNRAS, 405, 49
- Horner et al. (2012a) Horner, J., Lykawka, P.S., Bannister, M. T. & Francis, P., 2012a, MNRAS, 422, 2145
- Horner et al. (2012b) Horner, J., Müller, T.G. & Lykawka, P. S., 2012b, MNRAS, 423, 2587
- Irwin & Lewis (2001) Irwin M., Lewis, J., 2001, NewAR, 45, 105
- Jewitt (2005) Jewitt, D., 2005, AJ, 129, 530
- Landolt (1992) Landolt, A. U. 1992. UBVRI photometric standard stars in the magnitude range 11.5-16.0 around the celestial equator. The Astronomical Journal 104, 340-371.
- Lellouch et al. (2012) Lellouch, E., Santos-Sanz, P., Mommert, M., et al., 2012, ”Thermal Properties Of Trans-neptunian Objects And Centaurs From Combined Herschel And Spitzer Observations”, DPS #44, #402.04
- Levi & Podolak (2011) Levi, A. & Podolak, M., 2011, Icarus, 214, 308
- Lim et al. (2010) Lim, T.L., Stansberry, J., Müller, T.G., et al., 2010, A&A, 518, L148
- Lucas et al. (2012) Lucas, M.P., Emery, J.P. & Takir, D., 2012, ”Dunites in the sky? VNIR spectra of six suspected A-class asteroids”, DPS meeting #44, #110.11
- Mainzer et al. (2011) Mainzer, A., Bauer, J., Grav, T. et al. 2011, ApJ, 731, 53
- Mommert et al. (2012) Mommert, M., Harris, A.W., Kiss, Cs., et al., 2012, A&A 541, A93
- Müller & Lagerros (1998) Müller, T. G. & Lagerros, J. S. V. 1998, A&A, 338, 340
- Müller & Lagerros (2002) Müller, T. G. & Lagerros, J. S. V. 2002, A&A, 381, 324
- Müller et al. (2009) Müller, T.G., Lellouch, E., Böhnhardt, H., et al., 2009, EM&P, 105, 209
- Müller et al. (2010) Müller, T.G., Lellouch, E., Stansberry, J., et al., 2010, A&A, 518, L146
- Müller et al. (2011) Müller, T.G, Okumura, K., Klaas, U., ”PACS Photometer Passbands and Colour Correction Factors for Various Source SEDs”, PICC-ME-TN-038, April 12, 2011, Version 1.0
- Ott (2010) Ott, S., 2010, in Astronomical Data Analysis Software and Systems XIX., eds. Y. Mizumoto, K.-I. Morita, & M. Ohishi, ASP Conf. Ser., 434, 139
- Pál et al. (2012) Pál., A., Kiss, Cs., Müller, Th.G., et al., 2012, A&A, 541, L6
- Perna et al. (2010) Perna, D., Barucci, M.A., Fornasier, S., et al., 2010, A&A, 510, A53
- Pilbratt et al. (2010) Pilbratt, G. L., Riedinger, J. R., Passvogel, T., et al., 2010, A&A, 518, L1
- Ramírez et al. (2012) Ramírez, I., Michel, R., Sefako, R., et al., 2012, ApJ 752, 5
- Rodgers et al. (2006) Rodgers, C. T., Canterna, R., Smith, J. A., Pierce, M. J., & Tucker, D. L. 2006, AJ, 132, 989
- Romanishin & Tegler (2005) Romanishin, W., Tegler, S.C., 2005, Icarus, 179, 523
- Poglitsch et al. (2010) Poglitsch, A., Waelkens, C., Geis, N., et al., 2010, A&A, 518, L2
- Rickman et al. (2008) Rickman, H., Fouchard, M., Froeschlé, C., & Valsecchi, G.B., 2008, Celestial Mechanics and Dynamical Astronomy, 102, 111
- Santos-Sanz et al. (2012) Santos-Sanz, P., Lellouch, E., Fornasier, S., et al., A&A, 541, A92
- Schaller & Brown (2007) Schaller, E. & Brown, M.E., 2007, ApJ, 659, L61
- Skrutskie et al. (2006) Skrutskie, M. F., Cutri, R. M., Stiening, R., et al., 2006, AJ, 131, 1163
- Stansberry et al. (2008) Stansberry, J., Grundy, W.M., Brown, M.E., et al., 2008, in The Solar System Beyond Neptune, Physical Properties of Kuiper Belt and Centaur Objects: Constraints from the Spitzer Space Telescope, p.161 (Tuscon, AZ: Univ. Arizona Press), p. 161
- Vilenius et al. (2012) Vilenius, E., Kiss, Cs., Mommert, M., et al., 2012, A&A, 541, A94
- Wiegert & Tremaine (1999) Wiegert, P., & Tremaine, S. 1999, Icarus, 137, 84
- Wright et al. (2010) Wright, E. L., Eisenhardt, P. R. M., Mainzer, A. K. et al. 2010, AJ, 140, 1868
Appendix A Astrometry and photometry data of the visual range measurements
| UT of start of observation | Horizons R.A. | Horizons DEC | observed R.A. | observed DEC | offset |
|---|---|---|---|---|---|
| (hh:mm:ss) | (dd:mm:ss) | (hh:mm:ss) | (hh:mm:ss) | (dd:mm:ss) | |
| 2012-05-28 08:28:06.355 | 10:16:46.65 | -17:05:44.3 | 10:16:46.47 | -17:05:56.5 | 0:00:12.5 |
| 2012-05-28 08:33:26.626 | 10:16:46.65 | -17:05:44.2 | 10:16:46.47 | -17:05:56.4 | 0:00:12.5 |
| 2012-05-28 08:38:47.220 | 10:16:46.65 | -17:05:44.2 | 10:16:46.47 | -17:05:56.4 | 0:00:12.4 |
| 2012-05-28 08:44:08.066 | 10:16:46.65 | -17:05:44.1 | 10:16:46.47 | -17:05:56.3 | 0:00:12.5 |
| 2012-05-28 11:56:14.191 | 10:16:46.65 | -17:05:41.7 | 10:16:46.43 | -17:05:53.8 | 0:00:12.5 |
| 2012-05-28 12:01:34.738 | 10:16:46.65 | -17:05:41.6 | 10:16:46.44 | -17:05:53.6 | 0:00:12.4 |
| 2012-05-28 12:06:55.562 | 10:16:46.65 | -17:05:41.5 | 10:16:46.44 | -17:05:53.5 | 0:00:12.3 |
| 2012-05-28 12:12:16.716 | 10:16:46.65 | -17:05:41.5 | 10:16:46.43 | -17:05:53.5 | 0:00:12.4 |
| 2012-05-28 12:17:37.018 | 10:16:46.65 | -17:05:41.4 | 10:16:46.44 | -17:05:53.3 | 0:00:12.3 |
| 2012-05-28 12:22:57.712 | 10:16:46.65 | -17:05:41.3 | 10:16:46.44 | -17:05:53.1 | 0:00:12.2 |
| 2012-05-30 09:06:03.224 | 10:16:47.13 | -17:05:10.4 | 10:16:46.93 | -17:05:22.6 | 0:00:12.5 |
| 2012-05-30 09:11:23.703 | 10:16:47.13 | -17:05:10.3 | 10:16:46.94 | -17:05:22.5 | 0:00:12.5 |
| 2012-05-30 09:16:44.081 | 10:16:47.13 | -17:05:10.3 | 10:16:46.94 | -17:05:22.5 | 0:00:12.5 |
| 2012-05-30 09:22:04.962 | 10:16:47.13 | -17:05:10.2 | 10:16:46.94 | -17:05:22.4 | 0:00:12.5 |
| 2012-05-30 09:27:25.380 | 10:16:47.13 | -17:05:10.1 | 10:16:46.94 | -17:05:22.3 | 0:00:12.5 |
| 2012-05-30 09:32:45.671 | 10:16:47.13 | -17:05:10.1 | 10:16:46.94 | -17:05:22.3 | 0:00:12.5 |
| 2012-05-30 09:38:06.124 | 10:16:47.14 | -17:05:10.0 | 10:16:46.94 | -17:05:22.2 | 0:00:12.5 |
| 2012-05-30 09:43:29.790 | 10:16:47.14 | -17:05:10.0 | 10:16:46.94 | -17:05:22.2 | 0:00:12.5 |
| 2012-05-30 09:48:51.063 | 10:16:47.14 | -17:05:09.9 | 10:16:46.95 | -17:05:22.2 | 0:00:12.6 |
| 2012-05-31 08:54:21.306 | 10:16:47.75 | -17:04:56.1 | 10:16:47.56 | -17:05:08.2 | 0:00:12.4 |
| 2012-05-31 09:10:25.284 | 10:16:47.76 | -17:04:55.9 | 10:16:47.56 | -17:05:08.0 | 0:00:12.5 |
| 2012-05-31 09:15:45.913 | 10:16:47.76 | -17:04:55.9 | 10:16:47.56 | -17:05:08.0 | 0:00:12.4 |
| 2012-05-31 09:37:09.023 | 10:16:47.77 | -17:04:55.7 | 10:16:47.57 | -17:05:07.8 | 0:00:12.5 |
| 2012-05-31 09:42:30.113 | 10:16:47.77 | -17:04:55.6 | 10:16:47.57 | -17:05:07.9 | 0:00:12.6 |
| 2012-05-31 09:47:50.256 | 10:16:47.78 | -17:04:55.6 | 10:16:47.58 | -17:05:07.7 | 0:00:12.5 |
| 2012-05-31 09:53:11.190 | 10:16:47.78 | -17:04:55.5 | 10:16:47.58 | -17:05:07.7 | 0:00:12.5 |
| 2012-05-31 10:14:33.638 | 10:16:47.79 | -17:04:55.3 | 10:16:47.60 | -17:05:07.5 | 0:00:12.5 |
| 2012-05-31 10:19:54.273 | 10:16:47.79 | -17:04:55.3 | 10:16:47.59 | -17:05:07.4 | 0:00:12.5 |
| 2012-05-31 10:25:15.577 | 10:16:47.80 | -17:04:55.2 | 10:16:47.59 | -17:05:07.3 | 0:00:12.5 |
| 2012-05-31 10:30:35.888 | 10:16:47.80 | -17:04:55.2 | 10:16:47.60 | -17:05:07.2 | 0:00:12.4 |
| 2012-05-31 10:35:56.461 | 10:16:47.80 | -17:04:55.1 | 10:16:47.59 | -17:05:07.3 | 0:00:12.6 |
| 2012-05-31 10:41:17.404 | 10:16:47.80 | -17:04:55.1 | 10:16:47.60 | -17:05:07.1 | 0:00:12.4 |
| 2012-05-31 10:46:38.478 | 10:16:47.81 | -17:04:55.0 | 10:16:47.60 | -17:05:07.2 | 0:00:12.5 |
| 2012-06-14 10:17:19.847 | 10:17:23.22 | -17:04:27.9 | 10:17:23.03 | -17:04:39.7 | 0:00:12.1 |
| Star id | flux | APASS | RA (hh:mm:sd) | Dec (dd:mm:ss) |
|---|---|---|---|---|
| 41 | 10:16:38.30 | -17:10:04.0 | ||
| 61 | 16.214 | 10:16:56.87 | -17:09:14.7 | |
| 79 | 10:16:57.61 | -17:08:23.0 | ||
| 82 | 10:16:33.54 | -17:08:20.4 | ||
| 148 | 10:16:37.92 | -17:03:09.4 | ||
| 175 | 10:16:52.14 | -17:04:19.7 | ||
| 210 | 10:16:31.96 | -17:03:57.4 | ||
| 216 | 10:16:39.52 | -17:04:55.7 | ||
| 252 | 10:16:59.19 | -17:05:36.1 | ||
| 260 | 10:16:33.02 | -17:06:06.9 | ||
| 273 | 10:16:33.29 | -17:06:25.8 |
Appendix B Input fluxes for thermal modelling
We calculate the colour corrected flux from the measured flux using the Cλ colour correction factors and the rcorr,λ flux correction factors. The colour correction factors of the Herschel data are calculated using the actual spectral energy distribution of the target according to Müller et al. (2011), while in the case of WISE data the correction factors are taken from Cutri et al. (2012). Then the corrected flux is:
| (1) |
and the uncertainty of the corrected flux is:
| (2) |
where Cλ is the uncertainty of the colour correction factor. The final ”input flux”, used for the modeling of the thermal emission is the colour corrected flux, Fλ,i = Fλ,cc. However, the uncertainties of the absolute calibration have to be considered in the final ”input” uncertainties:
| (3) |
where rcal,λ is the calibration uncertainty factor that is given as a certain fraction of the measured point source flux for all bands of the WISE and Herschel/PACS instruments. The actual values of all the factors mentioned above are summarized in Table 3, also listing the final input fluxes used the thermal emission modeling.