Photometric studies of open star clusters Haffner 11 and Czernik 31.
Abstract
We present the broad band CCD photometric investigations in the region of the two open clusters Haffner 11 and Czernik 31. The radii of the clusters are determined as 3′.5 and 3′.0 for Haffner 11 and Czernik 31 respectively. Using two colour versus diagram we determine the reddening 0.05 mag and 0.480.05 mag for the cluster Haffner 11 and Czernik 31 respectively. Using 2MASS and optical data, we determined 0.06 mag and 0.06 for Haffner 11 and 0.08 mag and 0.08 mag for Czernik 31. Our analysis indicate normal interstellar extinction law in the direction of both the clusters. Distance of the clusters is determined as 5.80.5 Kpc for Haffner 11 and 3.20.3 Kpc for Czernik 31 by comparing the ZAMS with the CM diagram of the clusters. The age of the cluster has been estimated as 800100 Myr for Haffner 11 and 16040 Myr for Czernik 31 using the stellar isochrones of metallicity .
keywords:
Star: evolution -stars: Hertzsprung-Russell and colour-magnitude diagrams open clusters and associations: individual: Haffner 11 and Czernik 311 Introduction
Open clusters (OCLs) are located in the Galactic disc. It is important to determine their properties and spatial distribution to understand the structure and evolution of Milky Way. Therefore, investigation of the OCLs and, in particular, the estimation of their physical parameters like age, distance, reddening, size and metallicity are very valuable.
Considering the above we decided to study two open star clusters namely Haffner 11 (Ha 11) and Czernik 31 (Cz 31). Ha 11 was first discovered by Haffner (1957). Further, van den Bergh et al. (1975) studied this cluster photographically and derived a diameter of 5′ and richness of type M(moderate). Cz 31 was discovered by Czernik (1966) using the charts of Palomar sky atlas. This cluster is classified as a Trumpler class IV2p by Ruprecht (1966).
The main purpose of the present investigation is to estimate the fundamental parameters of the clusters Ha 11 and Cz 31 using CCD data. In the literature, both the clusters are poorly studied. The basic parameters taken from WEBDA and Dias et al. (2002) are listed in Table 1. Both the clusters are located in the third Galactic quadrant and towards the Galactic anticenter direction. These objects are very useful to understand the disc subsystem to which the cluster belongs. Table 1 shows that the clusters are of intermediate and young age objects which can be used to probe the chemical evolution and star formation history of the disc.
In the present study, we provide CCD photometry for Ha 11 and Cz 31 and determine their basic parameters using optical and near-IR 2MASS data. CCD optical data used in the present analysis is obtained for the first time for Cz 31.
2 Observations and data reduction
The CCD broad band images were collected using 2K2K CCD system at the Cassegrain focus of the Sumpurnanand 104-cm telescope located at ARIES, Manora peak, Nainital, India. The used CCD has 24 m square pixel size, resulting in a scale of 0′′.36 pixel-1 and a square field of view of 12′.6 size. The CCD gain was 10 e-/ADU while the read out noise was 5.3 e-. In order to improve the S/N ratio, the observations were taken in 22 pixel binning mode. The observations include several exposures in each filters. The details of observations are listed in Table 2. Dates of observations together with the filters used and the corresponding exposure time are provided in Table 2. Identification maps of the observed regions of the clusters are shown in Fig 1.
A number of bias and flat-field frames were taken during the observations. Flat-field exposures were made of the twilight sky in each filter. Corrections for bias and flat-field were performed using the standard IRAF222 IRAF is distributed by the National Optical Astronomical Observatory which are operated by the Association of Universities for Research in Astronomy, under contract with the National Science Foundation procedure. The subsequent data reduction and analysis were done using the DAOPHOT software (Stetson (1987), (1992)). The stellar photometric routine of DAOPHOT was used for the magnitude determination. These magnitudes were calibrated using Landolt (1992) standards. The details of data reductions are described in the previous papers (Pandey et al. (1997); Durgapal et al. (1997, 2001)). The instrumental magnitudes were obtained through quadratically varying Point Spread Function (PSF). For each filter, the stars have been aligned to that of a reference frame, the deepest one. The average instrumental magnitude was derived in each filter.
We observed the standard field PG 0942051 and SA 98 (Landolt 1992) in and for calibrating the observations of Ha 11 and Cz 31. The standard stars used in the calibrations have brightness and colours range 11.93 15.67 and respectively, thus covering the bulk of the cluster stars. For the extinction coefficients we assumed the typical values for the ARIES site.
For translating the instrumental magnitude to the standard magnitude, the calibration equations are as follows:
where and are the aperture instrumental magnitudes and and are the standard magnitudes and is the airmass. The color coefficients () and zeropoints () for different filters are listed in Table 3. The errors in zero points and colour coefficients are 0.01 mag for and filters. The internal errors in magnitude derived from DAOPHOT are plotted against magnitude in Fig. 2. This figure shows that photometric error is 0.01 mag at mag for and filters while error is 0.05 mag for filter at mag. Photometric global (DAOPHOT+Calibration) errors have also been determined by following Patat et al. (2001) and are listed in Table 4. For the filter, the errors are 0.05 and 0.06 at 17.0 and 20.0 mag, respectively. The final photometric data are available in electronic form at the WEBDA site 333http://obswww.unige.ch/webda/ and also from the authors.
The X and Y coordinates of the stars in the observed region of the clusters have been converted to right ascension (RA) and declination (DEC) of J2000. In order to obtain an astrometric solution we use the SkyCat tool and Guide Star Catalogue v2 (GSC-2) at the European Southern Observatory. This way we considered 100 bright stars per field for which we have both celestial coordinates on the GSC-2 and the corresponding pixel coordinates. By using CCMAP and CCTRAN in IRAF, we estimated the transformation and compute the individual celestial coordinates for all the detected stars. The transformation have an rms value of about 0.10 arcsec for RA and DEC.
3 Analysis of the data
3.1 Cluster radius and radial stellar surface density
To determine the radius of the cluster, we derive the surface stellar density by performing star counts in concentric rings around the cluster centre listed in Table 1, and then divided by their respective areas. In Fig. 3 we show the density profile for the cluster Ha 11 and Cz 31. The radial density profile of the cluster Ha 11 shows a flattening around 3.5 arcmin and started merging with background stellar density. Therefore, we consider 3.5 arcmin as the cluster radius. Our estimate of radius is more than the value listed in Table 1. The radial density profile for Cz 31 is decreasing smoothly and 3.0 arcmin, it is mixing with field stars density. We consider 3.0 arcmin radius for Cz 31 which is larger than the value listed in Table 1.
3.2 Colour-magnitude diagrams
The CMDs of the cluster and field region is shown in Fig. 4
for the cluster Ha 11 and Cz 31. Stars falling within the cluster
radius are considered as cluster region stars while those outside the
radius are assumed as field region stars. To get the clear features in the
CMD, we consider the stars as cluster member within cluster radius. Field
region CMDs shown in Fig. 4 are clearly dominated by foreground/background
stars.
Haffner 11: The CMD of this cluster show a main-sequence (MS) extending from mag, where the turn-off is located, down to mag. After mag, field stars are clearly dominating and MS is merging in the field stars. Few red giant stars are also visible around and mag in the CMD. The morphology of the CMD indicate that it is a typical intermediate age open cluster.
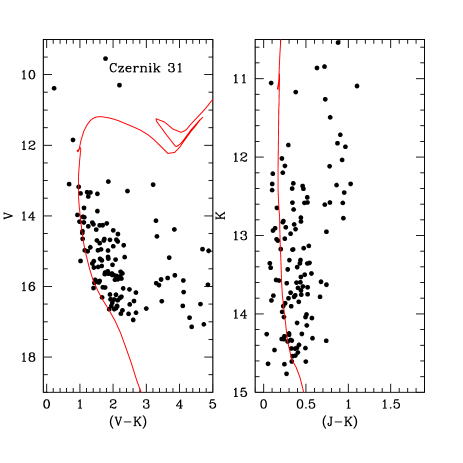
Czernik 31: A close inspection of the CMD exhibits a poorly populated MS extending from mag down to mag. The MS fainter than mag has more scatter and field star contamination is also more evident. Because of that it is hard to separate the cluster members from field stars only on the basis of closeness to the main populated area of the CMD. The CMD of this cluster looks like a poorly populated young open star cluster.
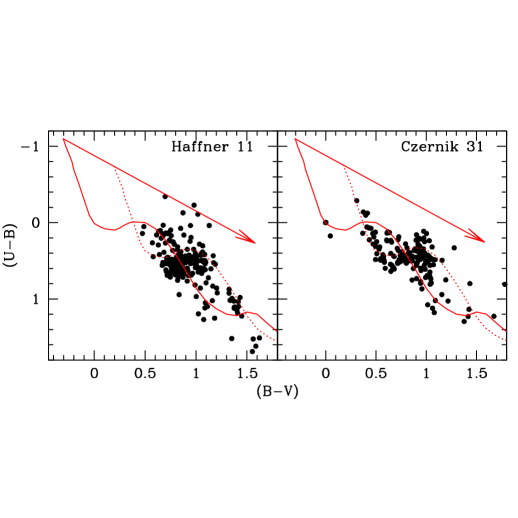
3.3 Colour-colour diagram
To determine the reddening of the clusters we plot versus colour-colour diagrams in Fig 5 using probable members of the cluster. The intrinsic zero-age main-sequence (ZAMS) given by Schmidt-Kaler (1982) is shown by the solid line, whereas the dashed line is the same ZAMS which is shifted by assuming the slope of reddening as 0.72. The ZAMS shifted to the MS stars provides a mean value of mag for Ha 11 and for Cz 31. Our derived values of reddening is in agreement with the value listed in Table 1 for Ha 11. Bica et al. (2005) estimated the reddening for Cz 31 using 2MASS photometry. Our derived value of reddening is much higher than Bica et al. (2005).
3.4 Interstellar extinction in near-IR
The near-IR data is available for both the clusters in 2MASS catalogue444http://vizier.u-strasbg.fr/viz-bin/VizieR?-source=II%2F246. The data in combination with optical data has been used to study the interstellar extinction. The magnitudes are converted into magnitude following Persson et al. (1998). The versus diagram for the clusters under study is shown in Fig. 6. The ZAMS shown by the solid line is taken from Caldwell et al. (1993). The same ZAMS is shifted by mag and mag for Ha 11 and mag and mag for Cz 31 and shown by dotted line. The ratios for both Ha 11 and Cz 31 is in good agreement with the normal interstellar extinction value of 0.19 suggested by Cardelli et al. (1989). However, scattering is larger due to error in data.
Using the relation 1.1/ given by Whittet et al. (1980) we studied about the nature of interstellar extinction law in the direction of both the clusters. The values of derived in this way are 3.0 for both the cluster Ha 11 and Cz 31. Based on this analysis, we can conclude that interstellar extinction law is normal in the direction of both the clusters.
3.5 Age and distance to the clusters
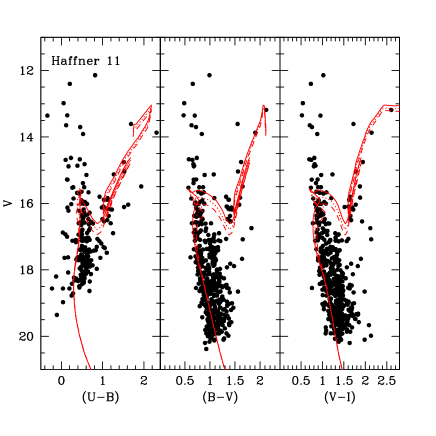
The age of a cluster is determine by comparing the theoretical stellar evolutionary isochrones given by Girardi et al. (2000) for with the observed CMDs of the clusters shown in Fig. 7. The detailed shape and position of the different features in the CMD depend mostly on age and metallicity and also on reddening and distance.
We surveyed different age and metallicity isochrones to get the best fit isochrones to all the CMD features in and diagrams. To get the clear features in the CMDs, we consider only those stars which lie within the cluster radius as derived in Section 3.1. The uncertainties in age and distance reflect the range that allows a reasonable fit to the cluster CMD.
Haffner 11: In Fig. 7, we show the fitting of isochrones to and CMDs using the reddening derived in Section 3.3. We plotted only those stars which lie within the cluster radius derived in Section 3.1. The isochrones of different age (log(age)=8.85, 8.90 and 8.95) and have been superimposed on the CMDs. The overall fit is good for log(age)=8.90 (middle isochrone). The detailed shape of the MS, TO and giant phase are reproduced. The best fitting isochrone provides an age of Myr. The inferred distance modulus mag provide a heliocentric distance kpc. The Galactocentric distance is 12.3 kpc, which is determined by assuming 8.5 kpc as the distance of the Sun to the Galactic center. The distance determined in the present study is in agreement with the value listed in Table 1. The Galactocentric coordinates are kpc, kpc and kpc. Using 2MASS photometry, Bica et al. (2005) derived a heliocentric distance 5.20.2 kpc and age 890150 Myr, which are in agreement with the present estimate of distance and age.
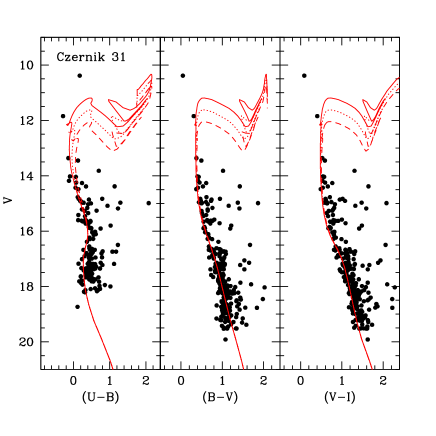
Czernik 31: In Fig. 7, we superimpose isochrones with and for 3 ages (log(age)=8.10, 8.20 and 8.30) in and CMDs. The best fit isochrone is found for an age of Myr, where the associated error has been derived by trying different age isochrones. On average, we obtained distance modulus mag. The errors have been derived by displacing the best fit isochrone back and forth in the distance modulus direction and exploring the acceptable value of distance modulus. The estimated distance modulus provides a heliocentric distance kpc. The Galactocentric coordinates are kpc, kpc and kpc. The Galactocentric distance of the cluster is kpc towards the anti-center direction.
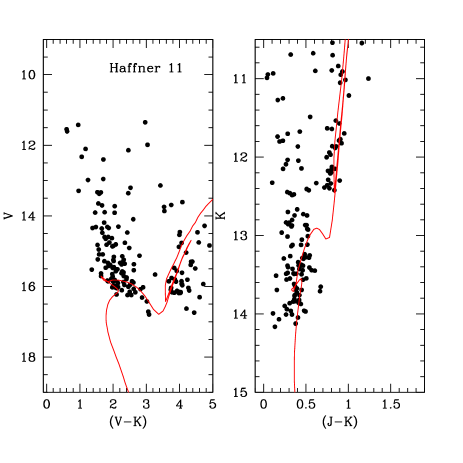
3.6 Near-IR colour-magnitude diagrams
Using optical and near-IR data we redetermined distance and age of the clusters under study. We plot and CMDs for Ha 11 and Cz 31 in Fig. 8. The theoretical isochrone given by Girardi et al. (2000) for have been overplotted for log(age)=8.9 and 8.1 in the CMDs of Ha 11 and Cz 31 respectively. The apparent distance moduli and turn out to be and for Ha 11 and and for Cz 31. Using the reddening derived in Section 3.4, we derive a distance of and kpc for Ha 11 and Cz 31 respectively. Both, age and distance determination for the present clusters is in agreement with the estimates presented in Section 3.5.
4 Conclusions
We studied two open star clusters Haffner 11 and Czernik 31 using CCD optical and 2MASS data. The results are summarized in Table 5. The main findings of our analysis are given below.
-
1.
The radii of the clusters are obtained as 3′.5 and 3′.0 which corresponds to 5.9 pc and 2.8 pc, respectively, at a distance of the cluster for Ha 11 and Cz 31.
-
2.
From the two colour versus diagram, we estimated mag for Ha 11 and mag for Cz 31.
-
3.
Distance to the cluster Ha 11 and Cz 31 are determined as 5.80.5 and 3.20.3 Kpc respectively. Age of 800100 Myr and 16040 Myr are determined for the clusters Ha 11 and Cz 31 respectively by comparing the isochrones of given by Girardi et al. (2000). These distances and ages are supported by the values derived by combining optical and near-IR data.
5 ACKNOWLEDGEMENTS
D. Bisht and A. K. Durgapal would like to acknowledge the great support from ARIES during the observations and Data reduction. This publication made use of data from the 2MASS, which is a joint project of the university of Massachusetts and the Infrared Processing and Analysis Center/California Institute of Technology, funded by the National Science Foundation. We are also much obliged for the use of the NASA Astrophysics Data System, of the SIMBAD data base and of the WEBDA open cluster data base.
References
- [1] Bica, E. & Bonatto, C., 2005, A&A, 443, 465
- [2] Bonatto C. & Bica E. 2005, A&A, 455, 931
- [3] Caldwell J. A. R., Cousins A. W. J., Ahlers C. C., van Wamelen P., Maritz E. J., 1993, South African Astron. Observatory, Circ. No. 15
- [4] Cardelli J. A., Clayton G. C., Mathis J. S., 1989, ApJ, 345, 245
- [5] Czernik, M., 1966, AcA, 16, 92
- [6] Dias W.S., Alessi B.S., Moitinho A., Lepine J.R.D., 2002, A&A, 389, 871
- [7] Durgapal A. K., Pandey A. K., Mohan V., 1997, BASI, 25, 489
- [8] Durgapal A. K., Pandey A. K., 2001, A&A, 375, 840
- [9] Girardi L., Bressan A., Bertlli G., Chiosi C., 2000, A&AS, 141, 371
- [10] Haffner, H., 1957, ZA, 43, 89
- [11] Landolt A. U., 1992, AJ, 104, 340
- [12] Lynga G., 1982, A&A, 109, 213
- [13] Pandey A. K., Durgapal A. K., Bhatt B. C., Mohan V., Mahra H. S., 1997, A&AS, 122, 111
- [14] Patat, F., Carraro, G., 2001, MNRAS, 325, 1591
- [15] Persson S. E., Murphy D. C., Krzeminski W., Roth M., Rieke M. J., 1998, AJ, 116, 2475
- [16] Ruprecht, J., 1966, BAC, 17, 33
- [17] Schmid - Kaler Th., 1982, in Scaitersk., Voigt H. H., eds, Landolt / Bornstein, Numerical Data and Functional Relationship in Science and Technology, New series, Group VI, vol. 2b. springer - verlag, Berlin, p. 14
- [18] Stetson P. B., 1987, PASP, 99, 191
- [19] Stetson P. B., 1992, in Warrall D. M., Biemesderfer, C., Barnes J., eds, ASP Conf. Ser. Vol. 25, Astronomical Data Analysis Software and System I. Astron. Soc. Pac., San Francisco, p. 297
- [20] van den Bergh, Sidney & Hagen, G. L., 1975, AJ, 80, 11
- [21] Whittet D. C. B., Van Breda I. G., 1980, MNRAS, 192, 467
- [22]


| Name | Dia | log(age) | ||||||
|---|---|---|---|---|---|---|---|---|
| h:m:s | d:m:s | (deg) | (deg) | () | (mag) | (pc) | ||
| Haffner 11 | 07:36:25 | 27:43:00 | 242.4 | 3.5 | 5 | 0.57 | 6100 | 8.70 |
| Czernik 31 | 07:36:59 | 20:32:00 | 236.3 | 0.3 | 5 | 0.06 | 2200 | 8.25 |
| Band | Exposure Time | Date |
| (in seconds) | ||
| Haffner 11 | ||
| 15002, 3002 | 6th Feb 2010 | |
| 12002, 2401 | ,, | |
| 9002, 1802 | ,, | |
| 3002, 601 | ,, | |
| Czernik 31 | ||
| 12001, 2402 | 5th March 2010 | |
| 9001, 1802 | ,, | |
| 6001, 1202 | ,, | |
| 3002, 1201 | ,, |
| Filter | Colour Coeff. | Zeropoint |
|---|---|---|
| Haffner 11 | ||
| 0.09 | 0.05 | |
| 0.01 | 0.01 | |
| 0.01 | 0.01 | |
| 0.01 | 0.01 | |
| Czernik 31 | ||
| 0.02 | 0.01 | |
| 0.01 | 0.01 | |
| 0.01 | 0.01 | |
| 0.01 | 0.01 |
| Name | Radius | Distance | X | Y | Z | Age | ||
|---|---|---|---|---|---|---|---|---|
| (arcmin) | (mag) | (kpc) | (kpc) | (kpc) | (kpc) | (kpc) | (Myr) | |
| Haffner 11 | 3.5 | -5.1 | 2.6 | -0.36 | 12.3 | |||
| Czernik 31 | 3.0 | -2.7 | 1.8 | 0.01 | 10.6 |