Do organic and other exotic superconductors fail universal scaling relations?
Abstract
Universal scaling relations are of tremendous importance in science, as they reveal fundamental laws of nature. Several such scaling relations have recently been proposed for superconductors; however, they are not really universal in the sense that some important families of superconductors appear to fail the scaling relations, or obey the scaling with different scaling pre-factors. In particular, a large group of materials called organic (or molecular) superconductors are a notable example. Here, we show that such apparent violations are largely due to the fact that the required experimental parameters were collected on different samples, with different experimental techniques. When experimental data is taken on the same sample, using a single experimental technique, organic superconductors, as well as all other studied superconductors, do in fact follow universal scaling relations.
Introduction
In spite of microscopic differences, all superconductors (SC) have one macroscopic property in common: they all conduct electricity without resistance. Therefore, it is not unreasonable to expect manifestations of universal behavior. We show here that when consistent experimental parameters are used, taken on the same sample, with a single experimental technique, all superconductors for which the data exists, indeed follow universal scaling relationsDordevic et al. (2002); Homes et al. (2004).
Results
Our scaling plots shown in Figs. 1 and 2 currently include: elemental SC (such as Nb and Pb), cuprates (both along and perpendicular to the CuO2 planes), iron-based SC (both along and perpendicular to iron-arsenic or iron-chalcogenide planes), organic SC {such as quasi-two-dimensional (BEDT-TTF)2Cu(NCS)2 and (BEDT-TTF)2Cu[N(CN)2]Br} materials, alkali-doped fullerenes (such as K3C60 and Rb3C60), heavy-fermion SC CeCoIn5, MgB2, TiN, copper-free oxide SC Ba1-xKxBiO3, negative-U induced SC in TlxPb1-xTe, Y2C2I2, etc. Further measurements on different SC families, both conventional and unconventional, will serve as the ultimate test as to whether or not these scaling relations are truly universal in nature. [We note in passing that the only superconductor that significantly and systematically deviates from the scaling relations is the p-wave superconductor Sr2RuO4. At this moment it is not clear whether this violation is real, or it is due to material and/or experimental issues. It was shownHomes et al. (2005) that superconductors in the clean limit do in fact fall to the right of the scaling line, and that might be the case with Sr2RuO4. However, we also note that the microwave surface impedance (MW SI) spectra of Sr2RuO4 were quite unusualOrmeno et al. (2006); Baker et al. (2009), and to extract the penetration depth the authors had to modify the commonly-used fitting procedure. It remains to be seen if this modification also affected the absolute values of penetration depth ().]
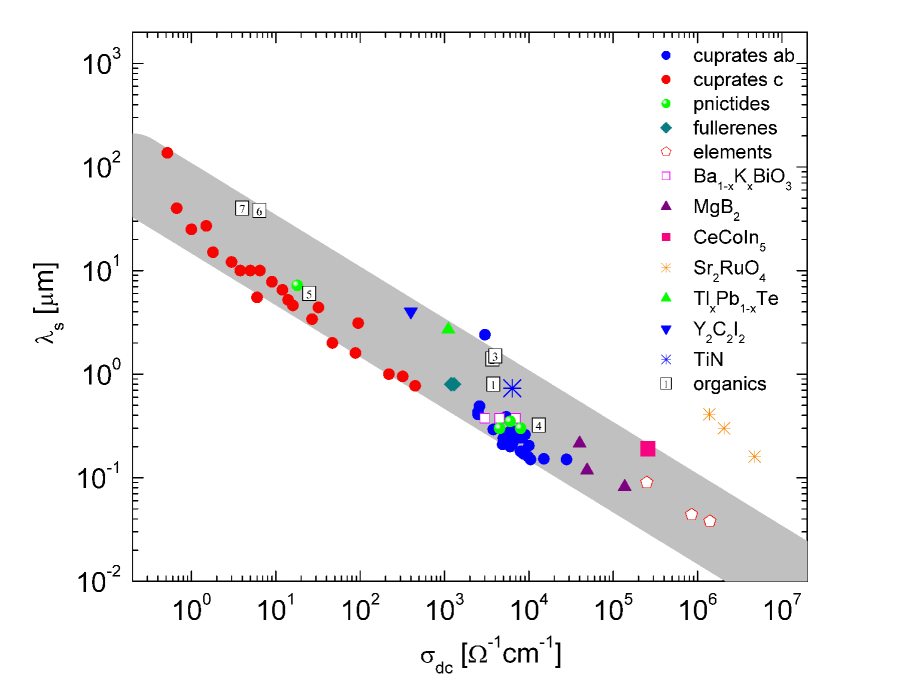
Soon after superconductivity in the cuprates was discovered, Uemura et al.Uemura et al. (1989) proposed the first scaling law that related ab-plane superfluid density (or stiffness) to superconducting critical temperature as . This scaling works for underdoped cuprates, but fails for overdoped samplesBasov and Timusk (2005). Other deviations in the cuprates were also reportedBasov and Timusk (2005). Moreover, the scaling is not followed by other families of superconductors. Basov et al.,Basov et al. (1994) on the other hand, studied interplane (c-axis) response of the cuprates and showed that the zero-temperature c-axis effective penetration depth is related to the c-axis DC conductivity just above , , as
| (1) |
This relation has been shown to be valid in a number of cuprate families.
Dordevic et al.Dordevic et al. (2002) extended this scaling relation [Eq. (1)] to other families of layered SC. What was found based on existing experimental data was that, similar to the cuprates, other layered SC followed similar scaling law, albeit with a different prefactor (Fig. 2 in Ref. Dordevic et al. (2002)). The prefactor was argued to be related to the energy scale from which the SC condensate was collected; in the cuprates the condensate was collected from an energy range two orders of magnitude broader than in other families Basov et al. (1999). Alternatively, Schneider interpreted the observed scaling as due to quantum criticality Schneider (2002).
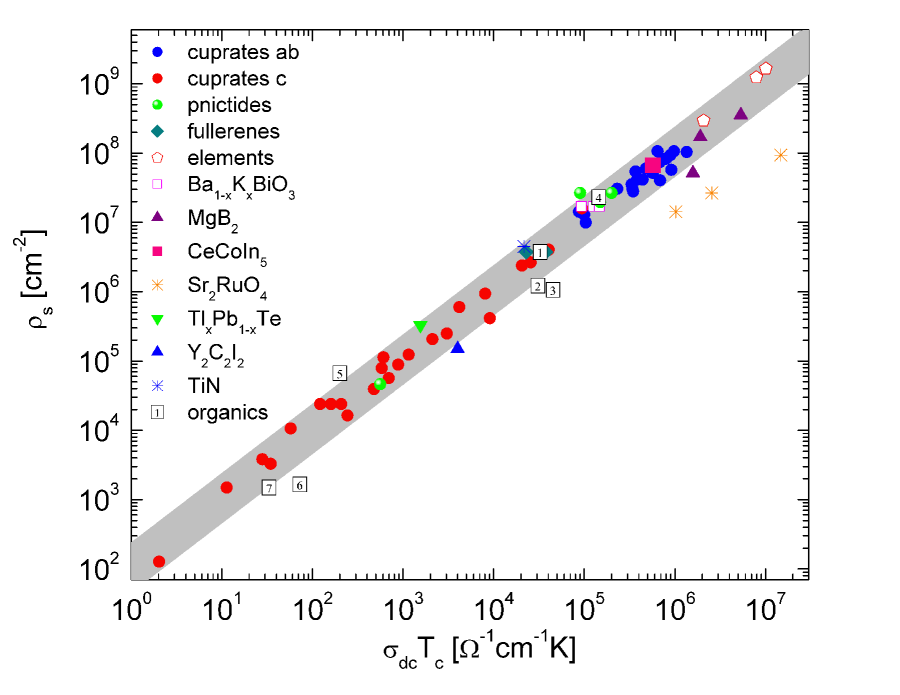
Homes et al.Homes et al. (2004) proposed a modification to the scaling given by Eq. (1), to include the SC critical temperature ,
| (2) |
where c is the speed of light. What was found was that all cuprate SC for which the data existed followed the scaling. Surprisingly, both the highly conducting copper-oxygen (ab) planes and nearly insulating out-of-plane (c axis) properties followed the same universal scaling line. Moreover, several elemental SC, such as Nb and Pb, also followed the same scaling (Fig. 2 in Ref. Homes et al. (2004)). More recently, iron-based SC were also shown to follow the same scaling Wu et al. (2010); Homes et al. (2012).
However, the so-called organic (or molecular) superconductors failed to provide a convincing data set for the scaling Eq. (2), and were not included in the original plot (Fig. 2 in Ref. Homes et al. (2004)). Several other families of superconductors, such as dichalcogenides and heavy fermions, were also not considered for the same reason. It has been argued that organic SC in their most conducting planes follow different scaling laws Powell and McKenzie (2004); Pratt and Blundell (2005), such as .
| label | organic SC | [] | [m] | [K] | technique | Reference |
| 1 | (BEDT-TTF)2Cu(NCS)2 | 3800 | 0.8 | 8.6 | MW SI (35 GHz) | Dressel et al. (1994) |
| 2 | (BEDT-TTF)2Cu(NCS)2 | 3700 | 1.4 | 8.3 | MW SI (60 GHz) | Dressel et al. (1994) |
| 3 | (BEDT-TTF)2Cu[N(CN)2]Br | 4000 | 1.5 | 11.3 | MW SI | Dressel et al. (1994) |
| 4 | (BEDT-TTF)2Cu[N(CN)2]Br | 13150 | 0.322 | 11 | MW SI | Milbradt et al. |
| 5 | (BEDT-TTF)2I3 | 25 | 6 | 8 | IR | Drichko et al. (2002) |
| 6 | (BEDT-TTF)2Cu[N(CN)2]Br | 6.4 | 38 | 11.3 | MW SI | Dressel et al. (1994) |
| 7 | (BEDT-TTF)2Cu(NCS)2 | 4 | 40 | 8.3 | MW SI | Dressel et al. (1994) |
| K3C60 | 1200 | 0.8 | 19 | IR | Degiorgi et al. (1992) | |
| Rb3C60 | 1300 | 0.8 | 29 | IR | Degiorgi et al. (1992) | |
| CeCoIn5 | 260000 | 0.19 | 2.2 | MW SI | Ormeno et al. (2002) | |
| MgB2 | 40000 | 0.215 | 39.6 | IR | Tu et al. (2001) | |
| MgB2 | 137000 | 0.082 | 39 | MW SI | Jin et al. (2003) | |
| MgB2 | 49000 | 0.118 | 39 | MW SI | Jin et al. (2003) | |
| TlxPb1-xTe | 1111 | 2.7 | 1.4 | MW SI | Baker et al. (2010) | |
| Sr2RuO4 | 4760000 | 0.16 | 1.47 | MW SI | Ormeno et al. (2006) | |
| Sr2RuO4 | 2060000 | 0.3 | 1.24 | MW SI | Baker et al. (2009) | |
| Sr2RuO4 | 1380000 | 0.41 | 0.74 | MW SI | Baker et al. (2009) | |
| Y2C2I2 | 400 | 4 | 10 | IR | Rõõm et al. (2002) | |
| TiN | 6350 | 0.73 | 3.4 | IR | Pracht et al. |
Below we show that these discrepancies stem mostly from the fact that the required experimental data for Eqs. (1) and (2), namely , and , were collected on different samples, and more importantly, using different experimental techniques. This introduced significant scatter in data points, and gave the impression that some families of SC did not follow the scaling relations. The superconducting transition temperature is extracted from either DC resistivity or magnetization measurements and its values are fairly reliable and accurate. On the other hand, the experimental values of and can be quite problematic. The values of DC conductivity at the transition and the zero-temperature penetration depth (or alternatively the superfluid density ) can be extracted from a variety of experimental techniques, and in many cases those values are significantly different from each other. These problems seem to be most pronounced in highly-anisotropic SC, such as the cuprates and organic SC.
The DC conductivity at the transition is most directly obtained from transport (resistivity) measurements, but it can also be obtained from infrared (IR) and MW SI measurements, in the limit. The values obtained from these spectroscopic techniques are in some cases significantly different from the ones obtained from transport measurements. For example, for the organic compound (TMTSF)2PF6 along the most conducting a axis Dressel et al. report values obtained from both transport and IR measurements (Table I in Ref. Dressel et al. (1997)). The value obtained from the IR measurements is , whereas the DC value of conductivity is , i.e. it is more than 72 times higher. This is an extreme example, but the values for other compounds also show large discrepancies (Table I in Ref. Dressel et al. (1997)). Especially challenging are the IR measurements on systems with very small and very large conductivities, and one expects large error bars associated with them.
Similar problems occur with the superfluid density. This quantity can be extracted from optical spectroscopies (IR and MW SI), as well as muon spin resonance (SR) measurements. The superfluid density in layered systems along their least conducting direction is usually very small, which is also challenging for IR spectroscopy. Similar to , the values of obtained from different experimental techniques can differ significantly. For example, the values for underdoped La2-xSrxCuO4 reported by Panagopoulos et al. Panagopoulos et al. (2003) obtained using SR are several times smaller that those reported by IR spectroscopy. For for the sample the SR value of the penetration depth is 9.2 m, whereas the value obtained using IR on the sample with nominally the same doping level is 24.2 m (Table I in Ref Dordevic et al. (2005)). In this case the IR penetration depth is 2.6 times smaller, which results in superfluid density which is almost 7 times larger [Eq. (2)]. Similar discrepancies are seen in other samples characterized by large anisotropy.
The above examples illustrate the need for consistent data sets, i.e. data obtained on the same sample, with a single experimental technique. Therefore, in our current plots we include only such data points. The only two experimental techniques that can deliver both and simultaneously are IR and MW SI. Whenever possible, we used the data from IR spectroscopy, although in some cases, especially for systems with low , as well as systems with very low and very large conductivities, we were forced to use the MW SI data.
In Fig. 1 we re-plot the scaling from Eq. (1), but we now keep only the data points taken on the same sample, with a single experimental technique. The gray stripe shown in the picture corresponds to the . The plot includes a variety of different SC families, including the data for several organic SC. The values of parameters used for new data points are shown in Table 1.
The scaling relation Eq. 2 is shown in Fig. 2, using the same data from Fig. 1. The gray stripe corresponds to . A cursory inspection of the plot indicated that some organic SC points are slightly off the scaling line (the case of Sr2RuO4 was discussed above). However we do not see any systematic deviations from the scaling, as the points are located both below and above the scaling line. We suspect that these discrepancies are due to sample imperfections, as well as experimental issues. For example, the data points denoted 1 and 2 were taken on the same (BEDT-TTF)2Cu(NCS)2 sample, in the same study Dressel et al. (1994), at two different measurement frequencies (35 and 60 GHz, respectively); point 1 is on the scaling line, whereas point 2 is slightly below. Data points 3 and 4, on the other hand, have been taken on the same compound by two different groupsDressel et al. (1994); Milbradt et al. and point 4 (the more recent measurement) is on the scaling line, whereas point 3 is slightly below.
Discussion
Possible theoretical explanation of the observed scaling is a work in progress, but some existing proposals are worth mentioning. Tallon et al. argued that the scaling can be explained using a dirty limit picture in which the energy gap scales with Tc Tallon et al. (2006); Homes et al. (2005). However, it is well known that many superconductors on the scaling plot are not in the dirty limit. In fact, many of them are in the clean limit, and some of them have even shown quantum oscillations. This issue of ”dirtiness” in superconductors has been discussed beforeBasov and Chubukov (2011). ZaanenZaanen (2004) argued that the superconducting transition temperature in cuprates is high because the normal state in these systems is as viscous as is allowed by the laws of quantum mechanics. Zaanen also introduced the notion of Plankian dissipation in the cupratesZaanen (2004). However, this proposal does not explain why all superconductors, not just the curpates, follow the same scaling. Imry et al. demonstrated that the scaling may be recovered in an inhomogeneous superconductor in the limit of small intergrain resistance in a simple granular superconductor modelImry et al. (2012). The scaling relation Eq. (2) has also been derived using the gauge/gravity duality for a holographic superconductorErdmenger et al. (2012).
In summary, we have shown that when consistent data sets are used, all superconductors for which the data sets exist do indeed follow universal scaling relations that span more than seven orders of magnitude. Future experiments on other (exotic) SC will serve as important test of validity of scaling relations, and will verify if they are truly universal.
Methods
Data points shown in Figs. 1 and 2 are collected from different literature sources, either IR or MW SI measurements. Those two experimental techniques can simultaneously deliver the two parameters needed for scaling Eq. (2), namely the optical conductivity at Tc, , and the superfluid density (or the penetration depth ). This selection assures that the required parameters were collected on the same sample, in a single measurement, without the use of contacts.
acknowledgments
The authors thank C. Petrovic for pointing out the heavy fermion data. S.V.D. acknowledges the support from The University of Akron FRG. Research supported by the U.S. Department of Energy, Office of Basic Energy Sciences, Division of Materials Sciences and Engineering under Contract No. DE-AC02-98CH10886. D.N.B. acknowledges support from the National Science Foundation (NSF 1005493).
References
- Dordevic et al. (2002) S. V. Dordevic, E. J. Singley, D. N. Basov, S. Komiya, Y. Ando, E. Bucher, C. C. Homes, and M. Strongin, Phys. Rev. B 65, 134511 (2002).
- Homes et al. (2004) C. C. Homes, S. V. Dordevic, M. Strongin, D. A. Bonn, R. Liang, W. N. Hardy, S. Komiya, Y. Ando, G. Yu, N. Kaneko, X. Zhao, M. Greven, D. N. Basov, and T. Timusk, Nature (London) 430, 539 (2004).
- Homes et al. (2005) C. C. Homes, S. V. Dordevic, T. Valla, and M. Strongin, Phys. Rev. B 72, 134517 (2005).
- Ormeno et al. (2006) R. J. Ormeno, M. A. Hein, T. L. Barraclough, A. Sibley, C. E. Gough, Z. Q. Mao, S. Nishizaki, and Y. Maeno, Phys. Rev. B 74, 092504 (2006).
- Baker et al. (2009) P. J. Baker, R. J. Ormeno, C. E. Gough, Z. Q. Mao, S. Nishizaki, and Y. Maeno, Phys. Rev. B 80, 115126 (2009).
- Uemura et al. (1989) Y. J. Uemura, G. M. Luke, B. J. Sternlieb, J. H. Brewer, J. F. Carolan, W. N. Hardy, R. Kadono, J. R. Kempton, R. F. Kiefl, S. R. Kreitzman, P. Mulhern, T. M. Riseman, D. L. Williams, B. X. Yang, S. Uchida, H. Takagi, J. Gopalakrishnan, A. W. Sleight, M. A. Subramanian, C. L. Chien, M. Z. Cieplak, G. Xiao, V. Y. Lee, B. W. Statt, C. E. Stronach, W. J. Kossler, and X. H. Yu, Phys. Rev. Lett. 62, 2317 (1989).
- Basov and Timusk (2005) D. N. Basov and T. Timusk, Rev. Mod. Phys. 77, 721 (2005).
- Basov et al. (1994) D. N. Basov, T. Timusk, B. Dabrowski, and J. D. Jorgensen, Phys. Rev. B 50, 3511 (1994).
- Basov et al. (1999) D. N. Basov, S. I. Woods, A. S. Katz, E. J. Singley, R. C. Dynes, M. Xu, D. G. Hinks, C. C. Homes, and M. Strongin, Science 283, 49 (1999).
- Schneider (2002) T. Schneider, Europhys. Lett. 60, 141 (2002).
- Pimenov et al. (1999) A. Pimenov, A. Loidl, B. Schey, B. Stritzker, G. Jakob, H. Adrian, A. V. Pronin, and Y. G. Goncharov, Europhys. Lett. 48, 73 (1999).
- Homes et al. (2012) C. C. Homes, Z. J. Xu, J. S. Wen, and G. D. Gu, Phys. Rev. B 86, 144530 (2012).
- Homes (2009) C. C. Homes, Phys. Rev. B 80, 180509(R) (2009).
- Wu et al. (2010) D. Wu, N. Barišić, N. Drichko, P. Kallina, A. Faridian, B. Gorshunov, M. Dressel, L. J. Li, X. Lin, G. H. Cao, and Z. A. Xu, Physica C 470, S399 (2010).
- (15) U. S. Pracht, M. Scheffler, M. Dressel, D. Kalok, C. Strunkand, and T. I. Baturina, “Direct observation of the superconducting gap in thin film of titanium nitride using terahertz spectroscopy,” Preprint at http://arxiv.org/abs/1210.6771 (2012).
- Puchkov et al. (1996) A. V. Puchkov, T. Timusk, M. A. Karlow, S. L. Cooper, P. D. Han, and D. A. Payne, Phys. Rev. B 54, 6686 (1996).
- Tu et al. (2001) J. J. Tu, G. L. Carr, V. Perebeinos, C. C. Homes, M. Strongin, P. B. Allen, W. N. Kang, E.-M. Choi, H.-J. Kim, and S.-I. Lee, Phys. Rev. Lett. 87, 277001 (2001).
- Jin et al. (2003) B. B. Jin, T. Dahm, A. I. Gubin, E.-M. Choi, H. J. Kim, S.-I. Lee, W. N. Kang, and N. Klein, Phys. Rev. Lett. 91, 127006 (2003).
- Dressel et al. (1994) M. Dressel, O. Klein, G. Grüner, K. D. Carlson, H. H. Wang, and J. M. Williams, Phys. Rev. B 50, 13603 (1994).
- Drichko et al. (2002) N. Drichko, P. Haas, B. Gorshunov, D. Schweitzer, and M. Dressel, Europhys. Lett. 59, 774 (2002).
- (21) S. Milbradt, A. A. Bardin, C. J. S. Truncik, W. A. Huttema, P. L. Burn, S.-C. Lo, B. J. Powell, and D. M. Broun, “In-plane superfluid density and microwave conductivity of the organic superconductor -(BEDT-TTF)2Cu[N(CN)2]Br: evidence for d-wave pairing,” Preprint at http://arxiv.org/abs/1210.6405 (2012).
- Degiorgi et al. (1992) L. Degiorgi, P. Wachter, G. Grüner, S.-M. Huang, J. Wiley, and R. B. Kaner, Phys. Rev. Lett. 69, 2987 (1992).
- Ormeno et al. (2002) R. J. Ormeno, A. Sibley, C. E. Gough, S. Sebastian, and I. R. Fisher, Phys. Rev. Lett. 88, 047005 (2002).
- Baker et al. (2010) P. J. Baker, R. J. Ormeno, C. E. Gough, Y. Matsushita, and I. R. Fisher, Phys. Rev. B 81, 064506 (2010).
- Rõõm et al. (2002) T. Rõõm, B. Gorshunov, M. Dressel, K. Ahn, R. K. Kremer, and A. Simon, Phys. Rev. B 66, 012510 (2002).
- Powell and McKenzie (2004) B. J. Powell and R. H. McKenzie, J. Phys.: Condens. Matter 16, L367 (2004).
- Pratt and Blundell (2005) F. L. Pratt and S. J. Blundell, Phys. Rev. Lett. 94, 097006 (2005).
- Dressel et al. (1997) M. Dressel, G. Grüner, J. Eldridge, and J. Williams, Synthetic Metals 85, 1503 (1997).
- Panagopoulos et al. (2003) C. Panagopoulos, J. Tallon, B. Rainford, J. Cooper, C. Scott, and T. Xiang, Solid State Communications 126, 47 (2003).
- Dordevic et al. (2005) S. V. Dordevic, S. Komiya, Y. Ando, Y. J. Wang, and D. N. Basov, Phys. Rev. B 71, 054503 (2005).
- Tallon et al. (2006) J. L. Tallon, J. R. Cooper, S. H. Naqib, and J. W. Loram, Phys. Rev. B 73, 180504 (2006).
- Basov and Chubukov (2011) D. N. Basov and A. V. Chubukov, Nature Physics 7, 272 (2011).
- Zaanen (2004) J. Zaanen, Nature (London) 430, 512 (2004).
- Imry et al. (2012) Y. Imry, M. Strongin, and C. C. Homes, Phys. Rev. Lett. 109, 067003 (2012).
- Erdmenger et al. (2012) J. Erdmenger, P. Kerner, and S. Muller, Journal of High Energy Physics 2012, 1 (2012).