Astronomical seeing and ground-layer turbulence in the Canadian High Arctic
Abstract
We report results of a two-year campaign of measurements, during arctic winter darkness, of optical turbulence in the atmospheric boundary-layer above the Polar Environment Atmospheric Laboratory in northern Ellesmere Island (latitude +80∘ N). The data reveal that the ground-layer turbulence in the Arctic is often quite weak, even at the comparatively-low 610 m altitude of this site. The median and 25th percentile ground-layer seeing, at a height of 20 m, are found to be 0.57 and 0.25 arcsec, respectively. When combined with a free-atmosphere component of 0.30 arcsec, the median and 25th percentile total seeing for this height is 0.68 and 0.42 arcsec respectively. The median total seeing from a height of 7 m is estimated to be 0.81 arcsec. These values are comparable to those found at the best high-altitude astronomical sites.
keywords:
site testing – atmospheric effects1 Introduction
The high glacial plateau of Antarctica has attracted considerable interest from astronomers due to unique benefits offered by its geographic location. The long periods of continuous darkness available at extreme latitudes are important for time-sensitive programs such as exoplanet transit surveys and targets of opportunity. Low ambient temperatures result in reduced backgrounds for infrared observations. In addition, there is evidence that the free atmosphere has relatively weak turbulence and potential for superlative astronomical seeing (Lawrence et al., 2004; Aristidi et al., 2005; Agabi et al., 2006). The result is improved performance for telescopes for observations with and without adaptive optics.
The Arctic offers many of the same advantages as the Antarctic. But it also has some additional attractions. Coastal mountain ranges reach high elevations, and are well away from central icecaps which potentially suffer the strong surface-layer turbulence associated with the glacial plateau of Antarctica (Marks et al., 1996, 1999; Marks, 2002). In addition, isolated unglaciated terrain can provide solid footings for astronomical telescopes. In northern Canada, some of these locations are accessible from existing research bases.
The northernmost tip of Ellesmere Island is within of the Pole. More than 50 years of continuous weather records from the manned stations of Alert and Eureka show that the climate is dry, with typical winter temperatures averaging -40 C. In winter darkness a strong inversion layer develops in the lower 1-2 km of the atmosphere, producing stable atmospheric conditions. During that time clear sky is found approximately 60% of the time (Steinbring et al., 2010). Both Eureka and Alert have airstrips that are accessible year round by passenger and cargo aircraft, and Eureka is accessible by ship in the summer.
These considerations have motivated a program of in-situ measurements at several mountain sites with the aim of assessing the suitability of the region for astronomy (Steinbring et al., 2008, 2010). Robotic instruments were deployed during the summer by helicopter at three mountain sites near the north shore of Ellesmere Island. Their purpose was to measure weather and sky conditions through the winter. The data confirmed both the expected high clear-sky frequency and low median wind speeds associated with the development of a strong thermal inversion layer during winter darkness.
Most recently, our attention has focussed on a mountain ridge near Eureka which is the site of a laboratory for climate research. The Polar Environment Atmospheric Research Laboratory (PEARL), originally built for atmospheric ozone measurements, has been refurbished and used by the Canadian Network for the Detection of Atmospheric Change since 2005. This facility has essential infrastructure, including electrical power and a broadband satellite communications link. Until recently, it was staffed by technicians year round. The combination of infrastructure, accessibility, and a mountain-top location makes PEARL an ideal facility for testing arctic instruments, and a potential site for astronomical telescopes.
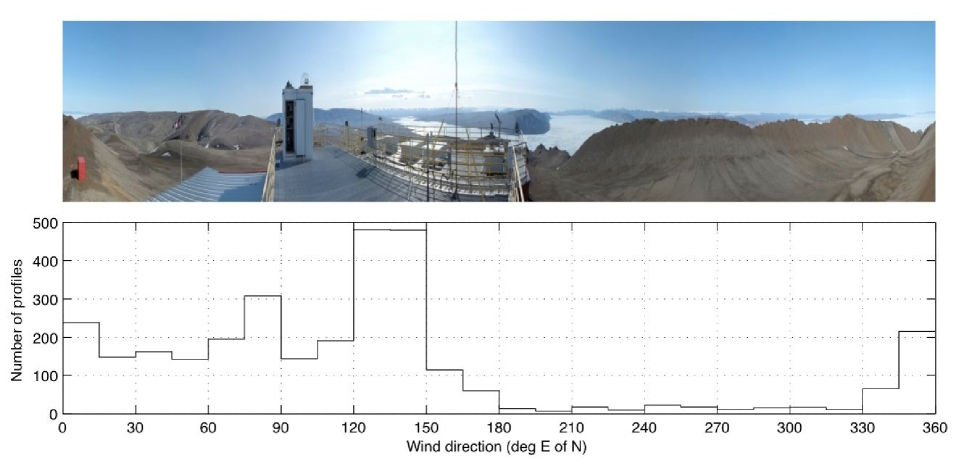
The PEARL laboratory is located on a ridge, aligned north-south, at 610 m altitude (see Steinbring et al. 2010 for additional information and a map of the region). The surrounding terrain falls steeply towards the south and more gradually towards the north and east. The principal topographic feature that could induce turbulence is a parallel ridge of equal altitude, approximately 200 m to the west. This ridge can be clearly seen in the panoramic view of Fig. 1. However, during good winter weather the wind rarely comes from this direction, the prevailing winds during clear skies are northerly, with bad weather usually arriving from the south.
In 2009, an instrument was developed at the University of British Columbia for the express purpose of characterizing atmospheric turbulence and astronomical seeing at remote Arctic sites - and designed to operate under harsh environmental conditions. The Arctic Turbulence Profiler (ATP) is a specialized lunar scintillometer which senses optical turbulence by measuring correlations in the scintillation of moonlight. From the data one obtains time-resolved profiles of turbulence strength as a function of altitude within the first km of the atmosphere. From this one can determine the contribution of ground-layer turbulence to the total seeing as a function of telescope height above ground.
As a first step towards eventual deployment at the remote northern mountain sites, the ATP was operated at PEARL for two years, beginning in the fall of 2009. Initial results from the first winter were reported by Hickson et al. (2010). In this paper we present results from the full two-year data set.
2 Observations
The ATP instrument has been described in detail by Hickson et al. (2010). It employs silicon photodiodes to measure the small fluctuations in the lunar flux that arise when the light propagates through atmospheric turbulence. These fluctuations are spatially correlated, with a coherence length that is proportional to the altitude of the turbulence. By analyzing the coherence between pairs of photodiodes as a function of their mutual separation, it is possible to obtain an estimate of the turbulence index of refraction structure constant, , as a function of height above the ground. A two-minute average is used to obtain accurate covariances, so the ATP produces a profile every 2 minutes.
The 48 photodiodes in the ATP are arranged in 6 rings located at different heights along a vertical axis. Each ring contains 8 photodiodes separated in azimuth angle by 36∘ (a arc on the north side of the instrument is not filled because the Moon is too low in the sky in that direction). As the Earth rotates, the Moon illuminates sequentially one photodiode in each ring. A computer selects the appropriate photodiode for data collection. In this manner, the Moon can be tracked without any physical motion of the instrument. At any given time, six photodiodes (one per ring) record the irradiance (flux) of light from the Moon, providing 15 independent pairs having separations (baselines) ranging from 0.128 to 2.000 m. The signal from each photodiode is amplified and both the steady (DC) and fluctuating (AC) signals are digitized. The sampling rate is 800 Hz. From this the dimensionless irradiance fluctuation is determined for each of the photodiodes. Data are recorded automatically whenever the Moon is more than 19∘ above the horizon and when the Sun is more than 9∘ below the horizon, regardless of atmospheric conditions.
Each photodiode is protected by an entrance window that has a conductive coating. Power was periodically applied, to windows not currently observing the Moon, in order to melt any frost or ice. An optical filter, located between the window and the photodiode passes wavelengths greater than 700 nm. It’s purpose is to block the strong auroral lines found at 558, 630, 636 and 656 nm.
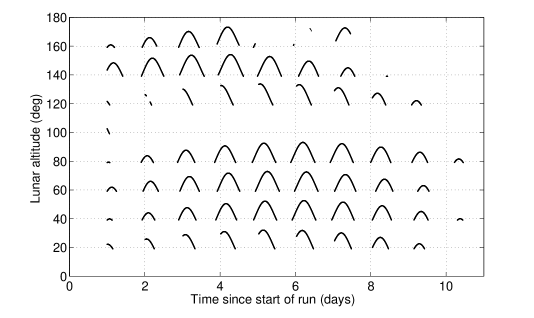
The ATP was sent to PEARL in August 2009 and installed on the roof of the laboratory. As Fig. 1 shows, this location has an unobstructed view of the surrounding terrain. The bottom of the array was approximately 7 m above ground level. Engineering tests were conducted in September and October, and observations commenced on November 1. Fig. 2 shows the days and times of observations, and the corresponding lunar altitude. Observing statistics are reported in Table 1. Instrument problems interrupted the observations on three occasions (Nov 5 and 6, 2009 and Feb 19, 2010). The instrument was damaged during a storm in December 2009, which precluded any observations until after its repair in January 2010.
| (1) | (2) | (3) | (4) | (5) | (6) |
|---|---|---|---|---|---|
| Run | Dates | Acquired | Frost-free | Clear | Photometric |
| (hr) | (hr) | (%) | (%) | ||
| 1 | 2009/11/01 - 2009/11/07 | 51.63 | 12.23 | 40.60 | 40.33 |
| 2 | 2010/01/23 - 2010/01/31 | 94.00 | 40.33 | 81.49 | 74.63 |
| 3 | 2010/02/18 - 2010/02/27 | 60.50 | 44.37 | 47.18 | 16.53 |
| 4 | 2010/03/22 - 2010/03/26 | 1.57 | 1.57 | 100.00 | 31.91 |
| 5 | 2010/11/18 - 2010/11/27 | 108.13 | 29.27 | 65.60 | 57.18 |
| 6 | 2010/12/15 - 2010/12/24 | 104.90 | 30.93 | 11.96 | 7.22 |
| 7 | 2011/01/11 - 2011/01 21 | 104.80 | 51.90 | 84.97 | 65.32 |
| 8 | 2011/11/01 - 2011/02/17 | 75.50 | 56.80 | 62.97 | 19.89 |
| Total | 2009/11/01 - 2011/02/17 | 601.03 | 267.40 | 60.99 | 40.03 |
3 Data analysis
Although the ATP has heated windows, they were not always effective at removing frost and ice. The presence of frost can be detected by comparing the DC signals received from the 6 photodiodes that are illuminated by the Moon at any given time. If the windows are clear, these signals typically differ by less than 1%. If frost or ice is present, these variations become much larger. A threshold of 3% for the RMS variation in the DC signals was taken as being an indication of frost, ice or ice-fog. When possible, this was confirmed by direct observation by an onsite technician.
According to this ice criterion, 51% of our data were found to be affected by frost, ice, or ice crystals and were therefore rejected. The number of frost-free hours for each run are reported in column (4) of Table 1.
For each 120-second data record, the expected lunar flux was estimated by means of a semi-emperical model based on the Lommel-Seeliger law. The lunar flux, normalized to unity at full moon, was found to be reasonably well-fit by the equation
| (1) | |||||
where is the lunar phase angle in degrees. After applying a correction for airmass, the observed flux was compared to that predicted by Eqn. (1) and the ratio of observed to predicted flux was computed. The result gives an estimate of atmospheric transparency that is generally accurate to within about 10%.
This transparency index can be used to estimate the fraction of clear sky at the site. For each run, the number of records for which the transparency is estimated to be greater than 50% was determined, and divided by the number of records that were frost-free. The result is reported in column (5) of Table 1 as the fraction of clear sky.
The definition of photometric conditions is somewhat arbitrary, depending on the desired photometric accuracy. For this paper, we define photometric to mean that the observed scintillation index of the Moon does not exceed . This is more than an order of magnitude larger than the scintillation index that would result from atmospheric turbulence alone. It corresponds to RMS atmospheric transparency variations at the level of 0.3%, i.e. 0.003 magnitudes.
In practice this means that the sky is clear enough for us to obtain an accurate turbulence profile. However, thin cirrus clouds might still be present. Due to their high ( km) altitude, such clouds produce intensity correlations over all baselines. The resulting covariance is practically independent of baseline over the range covered by our instrument. In contrast, the atmospheric covariance signal, which arises primarily from turbulence in the lower km of the atmosphere, falls rapidly with increasing baseline and is essentially zero on the largest baselines. Transparency fluctuations are independent of the atmospheric turbulence signal, so the covariances of the two effects are additive. Therefore, in the case of very thin cirrus (% optical depth), the atmospheric covariance function can be recovered by subtracting a constant background determined from the longest baseline.
From all recorded data, covariances were computed for 120 s intervals. For each 120 s sequence, the mean transparency, ice index and scintillation index was also computed. Sequences that were deemed to be free of frost or ice, and were found to be photometric by the above criteria were analyzed by our standard lunar scintillometer pipeline.
The inversion technique is described in Hickson, Pfrommer & Crotts (2008). Briefly, an 8-parameter model was used to represent the atmospheric turbulence profile. For each set of model parameters, the predicted covariance for each baseline was computed and a nonlinear optimization technique was used to find the model parameters that best fit the data. A Bayesian approach was used which enforces the condition that the model be physically acceptable (no negative values of ) and employs prior knowledge of the typical variations of found at astronomical sites. The optimization was done by maximizing the posterior probability by means of a Markov-chain Monte Carlo algorithm. The model parameters are the values of at eight reference heights, which are chosen to be 1, 10, 20, 40, 80, 160, 320, and 640 m. Linear interpolation in log-log space was used to determine values between the reference heights. Above 640 m, the model decreases as the -1.735 power of the height. As will be shown below, this function provides a good fit to the observed data in the range 10 - 640 m. The exact behaviour at high altitudes is not critical since the scintillometer has little sensitivity at altitudes above km, due to a combination of aperture averaging and the effects of the outer scale of turbulence. As a check, the pipeline was run with a rather extreme model which dropped rapidly above 640 m, with a power law index of -9. This changed the derived values of the seeing FWHM by less than 2%.
The covariance on baseline (the component of separation perpendicular to the line of sight) is related to by an integral equation
| (2) |
where is the zenith angle of the Moon and is a response function that represents the covariance on baseline produced by a unit impulse at range . This function depends on the phase and orientation of the Moon, the size and shape of the sensor active area and the assumed turbulence outer scale . Response functions were precomputed for all baselines, for every degree of lunar phase. The outer scale was taken to be 20 m.
Once the profile has been determined, Fried’s parameter and the FWHM of the atmospheric point-spread function at the zenith can be computed, as a function of the height of the telescope above the ground, by integrating the profile vertically through the atmosphere according to
| (3) | |||||
| (4) |
As is standard, the results were computed for a wavelength of um and a zenith angle of .
4 Results
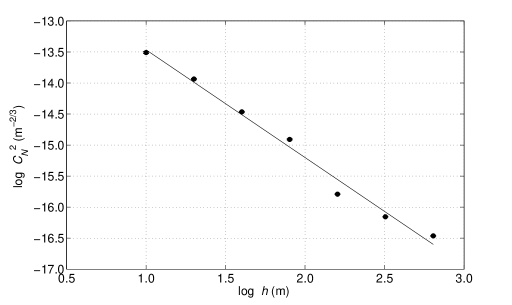
A total of 3118 2-minute records, corresponding to 103.93 hours of observation, were photometric and frost-free. From these, 3118 profiles were determined. The median values of are shown by the points in Fig. 3. The line shown in the figure is the best fit linear regression to the data points. It corresponds to the equation
| (5) |
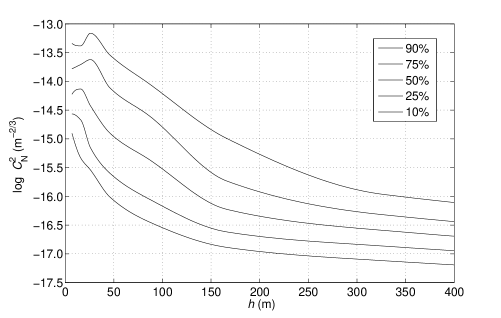
where is the height above ground in m and the units of are m-2/3. It can be seen that this power law fits the data quite well for heights above 16 m. The median, as well as 10, 25, 75 and 90th percentiles of are plotted as a function of height, in the lower 400 m of the atmosphere, in Fig. 4. During times of poor seeing, rises by about three orders of magnitude from 400 m to 10 m above ground. In good seeing, the rise is about a factor of ten smaller.
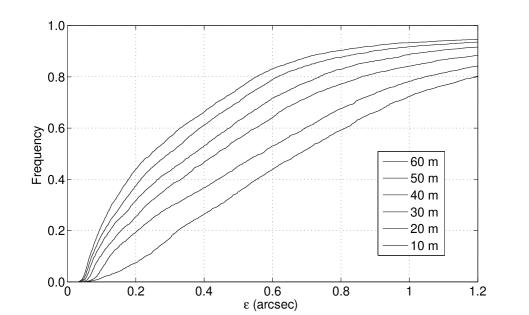
A statistic of particular interest for astronomy is the full width at half-maximum intensity (FWHM), , of the atmospheric point spread function. This determines the image quality for seeing-limited observations with a telescope located at a height above ground. For large telescopes, should be taken as the height of the dome, or dome shutters. The cumulative distribution of , computed for heights ranging from 10 to 60 m above ground, is shown in Fig. 5. Percentiles of these distributions are listed in Table 2, which also includes values for a 7-metre altitude, to facilitate comparison with other astronomical sites.
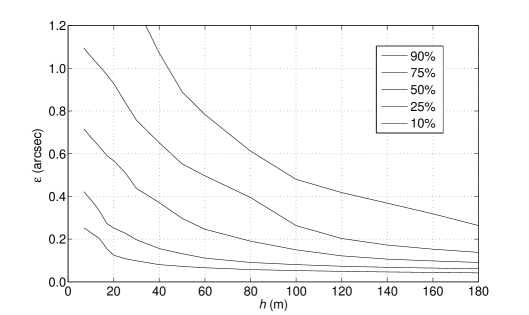
In Fig. 6. the ground-layer seeing is shown as a continuous function of height above ground, for the same percentiles as in Fig. 4. From this it can be seen that the ground layer is generally quite thin, with the seeing at 40 m being better by about a factor of two compared to 7 m.
| (1) | (2) | (3) | (4) | (5) | (6) |
|---|---|---|---|---|---|
| Height (m) | 10% | 25% | 50% | 75% | 90% |
| 7 | 0.251 | 0.422 | 0.716 | 1.095 | 1.894 |
| 10 | 0.230 | 0.384 | 0.676 | 1.055 | 1.823 |
| 20 | 0.124 | 0.252 | 0.567 | 0.929 | 1.587 |
| 30 | 0.098 | 0.197 | 0.437 | 0.757 | 1.288 |
| 40 | 0.080 | 0.156 | 0.371 | 0.651 | 1.071 |
| 50 | 0.072 | 0.132 | 0.297 | 0.552 | 0.890 |
| 60 | 0.066 | 0.111 | 0.246 | 0.496 | 0.783 |
5 Discussion
The results described above apply only to the ground-layer component of atmospheric turbulence, which comprises essentially all turbulence in the lower km of the atmosphere. In addition, there will be a contribution from the free atmosphere, which extends from the ground layer to the stratosphere. The contribution of the free atmosphere to the seeing FWHM depends primarily on turbulence in the tropopause region where wind shear associated with the jet stream creates strong turbulent layers. The total seeing can be found by adding the turbulence integrals for the ground layer and the free atmosphere. This leads to the “quadrature” relation
| (6) |
for the ground layer and free atmosphere seeing, and .
At the best mid-latitude sites, the median free-atmosphere seeing is on the order of 0.33 - 0.48 arcsec (Skidmore et al., 2009). In contrast, values closer to 0.25 arcsec have been found above the Antarctic plateau (Agabi et al., 2006). As our scintillometer is not sensitive to high-altitude turbulence, we are not able to measure . However, recent observations have been made using a Multi-Aperture Scintillation Sensor (MASS). From 118 hours of observations in the winter of 2011-2012, Steinbring et al. (2013a) obtained typical values on the order of 0.30 arcsec for the free atmosphere above PEARL.
For a given free atmosphere contribution, and the ground-layer seeing values from Table 2, we estimate the total seeing using Eqn. (6). Taking arcsec from the MASS observations, we obtain the estimated total seeing shown in Table 3. These values are in good agreement with recent measurements made from the roof of the PEARL building, using a differential image motion monitor (Steinbring et al., 2013a).
| (1) | (2) | (3) | (4) | (5) | (6) |
|---|---|---|---|---|---|
| Height (m) | 10% | 25% | 50% | 75% | 90% |
| 7 | 0.419 | 0.552 | 0.813 | 1.169 | 1.946 |
| 10 | 0.404 | 0.521 | 0.776 | 1.131 | 1.877 |
| 20 | 0.340 | 0.419 | 0.678 | 1.011 | 1.646 |
| 30 | 0.327 | 0.382 | 0.565 | 0.850 | 1.355 |
| 40 | 0.319 | 0.357 | 0.510 | 0.753 | 1.146 |
| 50 | 0.316 | 0.344 | 0.452 | 0.664 | 0.975 |
| 60 | 0.314 | 0.333 | 0.415 | 0.615 | 0.874 |
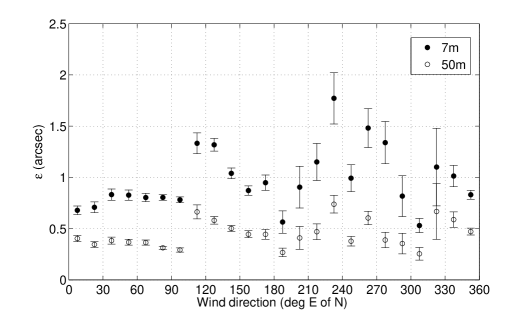
Further insight can be obtained by examining records from the PEARL weather station for the times of our observations. These were kindly provided to us by Dr. Pierre Fogal. In Fig. 1. we see that, during clear and frost-free hours of winter darkness, the wind rarely came from the west. The predominant direction is from the SE. This puts the ATP instrument downwind of the bulk of the heated laboratory building, so one might expect some thickening of the ground layer and degradation of seeing as a result. Fig. 7 shows that the seeing is best when the wind is in the NE quadrant, and significantly worse in the SE quadrant. This pattern is also seen at the 50 m height, so is unlikely to be due to a purely local effect. The seeing is somewhat worse when the wind is from the SW. This could be an effect of turbulence induced by the ridge to the west of PEARL (Fig. 1), but we also find relatively-good seeing for the azimuth range degrees. It would be unwise to draw any firm conclusions for westerly winds due to the small quantity of data for the range degrees.
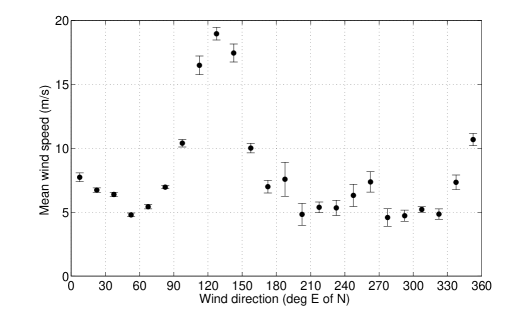
Wind speed can also affect seeing. A moderate wind is usually best, to carry away local thermal plumes while not inducing too much mechanical turbulence. At PEARL, the wind speed correlates strongly with direction, at least for the times of our observations. Fig. 8 shows that the average wind speed is high, in the range m/s, when the wind direction is in the range degrees. This may also be a contributing factor to the relatively-high seeing FWHM found in this same azimuth range. There, seeing values exceeding 1 arcsec (at 7 m) correspond to wind speed exceeding 15 m/s. However, wind speed does not appear to be the cause of the high values of FWHM found when the wind is in the western quadrants, since the wind speed from those directions is relatively low, typically 5 m/s.
These results show that seeing at the PEARL site is often comparable to that found at mid-latitude sites that are at much higher altitudes. For example, Skidmore et al. (2009) found median values of ground-layer seeing, from a height of 7 m, ranging from 0.34 to 0.58 arcsec for the five candidate sites studied for the Thirty Meter Telescope project. The values of total seeing ranged from 0.63 to 0.79 arcsec at these sites.
The seeing at PEARL is surprisingly good considering that its altitude is only 610 m. There is higher terrain near Eureka and the mountain sites along the north-western coast of Ellesmere Island (N) investigated with weather stations and sky monitors have altitudes in the range 1400 to 1900 m. These sites were all found to have climate conditions as good or better than PEARL. However, so far only some basic image quality measurements have been made with a Polaris tracker, not true seeing measurements (Steinbring et al., 2013b). Deploying the ATP at one of these remote high-altitude sites would require a reliable source of electric power and improvements to the ice protection system. But solutions to these technical issues are readily found, which could allow measurements as part of an expanded exploration program.
Acknowledgments
We thank J. Drummond and the staff of PEARL for providing access to the facility, and for invaluable technical support. We are indebted to P. Fogal for providing unpublished data from the PEARL meteorological station for the dates of our observations. Logistical support was provided by Environment Canada and by Natural Resources Canada through the Polar Continental Shelf Program. TP and ES are particularly indebted to the staff of the Eureka weather station for their warm hospitality. M. Schöck provided helpful advice and assistance with preparations at PEARL. We thank the referee, T. Travouillon, for his helpful comments. This work was supported by grants from the Natural Sciences and Engineering Research Council of Canada.
References
- Aristidi et al. (2005) Aristidi E., Agabi A., Azouit M., Fossat E., Vernin J., Sadibekova T., Ziad A., Martin F., 2005, Bulletin de la Soci t Royale des Sciences de Li ge 74, 5.
- Agabi et al. (2006) Agabi A., Aristidi E., Azouit M., Fossat E., Martin F., Sadibekova T., Vernin J., Ziad A., 2006, PASP, 118, 344
- Hickson et al. (2010) Hickson P., Carlberg R., Gagné R., Pfrommer T., Racine R., Schöck M., Steinbring E., Travouillon T., 2010, Proc SPIE, 7733, 77331R
- Hickson, Pfrommer & Crotts (2008) Hickson P., Pfrommer T., Crotts A., 2008, in Optical Turbulence, Astronomy meets Meteorology, ed. E. Masciadri and M. Sarazin, ESO, Germany
- Lawrence et al. (2004) Lawrence J.S., Ashley M.C.B., Tokovinin A., Travouillon T., 2004, Nature 431, 278
- Marks (2002) Marks R.D., 2002, A&A. 385, 328
- Marks et al. (1996) Marks R.D., Vernin J., Azouit M., Briggs J.W., Burton M.G., Ashley M.C.B., Manigault J.F., 1996, A&AS, 118, 385
- Marks et al. (1999) Marks R.D., Vernin J., Azouit M., Manigault J.F., Clevelin C., 1999, A&AS, 134, 161
- Skidmore et al. (2009) Skidmore W., Els S., Travouillon T., Riddle R., Schöck M., Bustos E., Seguel J., Walker D., 2009, PASP 121, 1151
- Steinbring et al. (2010) Steinbring E., Carlberg R., Croll B., Fahlman G., Hickson P.,Ivanescu L., Leckie, B., Pfrommer, T., Schoeck, M., 2010, PASP, 122, 1092
- Steinbring et al. (2008) Steinbring E., Leckie B., Welle P., Hardy T., Cole B., Bayne D., Croll B., Walker D.E., Carlberg R.G., Fahlman G.G., Wallace B., Hickson P., 2008, Proc. SPIE, 7012, .70121V
- Steinbring et al. (2013a) Steinbring E., Millar-Blanchaer, M., Ngan, W., Murowinski, R., Leckie B., Carlberg R., 2013, PASP, submitted
- Steinbring et al. (2013b) Steinbring, E., Leckie, B., Hardy, T., Caputa, K. & Fletcher, M., 2012, SPIE Conf. Series 8444, 1