Dust Scattering and the Radiation Pressure Force in the M82 Superwind
Abstract
Radiation pressure on dust grains may be an important physical mechanism driving galaxy-wide superwinds in rapidly star-forming galaxies. We calculate the combined dust and gas Eddington ratio () for the archetypal superwind of M82. By combining archival GALEX data, a standard dust model, Monte Carlo dust scattering calculations, and the Herschel map of the dust surface density distribution, the observed FUV/NUV surface brightness in the outflow constrains both the total UV luminosity escaping from the starburst along its minor axis () and the flux-mean opacity, thus allowing a calculation of . We find that ergs s-1, times greater than the UV luminosity observed from our line of sight. On a scale of kpc above the plane of M82, we find that . On smaller scales ( kpc), where the enclosed mass decreases, our calculation of implies that with factor of few uncertainties. Within the starburst itself, we estimate the single-scattering Eddington ratio to be of order unity. Thus, although radiation pressure is weak compared to gravity on kpc scales above the plane of M82, it may yet be important in launching the observed outflow. We discuss the primary uncertainties in our calculation, the sensitivity of to the dust grain size distribution, and the time evolution of the wind following M82’s recent starburst episodes.
Subject headings:
galaxies: formation, galaxies: general, galaxies: starburst, galaxies: individual: M821. Introduction
Galactic winds are crucial to the evolution of galaxies (see, e.g., Heckman et al. 1990). Several mechanisms have been proposed for driving them, including heating from supernovae (Chevalier & Clegg 1985) and stellar winds, heating from photoionization (Shapiro et al. 2004), and radiation pressure on dust grains (Murray et al. 2005, 2011, Zhang & Thompson 2012). Recent simulations indicate that radiation pressure may indeed be an important driver in galaxies with high star formation rates and gas densities (Hopkins et al. 2012). In the radiation pressure picture, radiation from hot stars drives dusty gas out of individual star-forming clouds, disrupting them, cutting off star formation, and then lofting this gas above the plane, where radiation from the entire galactic disk drives the gas fully out of the galaxy as a galactic superwind (Murray et al. 2011, Hopkins et al. 2012).
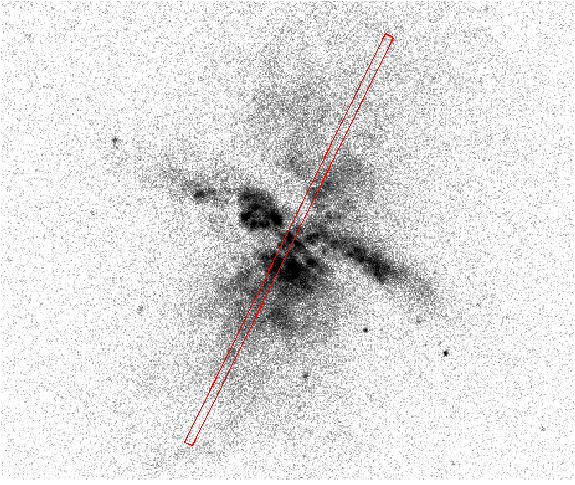
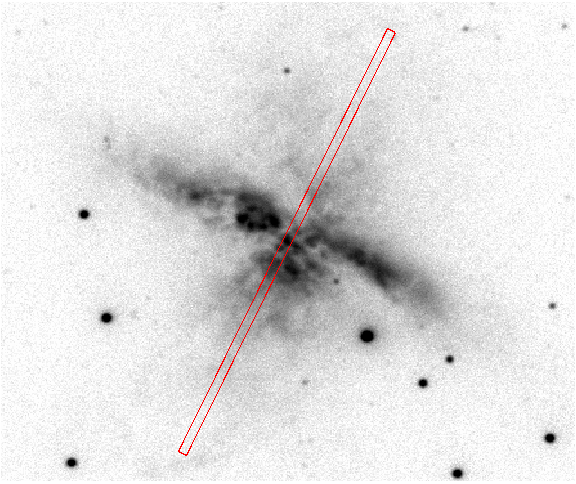
We examine the particular case of M82 (distance 3.63 Mpc, Gerke et al. 2011, Freedman et al. 1994), one of the nearest starburst galaxies to the Milky Way, in order to test whether radiation pressure is important in this case. There are extensive archival observations of M82 in many bands (see, e.g., McLeod et al. 1993, Westmoquette et al. 2007). However, the starburst core of M82, where most of the UV and optical radiation that would be important for driving the wind is generated, is heavily obscured by dust along our line of sight because M82 is nearly edge-on (inclination: , McKeith et al. 1993). The wind itself is quite bright in UV light on kpc scales above the plane (Figure 1), and work by Hoopes et al. (2005) indicates that this emission is mostly due to dust in the wind scattering UV light from the central starburst into our line of sight, rather than other potential sources of in situ UV emission such as photoionization and shocked gas.
The fundamental measure of whether radiation pressure is currently important in driving the wind is the Eddington ratio, . To calculate , we need to know the dynamical mass of M82 interior to our observation point a height above the plane, , the flux-mean opacity of the dust/gas wind fluid , and the true luminosity of the starburst that escapes to a height from the disk, .
Although the bolometric luminosity of M82 is fairly well known from FIR data (, Sanders et al. 2003), the shape of the SED in the UV above the plane, and specifically the UV luminosity at a height above the plane, is unknown without modeling. In principle, could be as high as . If so, assuming spherical symmetry,
| (1) |
where and of gas, normalized to a value appropriate for an SED dominated by UV light (Laor & Draine 1993). The Eddington ratio would then be , suggesting that the radiation pressure force on the dusty gas could be comparable to gravity if the UV luminosity above the plane is of order . For comparison, the total observed UV luminosity of M82 in the GALEX bands from Hoopes et al. (2005) is , or and .
By modeling the dust scattering, we work backwards using archival GALEX images of M82, presented by Hoopes et al. (2005) (see Figure 1), to obtain the UV luminosity escaping perpendicular to the disk of M82. We then model the stellar population, which together with the scattered UV flux, allows us to obtain an SED of the radiation field at height and to calculate the Eddington ratio with the chosen dust model. This calculation includes an MRN distribution (Mathis et al. 1977), STARBURST99 spectra (Leitherer et al. 1999), and dust grain properties calculated by Laor & Draine (1993). Changes in the grain size distribution are discussed in Section 3.
In Section 2 we give an order of magnitude estimate of the UV luminosity that escapes perpendicular to the plane, as well as estimates of various parameters. In Section 3 we provide our results. In Section 4 we give a description of the uncertainties in our work. A brief discussion and summary are presented in Sections 5 and 6.
While we were completing this work, Socrates & Sironi (2013) also presented a calculation of the Eddington ratio for M82 (top panel of their Fig. 1). However, their calculation makes use of the SED model of Silva et al. (1998), which makes no correction for the inclination dependence of the SED and the different shape of the radiation field emerging perpendicular to the disk. Our work is distinct in that we account for the inclination dependence, estimate the SED shape from the scattered FUV and NUV light, and estimate along the minor axis. In addition, by taking into account the observed rotation curve of the M82, we are able to estimate the Eddington ratio as a function of height along the minor axis. We are then able to make an estimate of the single-scattering Eddington limit within the starburst (Section 5).
2. Estimates
2.1. Order of Magnitude Calculation
We expect that because at least a portion of the UV radiation in the starburst is absorbed within the system itself and never emerges to kpc scales above the plane.
In order to estimate the UV flux which escapes the starburst region and scatters on grains a distance above the plane, we make several simplifying assumptions: first, that the starburst disk is a point source; second, that the dust in the wind outside of the starburst region is optically thin to the scattered UV (i.e., each photon scatters at most once); third, that the density of the wind is constant along our line of sight at a given height above the plane of M82; and fourth, that the wind is illuminated as a right circular cone. Treating this system as steady-state, we can write down the radiative transfer equation for this system:
| (2) |
where is the specific starburst luminosity at wavelength , is the distance from the central source, is the density of the dust, is its scattering opacity, and is a wavelength-dependent factor that captures the anisotropy of dust scattering in the UV.
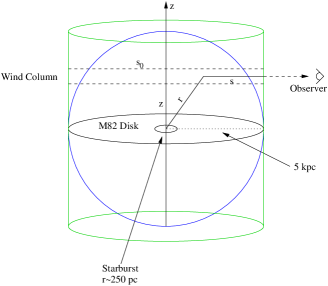
Because the total path length through the wind is comparable to the height above the disk, changes significantly when integrating over a path through the wind that runs parallel to the disk. Along such a path (see Figure 2),
| (3) |
where is the total thickness of the illuminated portion of the wind, is the path length actually traversed by a given photon on this path, and the height above the disk. This gives
| (4) |
The observed flux from a given aperture in the M82 wind is then
| (5) |
where the angle is the angular radius of the source aperture. For our work, we use an aperture with a radius of five GALEX pixels, or (compare to GALEX’s resolution of and in the FUV and NUV, respectively). Substituting, one finds an expression for the observed flux, which can then be inverted to give the luminosity of the starburst at wavelength escaping the central starburst region
| (6) |
The GALEX images indicate that the dust is illuminated as a cone with a opening angle, so that . With reasonable values of the other parameters, the luminosity is
| (7) |
where is the distance above the plane of M82, is a geometric factor that captures the physics of anisotropic UV scattering off dust grains, is the mass density of the dust distribution, is the scattering opacity per gram of dust, is the observed flux, and is the effective wavelength of the FUV band.
The sum of the UV luminosity in the two GALEX bands is , where is the effective bandwidth of the GALEX filters (268 Å for FUV and 732 Å for NUV). This is 5 times the total observed UV luminosity from Hoopes, et al. (2005) and about .
2.2. Parameter Estimates
In order to estimate the density distribution of dust in the superwind, we use the dust column mass map from Figure 2 of Roussel et al. (2010). This dust map is based on Herschel SPIRE and data. Roussel et al. (2010) used these data to calculate a map of the dust mass surface density, , with a resolution of 170 pc. They estimate that the total dust mass in the halo is and at least 65% of the dust is not associated with the superwind. From this map, we get a dust column density for each location in the wind.
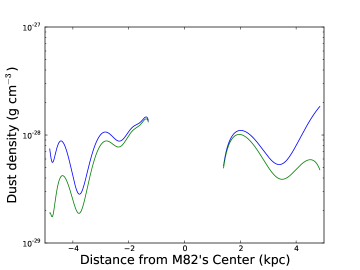
We assume two different model geometries: a spherical distribution truncated at 5 kpc and a 5 kpc radius cylinder, both centered on M82 (Figures 2 and 3). We then assume that the volume density of dust in each column is constant, so that . In Figure 3 we show that both of these geometries produce dust density estimates within an order of magnitude of (Equation 7). The overall shapes of the different distributions are the result of the behavior of ; the spherical model produces higher densities further out because rapidly shrinks at the extremities. It should be noted that the UV light from the starburst illuminates only a small portion of either of these models (Figure!1). This is consistent with the observed morphology of the UV and FIR maps, since the latter shows an extended dust distribution, while the UV images show a smaller conical illuminated region.
To calculate the dust opacity, we assume an MRN dust distribution (Mathis et al. 1977), with 50% each of graphite and silicate grains. We then use the absorption and scattering cross sections from Laor & Draine (1993). We combine this with unreddened STARBURST99 models of the stellar spectra (Leitherer et al. 1999), and calculate a total flux-mean scattering opacity integrated over the entire SED of of dust (Equations 2, 7), assuming a bimodal stellar population with components aged 4 and 9 Myr (Förster Schreiber et al. 2003).
We use three dimensional Monte Carlo scattering simulations to estimate . Each simulation run (one for each model geometry and bandpass) used photons with a weighting scheme that guaranteed each photon scattered once (Wood et al. 2001). We assumed that the wind was optically thin, and that attenuation due to absorption was minimal and could be ignored. To substantiate that assumption, we calculated the optical depth along each sight line. In the region for which we have dust density data, the total optical depth in either band for an average sight line is in the FUV, given the Roussel et al. (2010) dust density data and our model geometries. We ignored light from M82’s outer disk, and approximated the starburst as a point-source. Modeling the starburst as a disk of radius 250 pc (Förster Schreiber et al. 2003) is a effect at 1 kpc from the plane, and becomes less important at larger distances. As shown in Figure 3, we have no dust density data within pc of the center of M82, because the Roussel et al. (2010) map provides no estimate of in that region due to difficulties in subtracting the disk PSF. For the purposes of the simulation, we set the density to zero there, allowing photons to propagate freely outward until they encounter the overlying wind material. This hole in the dust distribution results in zero scattering events into our line of sight. We ultimately removed the region from 1.5 kpc south to 1.8 kpc north (see Figures 5 and 8).
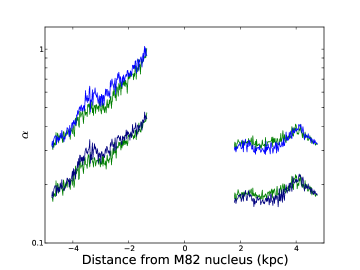
The geometric factor is the ratio of the predicted flux with the Draine (2003a) phase function to the predicted flux for the case of isotropic scattering. Figure 4 plots as a function of distance from the plane of M82. For the FUV band, and for the NUV band for both of our model geometries for the northern lobe of the wind. Due to the fact that the southern lobe is pointed towards us, varies by a factor of 5 over that portion of the wind, from 0.3 at 4.5 kpc to 1.5 at 1.5 kpc for the FUV band. This difference in the behavior of between the northern and southern lobes arises from the shape of the Draine phase function. The Draine phase function is relatively flat at the scattering angles covered by the northern lobe of the wind, but begins to rise more steeply as the dust moves into the forward-throwing regime.
3. Results
3.1. The Intrinsic UV Luminosity
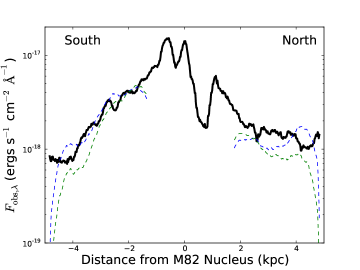
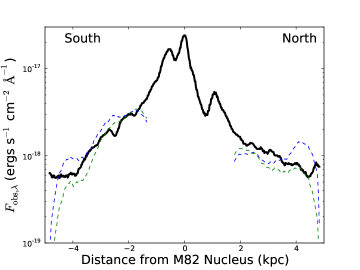
We measured the observed flux from the wind along a linear aperture perpendicular to the plane of M82 that extends 5 kpc north and south of (Jackson et al. 2007). At each point along the line, we then measured the flux within a circular aperture five GALEX pixels in radius (GALEX’s resolution is pixels). The average flux in each aperture and in each band was calculated and then corrected for Galactic extinction (; Schlegel et al. 1998) in the GALEX bands (Wyder et al. 2007). The resulting flux in both bands is (see Equation 6) and is shown as the solid lines in the two panels of Figure 5.
The simulation results for the two adopted geometries are plotted against our extraction aperture through the GALEX data in Figure 5. Aside from an overall normalization applied such that all curves intersect at 2 kpc south, we have not tried to fit the GALEX observations. These curves use the two assumed wind geometries (Figure 2) together with the Roussel et al. (2010) dust data (Figure 3). The overall difference in the flux between the northern and southern parts of the simulation results is due to the anisotropy in the scattering: the southern lobe of the wind is pointed towards us (), and the dust is forward-throwing in the UV.
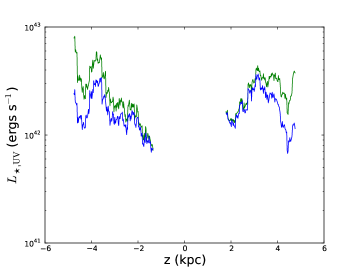
Combining our model geometries, scattering calculations (for ; see Section 2.2), and the Roussel et al. (2010) dust data then gives and (Equation 6), which we combine to give , the escaping luminosity in the GALEX bands, at each . We plot our inferred for each model geometry in Figure 6. Given the assumptions of our model, should be constant as a function of height since only one total UV flux escapes the starburst region and there is minimal absorption perpendicular to the disk outside of the starburst region. The fact that as calculated is not constant with indicates that our model fails to capture the true geometry of the dust distribution. In principle, one could use the constraint that constant to determine (or constrain) the true dust density distribution along the line of sight at every . A future work could iterate between the scattering calculations and the dust distribution using the joint constraints of , the Roussel et al. data, and constant to determine the true dust distribution.
For our purposes, it is sufficient to take the range of from the spherical and cylindrical geometries as a measure of our systematic errors and we find that ergs s-1, a factor of times larger than the total UV luminosity inferred by Hoopes et al. (2005) from our line of sight.
3.2. The UVNIR SED
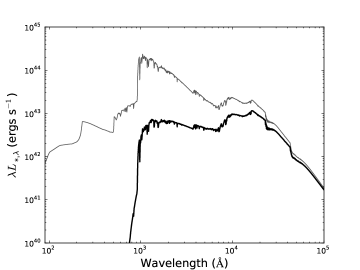
We next constrain the flux in the optical and NIR escaping perpendicular to the disk by comparing with the true unreddened GALEX band luminosities expected from the work of Förster Schreiber et al. (2003), who modeled the stellar population in the central starburst region from NIR spectroscopy (Förster Schreiber et al. 2001). We produced STARBURST99 models for instantaneous bursts of star formation corresponding to a combination of a 4 and 9 Myr-old starbursts with parameters given by Förster Schreiber et al. (2003): and for the combined bursts at the current epoch. We weight the STARBURST99 spectrum by the GALEX response curves for each band and calculate the GALEX FUV and NUV band luminosities of this fiducial, unextincted STARBURST99 model. As shown in Figure 7, the unreddened UV luminosity is ergs s-1. Our derived UV luminosities are much smaller ( ergs s-1; Figure 6), indicating that a significant fraction of the UV luminosity of the starburst is absorbed on small scales.
We model the absorption of the starburst UV flux using a simple foreground screen of dust. The natural logarithm of the ratio of our derived to the fiducial STARBURST99 GALEX band luminosity then yields . Since (or NUV, or combined UV) varies as a function of (Fig. 7; Section 3.1), we derive a different optical depth at every . We find that ranges from 1.6 to 4, with the larger values corresponding to the lower in Figure 7 and vice versa.
To determine the optical and NIR luminosities emerging from the starburst region, we use the extinction law from Calzetti et al. (1994) and adjust it to provide our calculated at 1516 Å, the effective wavelength of the FUV GALEX band. We then apply the Calzetti et al. law to our fiducial STARBURST99 SED, producing a reddened spectrum which we use for our Eddington ratio calculation. In Figure 7, we show an example of how this reddened spectrum compares to the fiducial SED for one choice of .
3.3. The Eddington Ratio
The Eddington ratio for the combined dust and gas wind fluid, integrated over an MRN distribution, the redenned STARBURST99 spectral model, and using a thin, uniformly bright disk for the geometry of the starburst and a spherically symmetric mass distribution for the disk and galaxy, is
| (8) |
where is the normalization of the MRN distribution (calculated via the method in Laor & Draine 1993), is the dynamical mass of M82 interior to , is the mass of a hydrogen atom, is the distance from the center of M82, is the radius of the starburst region, is the radius of a dust grain, is the slope of the grain size distribution, is the specific luminosity from Equation 6, is the absorption efficiency, the scattering efficiency, and the average of the cosine of the scattering angle. It should again be noted that is calculated at every above the plane in Figure 8 (Figure 6), even though if the wind is optically thin, should be constant as a function of height above the plane (Section 3.1). We also calculate for each and use this in correcting for the extinction in M82’s disk so that the SED varies as a function of distance from the disk (as illustrated in Figure 7). Although the variation in as a function of height is an artifact of our assumed dust geometries, it allows us to understand the range of systematic error in our calculation of .
In order to determine , we use the work of Greco et al. (2012) (GMT12), who measured the rotation curve of M82 on large scales. We assume circular orbits and a spherically symmetric mass distribution to determine . These assumptions break down within kpc due to the influence of the bar, as detailed in GMT12 (see also Westmoquette et al. 2007, 2009, 2012).
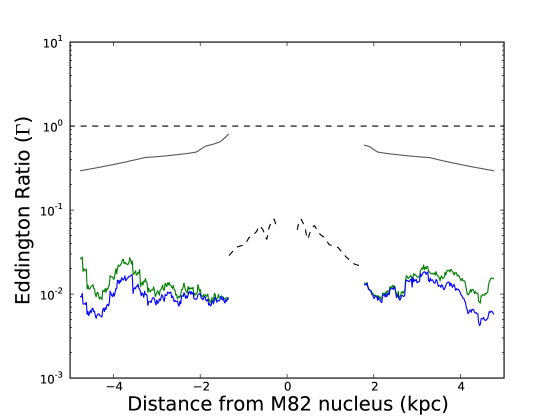
The solid colored lines in Figure 8 show our results for the Eddington ratio as a function of distance from the plane of M82 assuming a dust-to-gas ratio of . Factoring in our large uncertainties (Section 4), for our model geometries, indicating that radiation pressure does not presently drive the starburst wind on kpc scales. Note that if the dust and gas were not hydrodynamically coupled, the dust grains would be super-Eddington, with . We return to this issue in Section 5.
The Eddington ratio increases on smaller scales ( kpc) because decreases while likely stays roughly constant until is comparable to the starburst’s vertical scale height (Weiß et al. 2005). The dashed line in Figure 8 shows on small scales assuming the GMT12 rotation curve and a single value for ergs s-1. Section 5 gives more discussion of on small scales.
As seen in Equation 8, the functional form of depends heavily on the choice of grain size distribution and the optical properties of the grains. The radiation pressure cross section, , and the radiation pressure opacity, , are related by
| (9) |
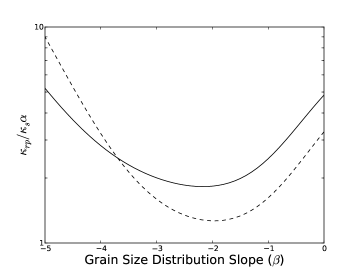
for spherical grains of radius , where is the number density of dust grains, is the dust mass density, and is per gram of dust. Since , and (see Equation 6), . As the slope of the grain size distribution steepens, grows; for an MRN distribution, and , while for , , as shown in Figure 9. For shallower grain size distributions, the opacity ratio changes by relatively small factors until the size distribution gets close to flat (Figure 9). Holding the dust-to-gas ratio fixed, changing the size distribution does not change the dust mass calculated by Roussel et al. (2010) by more than a few tens of percent. This is because the FIR opacity is insensitive to the power law form of the grain size distribution at fixed dust-to-gas ratio, changing by only a few tens of percent from to . This means that over a reasonable range of slopes, the Eddington ratio does not change by more than a factor of three, too small to affect our overall result.
4. Additional Uncertainties
There are two main sources of uncertainty in our estimate of the gravitational acceleration on the dust grains: the actual mass pulling on them, and the fact that the mass distribution is not perfectly spherically symmetric. The first is a relatively small uncertainty, as GMT12 determined the total dynamical mass of M82 within 4 kpc from the center to within about 10%. Treating M82 as a thin uniform disk with and radius 1 kpc instead of a sphere/point mass with the same mass reveals that the gravitational acceleration for the disk model is weaker by a factor of 1 kpc above the plane from simple Newtonian gravity calculations. Thus while the fact that M82’s potential well is not spherically symmetric can have a fairly large effect, and it implies a higher Eddington ratio, the effect is not large enough to affect our overall conclusions, since our fiducial estimate of is .
The radiation pressure force on the grains depends largely on two things: their scattering and absorption properties, and the flux incident on them. The biggest determinant of the first is our choice of grain size distribution. It is known that the MRN dust model used here does not reproduce the extinction curve towards, e.g., molecular clouds even in the Milky Way (see, for example, Weingartner & Draine 2001, Cardelli et al. 1989), or the extinction present in starbursts (Calzetti et al. 1994); M82 dust could have a different size distribution and composition as well. However, by the analysis in Section 3, this likely would not affect the answer by more than a factor of .
Our calculation of the flux incident on the grains is itself subject to several sources of uncertainty. As seen in Equation 6, it depends on the density of dust grains and their optical properties (). There are also three sources of reddening and extinction that go into calculating the flux: material in the disk of M82 and the starburst itself, extinction in the wind, and material in our own galaxy. We correct the last using the reddening corrections from Wyder et al. (2007), as described in Section 3. We assumed that the wind was optically thin; we showed that this was true for the portion of the wind we have dust density data for in Section 2.2. However, our results indicate that the starburst itself is optically thick in the UV (). This large uncertainty in introduces a similarly large uncertainty in .
We correct for this reddening using the Calzetti et al. (1994) extinction law, as described in Section 3. This correction increases by a factor of up to . However, the Calzetti et al. extinction law assumes the dust is in a foreground screen, while the results of Förster Schreiber et al. (2001) indicate that modeling the dust and stars as intermixed is a better description of the M82 starburst. In a series of comparisons between the shape of the emergent SED in the case of a foreground screen () and a mixed disribution of sources and absorbers (), we find that the Eddington ratio might change by a factor of at fixed .
For the source geometry, we model the starburst as a point source in our order of magnitude calculations and our Monte Carlo simulations. Past 1 kpc from the plane, this is a 5% effect at most, so the uncertainty introduced in is small compared to our other uncertainties. We also modeled the outer disk of M82 using STARBURST99 spectra as a 0.5 Gyr-old population of (Mayya et al. 2006). Even assuming no reddening or extinction between the starburst and the superwind, the outer disk in this model provides 1% of the flux illuminating the wind, and therefore does not contribute significantly to the Eddington ratio.
We also assume that the dust density is constant along the line of sight for a given . While this cannot be strictly true, this assumption does not have a large effect on our calculations. Although Equation 8 does contain through and Equation 6, from Equation 2 we see that the observed flux of scattered light depends on the observed dust column, which is taken from Roussel et al. (2010). Thus, the main factor that will change given is . We do not expect this change in to heavily affect our results.
In addition to the extraction aperture through the GALEX data we describe in this paper (Figure 1), we also examined two other extraction apertures through the wind, one centered a few tens of arcseconds northeast of our first one, and another centered a few tens of arcseconds southwest. We found that there was no difference in the overall conclusions; neither the dust densities nor the UV fluxes varied by more than a factor of two. Only the detailed shapes of the distributions changed.
5. Discussion and Conclusions
Our results indicate that even though the escaping UV luminosity is high compared to previous observations (Hoopes et al. 2005), the overall escape fraction of UV light is only . Given that the dust opacity continues to rise towards the Lyman edge (Draine 2003b), it follows that there must be a low escape fraction of ionizing photons, likely less than . This is consistent with results obtained by several other groups (see, e.g., Heckman et al. 2001, Bergvall et al. 2006, Grimes et al. 2009, Heckman et al. 2011, Leitherer et al. 1995). Heckman et al. (2001) found that galactic winds do not necessarily clear paths through the ISM for ionizing radiation to escape. It does not appear that M82’s superwind has cleared such a path.
In this work, we generally treated the dust and gas as separate, except when we calculated the final Eddington ratio using Equation 8. Ignoring magnetic fields and grain charging, which enhance dust-gas coupling, the scale over which grains of size are hydrodynamically coupled to the gas is (Draine & Salpeter 1979, Murray et al. 2005)
| (10) |
where , is the gas number density, and is the individual grain density. As shown by Figure 3, typical gas densities in the wind are , assuming a gas-to-dust ratio of 100, our model geometries for the dust density, and the Roussel et al. (2010) data. Thus, ranges from for grains, and for smaller grains. This means that the dust and gas are likely hydrodynamically coupled in the wind on large scales, and that the wind is sub-Eddington ( for kpc).
Although our work indicates that the M82 superwind is sub-Eddington on large scales, there is still the question of whether it is super-Eddington on small scales ( kpc). If an MRN dust model and the rest of our assumptions (see Section 3) are valid inside the region where we have dust density data from Roussel et al. (2010), then we can extend the Eddington ratio calculation inwards, given a determination of the enclosed dynamical mass. The rotation curve of GMT12 implies M⊙, but on these small scales their calculation is affected by the stellar bar in M82. Förster Schreiber et al. (2001) estimate M⊙ from molecular and ionized gas tracers, similar, but somewhat higher than a naive application of GMT12. Given these uncertainties, we estimate that for
| (11) |
where there are factor of uncertainties in both and . The dashed curve in Figure 8 shows an explicit calculation of on small scales assuming the GMT12 mass estimate and ergs s-1. Note that using the value of ergs s-1 (near the maximum in Figure 6) increases the dashed curve in Figure 8 by a factor of 3 at equivalent . Thus, this comparison indicates that the M82 superwind is currently sub-Eddington on kpc scales.
Another interesting possibility is that the superwind was super-Eddington in the past when the starburst was younger and brighter. The models of Förster Schreiber et al. (2003) indicate that the luminosity of the starburst was higher by about a factor of four roughly 6 Myr ago, for a bolometric luminosity of . Assuming a similar dust and gas distribution to today’s results in on large scales and on smaller scales. However, if the gas surface density within the starburst was higher at that earlier time, this would lower the flux-mean opacity in the outflow, decreasing throughout the wind.
Finally, we consider the current Eddington limit for the dusty gas within the starburst itself. In this case, the appropriate Eddington limit is the single-scattering limit discussed in Murray et al. (2005), Thompson et al. (2005), and Andrews & Thompson (2011). If all of the radiation is absorbed or scattered once, then the single-scattering Eddington flux is for a thin disk, where and are the stellar and gas surface densities. Scaling to parameters appropriate to M82’s nucleus, ,111Note that our use of is prima facie inconsistent with for the obscuring screen used to model the emergent SED in Section 3, since this UV optical depth would imply cm2 g-1 of gas. However, as discussed in Section 4 a mixed medium of sources and obscuration is more realistic, and implies , which is consistent with . where is the gas fraction, whereas the observed FIR flux of M82 is . Within the uncertainties, it remains plausible that M82’s nuclear starbust region currently exceeds the single-scattering Eddington limit, and may have significantly exceeded it 6 Myr ago, but clearly further work is required. Lastly, we note that many of the super star clusters in M82 exceed the single-scattering Eddington limit (Krumholz & Matzner 2009; Murray et al. 2010; Murray et al. 2011), and may thus be in part responsible for injecting gas into the hot outflow, or directly accelerating the gas to high velocities (Murray et al. 2011; but, see Krumholz & Thompson 2013).
6. Summary
We estimate the Eddington ratio for the dusty gas along the minor axis in the M82 superwind. We constrain the dust density distribution using Herschel SPIRE data and the dust mass map provided by Roussel et al. (2010), and we use Monte Carlo simulations to verify the applicability of the MRN dust distribution and both of our model geometries in our calculations by comparing the simulation results with archival GALEX images of M82. We find that the combined UV luminosity in the GALEX bands that illuminates the superwind of M82 is times higher than that found by Hoopes et al. (2005) from our line of sight.
We find that the dusty gas in the wind is highly sub-Eddington () on vertical scales along the minor axis kpc (Figure 8). On smaller scales, is more uncertain, but increases because of the decrease in the enclosed mass. We estimate at kpc, with large uncertainties, depending on the dynamical mass of the central region, the distribution of absorbing material along the minor axis, and the true UV luminosity that escapes the central starburst region (see Equation 11). Note that if the dust were hydrodynamically uncoupled from the gas, which appears unlikely, the grains would be super-Eddington throughout the wind. In addition, the starburst was brighter by approximately a factor of four Myr ago (Förster Schreiber et al. 2003), which in principle could to lead to as high as at kpc. Finally, within the starburst itself, we find that M82 appears to be close to the single-scattering Eddington limit, implying that a significant fraction of the current ISM could be ejected by radiation pressure.
Overall, our results provide quantitative constraints on theoretical models of superwinds launched wholly or in part by radiation pressure on dust in dwarf starbursts like M82 (e.g., Murray et al. 2011; Hopkins et al. 2012).
There are a number of directions for future work. Perhaps most importantly, one could simultaneously model the scattering in a number of wavebands from the FUV through the NIR, using the full frequency-dependent dust scattering phase function. By iterating with the observed surface brightness profiles in each band, a self-consistent model might be developed. Information could also be included on the MIR PAH surface brightness as a function of height. Such a study would constrain the dust geometry and grain size distribution more fully and perhaps allow for novel studies of the starburst population in reflection off the wind.
References
- Andrews & Thompson (2011) Andrews, B. H., & Thompson, T. A. 2011, ApJ, 727, 97
- Bergvall et al. (2006) Bergvall, N., Zackrisson, E., Andersson, B.-G., et al. 2006, A&A, 448, 513
- Cardelli et al. (1989) Cardelli, J. A., Clayton, G. C., & Mathis, J. S. 1989, ApJ, 345, 245
- Chevalier & Clegg (1985) Chevalier, R. A., & Clegg, A. W. 1985, Nat., 317, 44
- Davidge (2008) Davidge, T. J. 2008, AJ, 136, 2502
- Draine (2003a) Draine, B. T. 2003, ApJ, 598, 1017
- Draine (2003b) Draine, B. T. 2003, ARAA, 41, 241
- Draine & Salpeter (1979) Draine, B. T., & Salpeter, E. E. 1979, ApJ, 231, 77
- Förster Schreiber et al. (2001) Förster Schreiber, N. M., Genzel, R., Lutz, D., et al. 2001, ApJ, 552, 544
- Förster Schreiber et al. (2003) Förster Schreiber, N. M., Genzel, R., & Lutz, D. 2003, ApJ, 599, 193
- Freedman et al. (1994) Freedman, W. L., Hughes, S. M., Madore, B. F., et al. 1994, ApJ, 427, 628
- Gerke et al. (2011) Gerke, J. R., Kochanek, C. S., Prieto, J. L., et al. 2011, ApJ, 743, 176
- Greco et al. (2012) Greco, J. P., Martini, P., & Thompson, T. A. 2012, ApJ, 757, 24
- Grimes et al. (2009) Grimes, J. P., Heckman, T., Aloisi, A., et al. 2009, ApJS, 181, 272
- Heckman et al. (1990) Heckman, T. M., Armus, L., & Miley, G. K. 1990, ApJS, 74, 833
- Heckman et al. (2001) Heckman, T. M., Sembach, K. R., Meurer, G. R., et al. 2001, ApJ, 558, 56
- Heckman et al. (2011) Heckman, T. M., Borthakur, S., Overzier, R., et al. 2011, ApJ, 730, 5
- Hoopes et al. (2005) Hoopes, C. G., Heckman T. M., Strickland, D. K., et al. 2005, ApJ, 619, L99
- Hopkins et al. (2012) Hopkins, P. F., Quataert, E. & Murray, N. 2012, MNRAS, 421, 3522
- Jackson et al. (2007) Jackson, N., Battye, R. A., Browne, I. W. A., et al. 2007, MNRAS, 376, 371
- Krumholz & Matzner (2009) Krumholz, M. R., & Matzner, C. D. 2009, ApJ, 703, 1352
- Krumholz & Thompson (2013) Krumholz, M. R., & Thompson, T. A. 2013, arXiv:1302.4440
- Laor & Draine (1993) Laor, A. & Draine, B. T. 1993, ApJ, 402, 441
- Leitherer et al. (1995) Leitherer, C., Ferguson, H. C., Heckman, T. M., Lowenthal, J. D. 1995, ApJL, 454, L19
- Leitherer et al. (1999) Leitherer, C., Schaerer, D., Goldader, J. D., et al. 1999, ApJS, 123, 3
- Mathis et al. (1977) Mathis, J. S., Rumpl, W. & Nordsieck, K. H. 1977, ApJ, 217, 425M
- Mayya et al. (2006) Mayya, Y. D., Bressan, A., Carrasco, L., & Hernandez-Martinez, L. 2006, ApJ, 649, 172
- McKeith et al. (1993) McKeith, C. D., Castles, J., Greve, A., & Downes, D. 1993, A&A, 272, 98
- McLeod et al. (1993) McLeod, K. K., Rieke, G. H., Rieke, M. J., & Kelly, D. M. 1993, AJ, 412, 111
- Murray et al. (2011) Murray, N., Ménard, B., & Thompson, T. A. 2011, ApJ, 735, 66
- Murray et al. (2005) Murray, N., Quataert, E., & Thompson, T. A. 2005, ApJ, 618, 569
- Roussel et al. (2010) Roussel, H., Wilson, C. D., Vigroux, L., et al. 2010, A&A, 518, L66
- Sanders et al. (2003) Sanders, D. B., Mazzarella, J. M., Kim, D.-C., et al. 2003, AJ, 126, 1607
- Schlegel et al. (1998) Schlegel, D. J., Finkbeiner, D. P., & Davis, M. 1998, ApJ, 500, 525
- Shapiro et al. (2004) Shapiro, P. R., Iliev, I. T., & Raga, A. C. 2004, MNRAS, 348, 753
- Silva et al. (1998) Silva, L., Granato, G. L., Bressan, A., et al. 1998, ApJ, 509, 103
- Socrates & Sironi (2013) Socrates, A. & Sironi, L. 2013, arXiv:1302.2148
- Thompson et al. (2005) Thompson, T. A., Quataert, E., & Murray, N. 2005, ApJ, 630, 167
- Weingartner & Draine (2001) Weingartner, J. C., & Draine, B. T. 2001, ApJ, 548, 296
- Weißet al. (2005) Weiß, A., Walter, F., & Scoville, N. Z. 2005, A&A, 438, 533
- Westmoquette et al. (2007) Westmoquette, M. S., Smith, L. J., Gallagher, J. S., III, et al. 2007, ApJ, 671, 358
- Westmoquette et al. (2009) Westmoquette, M. S., Smith, L. J., Gallagher, J. S., III, et al. 2009, ApJ, 696, 192
- Westmoquette et al. (2012) Westmoquette, M. S., Smith, L. J., Gallagher, J. S., & Walter, F. 2013, MNRAS, 428, 1743
- Wood et al. (2001) Wood, K., Whitney, B., Bjorkman, J., & Wolff, M. 2001, Introduction to Monte Carlo Radiation Transfer, (St Andrews: University of St Andrews), http://www-star.st-and.ac.uk/ kw25/research/montecarlo/book.pdf
- Wyder et al. (2007) Wyder, T. K., Martin, D. C., Schiminovich, D., et al. 2007, ApJS, 173, 293
- Zhang & Thompson (2012) Zhang, D., & Thompson, T. A. 2012, MNRAS, 424, 1170