Coarse-graining the calcium dynamics on a stochastic reaction-diffusion lattice model
Abstract
We develop a coarse grained (CG) approach for efficiently simulating calcium dynamics in the endoplasmic reticulum membrane based on a fine stochastic lattice gas model. By grouping neighboring microscopic sites together into CG cells and deriving CG reaction rates using local mean field approximation, we perform CG kinetic Monte Carlo (kMC) simulations and find the results of CG-kMC simulations are in excellent agreement with that of the microscopic ones. Strikingly, there is an appropriate range of coarse proportion , corresponding to the minimal deviation of the phase transition point compared to the microscopic one. For fixed , the critical point increases monotonously as the system size increases, especially, there exists scaling law between the deviations of the phase transition point and the system size. Moreover, the CG approach provides significantly faster Monte Carlo simulations which are easy to implement and are directly related to the microscopics, so that one can study the system size effects at the cost of reasonable computational time.
pacs:
87.16.A-, 05.50.+q, 82.20.-w, 05.10.-aI Introduction
As a second messenger in living cells, calcium ions () play a vital role in providing the intracellular signaling. Many important cellular processes and biological function, such as muscle contraction and synaptic transmission, are regulated by signals Berridge et al. (1998); Thomas et al. (1996); Abramson et al. (1995); Jaggar et al. (2000). release is an inherently multi-scale problem, for instance, in cardiac myocytes, the majority of the control of calcium-induced-calcium-release (CICR) Stern (1992); Bers (1993) happens in the microdomain of the so-called diadic cleft, this microdomain is between the L-type voltage-gated channels and the ryanodine receptors. The ryanodine receptors ‘sense’ local [] in the diadic cleft positioned between the t-tubules and the sarcoplasmic reticulum. The length scale of aforementioned occurrences is on the order of nanometers and relevant time scales range from micro- to milliseconds Winslow et al. (2006). However, each cell contains approximately 10,000 diadic spaces which act independently Hinch et al. (2006). Typically, one is interested in currents at the whole cell level and higher. This is a multi-scale problem. Given the limits of computational power, hardly can we model an entire cellular cytoplasm by incorporating detailed structural information.
Some multi-scale models of CICR have been developed that successfully reproduced experimental observations, as well as save computation largely Winslow et al. (2006); Hinch et al. (2006); Higgins et al. (2007). However, these models are based upon deterministic coupled ordinary differential equations derived from biophysical mechanisms Hinch et al. (2004), and lack accurate description of microscopic dynamics of calcium ion channels. In fact, fluctuations are always exist in ion channels and play a crucial role in release mechanism Bär et al. (2000); Shuai and Jung (2003). Recently, Vlachos and coworkers proposed a multiscale approach for coarse graining stochastic processes and associated Monte Carlo (MC) simulations in surface reaction systems Katsoulakis and Vlachos (2003); Katsoulakis et al. (2003a, b). The method is efficient in describing much larger length scales than conventional MC simulations while still incorporating microscopic details, and resulting in significant computational savings. An overview of the method is given in Chatterjee and Vlachos (2007).
In the present work, the multiscale approach was applied to a relatively simple stochastic reaction-diffusion lattice model for calcium dynamics in the endoplasmic reticulum (ER) membrane, proposed by Guisoni Guisoni and de Oliveira (2005, 2006). We coarse grain the model and processes, and derive the coarse-grained (CG) surface diffusion transition probability rates. By numerical simulations, it is found that the results of CG kinetic MC (kMC) simulations are in excellent agreement with that of the microscopic ones corresponding to the optimal coarse proportion. Secondly, we study the system size effects by fixing the coarse proportion, and find the phase transition point increases monotonously as the system size increases. Especially, there exists a scaling law between the deviations of the phase transition point and the system size. Finally, we investigate CPU time and find the approach provides significantly faster MC simulations which are easy to implement and are directly related to the microscopic one.
II Coarse-graining the lattice model
Microscopic Model –- We consider a two-dimensional square lattice with two interpenetrating sublattices A and B Guisoni and de Oliveira (2005, 2006) in ER membrane, as shown in Fig. 1. Calcium channels are located only on the sites of the sublattice B and calcium ions occupy not only the sites of the sublattice A but also the sites of the sublattice B. A site of the sublattice A can either be empty or occupied by at most one calcium ion, the sublattice B take the values , or corresponding to the closed, activating(open) and inhibiting state respectively.
The dynamics of calcium ions in the model exhibit three stages. In the first, spontaneous annihilation. If the site of the A sublattice is occupied then it becomes empty with probability , here, , related to the diffusion probability, , related to the annihilation process. In the second, diffusion. One of the four nearest neighbor of site of the A sublattice, say site of sublattice B, is chosen at random. A calcium ion then hops from a site of one sublattice to a site of the other sublattice with probability . In the third, Catalytic creation. One of the four nearest neighbor of site of the A sublattice, say site of sublattice B, is chosen at random. If calcium channel is open then a calcium ion is created at site with probability .
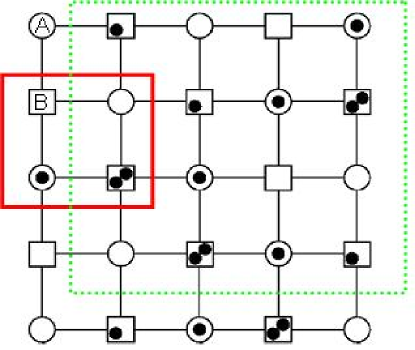
Coarse-Graining process –- In the paper, neighboring microscopic sites are grouped together into a CG cell, one can obtain a CG-lattice model with coarse cells. Fig. 1 shows an example of a coarse-graining lattice model with and , denoted by solid square and dotted square respectively, here, is even because of two kind of sublattice A and B.
We define CG variables
| (1) |
Here, microscopic variable and denote the number of calcium ions at the A and B respectively, and satisfies the constraint , , since each coarse cell contains microcells. Equivalently we may also consider the averaged version (termed below as coverage), . The dynamics of calcium ions on the CG model has also three processes: a. Spontaneous annihilation. b. Diffusion. c. Catalytic creation. The table 1 gives summary of processes and transition probability rates for CG-kMC.
| Process | Change of coarse variables | Coarse transition probability rate | ||
| Annihilation | ||||
| Diffusion | ||||
| Creation | ||||
III Results and discussion
Given a microscopic initial condition at random, following the aforementioned rules in table 1, the coarse-grained calcium dynamics is computed with periodic boundary conditions. But it needs to make the computational demand of CG-kMC simulations per event the same as that of microscopic MC ones.
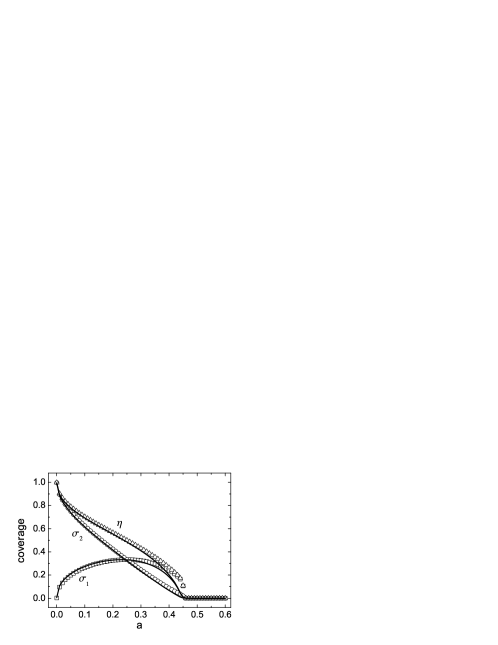
We perform CG-kMC simulations and microscopic simulations on a square lattice with sites, and plot the coverage as a function of the parameter in Fig. 2, where, denotes the density of open channels on sublattice B, denotes the density of inhibited channels on sublattice B, and denotes calcium ions on sublattice A. Firstly we notice that the coverage predicted from the CG-kMC simulations is in reasonably agreement with that of the microscopic MC ones. Excitedly, the CG-kMC predicts the phase transition point is in good agreement with that of microscopic MC simulations. Indeed, small quantitative differences near the critical point also exist, probably due in part to the fluctuation, but still relatively small. These findings validate the CG approach works well in simulating calcium dynamics.
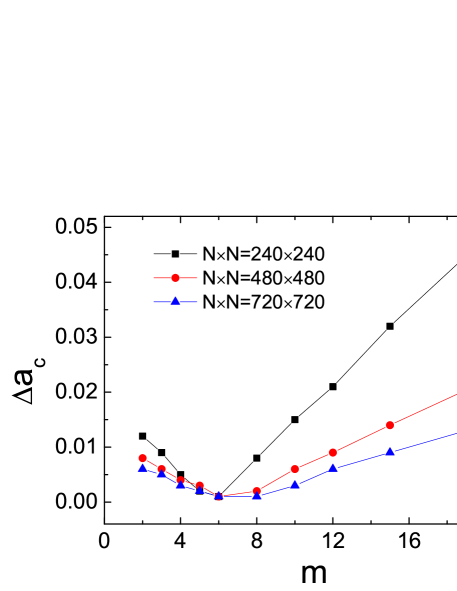
To detect the phase transition point accurately, we need to choose appropriate size of coarse cell. But what a suitable is ? We define a coarse proportion , , namely, the square root of the number of coarse cells. Changing we plot the deviation of the phase transition points between CG-kMC and microscopic simulations for different system size , as shown in Fig. 3. It can be seen that begin to decrease and then increase with the increment of , especially, the minimal occurs near the same point for different . When , there are two values of corresponding to the minimal deviation, seeming to a small plain appears. Furthermore, the larger system size, the less deviation is. It is obvious that, there exists an appropriate range of for coarse graining the system precisely. Therefore we can fix and investigate the effects of system size on the phase transition point.
For fixed , we plot the critical point as the function of system size in Fig. 4. Apparently, increases monotonously as increases, and approaches to . Theoretically speaking, this asymptotic value corresponds to the critical point of mean field (MF). The inset gives the scaling relation of the deviations and the system size, the scaling exponent is . To elucidate its accuracy, we have also carried out coarse grained simulations with (not shown here), and obtained a similar asymptote and power law. Therefore, we can analyze the effects of the system size on the phase transition point according to the scaling law and detect the critical point accurately and rapidly.

Finally, we exhibit the significant computational savings resulting from coarse-graining, as shown in Fig. 5. It can be seen that CPU time decreases monotonously as the size of coarse cell increases. The larger size of coarse cell, the fewer CPU times. In this way, we can choose a bigger to save computational time. In fact, the computer time in kMC simulation with global update, i.e., searching the entire lattice to identify the chosen site, scales approximately as O(), but O() in CG-kMC simulation. Accordingly, a -fold reduction in the number of sites results in reduced computer time by a factor of 1/. Therefore, coarse-graining can render MC simulation for the large scales feasible.

IV Conclusion
In this paper, we proposed an extensive CG model that can properly describe calcium dynamics on ER membrane. By a great deal of computer simulations, we demonstrated our model is highly effective because the results of CG-kMC simulations are in very good agreement with that of MC ones for a wide range of model parameters. Interestingly, it was shown that there exists an appropriate range of coarse proportion , corresponding to the best estimation on the phase transition point compared to the microscopic counterpart, and such is almost insensitive to the change of the system size. This make it possible to select an without beforehand unwanted simulations for any real-world system size. Moreover, The CG-kMC method provides significant reduction in CPU while retaining very good accuracy in estimating the phase transition point. The larger the level of coarse-graining is, the larger computational savings are, therefore we can obtain the phase transition point quickly. Using the CG model, we also found that the critical point increases monotonously as the system size increases. Especially, there exists a scaling relation between the deviations of the phase transition point and the system size. A major advantage of the coarse model is that they have a direct connection to the microscopic dynamics and can provide valuable insights. Due to its reasonable accuracy and low computational requirements, we anticipate that the methods outlined in this work for simple systems will find widespread use in many realistic systems.
Acknowledgements.
This work was supported by the National Natural Science Foundation of China (Grant No. 11205002). C.S.S. was also supported by the Key Scientific Research Fund of Anhui Provincial Education Department (Grant No.KJ2012A189).References
- Berridge et al. (1998) M. J. Berridge, M. D. Bootman, and P. Lipp, Nature 395, 645 (1998).
- Thomas et al. (1996) A. P. Thomas, G. S. J. Bird, G. Hajnóczky, L. D. Robb-Gaspers, and J. W. Putney, Faseb J. 10, 1505 (1996).
- Abramson et al. (1995) J. J. Abramson, A. C. Zable, T. G. Favero, and G. Salama, J. Biol. Chem. 270, 29644 (1995).
- Jaggar et al. (2000) J. H. Jaggar, V. A. Porter, W. J. Lederer, and M. T. Nelson, Am. J. Physiol. Cell Physiol. 278, C235 (2000).
- Stern (1992) M. D. Stern, Biophys. J. 63, 497 (1992).
- Bers (1993) D. M. Bers, Excitation-Contraction Coupling and Cardiac Contractile Force, 2rd edn., Boston: Kluwer Academic Publishers, 215 (2001).
- Winslow et al. (2006) R. L. Winslow, A. Tanskanen, M. Chen, and J. L. Greenstein, Ann. N.Y. Acad. Sci. 1080, 362 (2006).
- Hinch et al. (2006) R. Hinch, J. Greenstein, and R. Winslow, Prog. Biophys. Mol. Biol. 90, 136 (2006).
- Higgins et al. (2007) E. R. Higgins, P. Goel, J. L. Puglisi, D. M. Bers, M. Cannell, and J. Sneyd, J. Theor. Biol. 247, 623 (2007).
- Hinch et al. (2004) R. Hinch, J. L. Greenstein, A. J. Tanskanen, L. Xu, and R. Winslow, Biophys. J. 87, 3723 (2004).
- Bär et al. (2000) M. Bär, M. Falcke, H. Levine, and L. S. Tsimring, Phys. Rev. Lett. 84, 5664 (2000).
- Shuai and Jung (2003) J. W. Shuai and P. Jung, Proc. Natl. Acad. Sci. USA 100, 506 (2003).
- Katsoulakis and Vlachos (2003) M. A. Katsoulakis and D. G. Vlachos, J. Chem. Phys. 119, 9412 (2003).
- Katsoulakis et al. (2003a) M. A. Katsoulakis, A. J. Majda, and D. G. Vlachos, Proc. Natl. Acad. Sci. USA 100, 782 (2003a).
- Katsoulakis et al. (2003b) M. A. Katsoulakis, A. J. Majda, and D. G. Vlachos, J. Comp. Phys. 186, 250 (2003b).
- Chatterjee and Vlachos (2007) A. Chatterjee and D. G. Vlachos, J. Comput.-Aided Mater. Des. 14, 253 (2007).
- Guisoni and de Oliveira (2005) N. Guisoni and M. J. de Oliveira, Phys. Rev. E 71, 061910 (2005).
- Guisoni and de Oliveira (2006) N. Guisoni and M. J. de Oliveira, Phys. Rev. E 74, 061905 (2006).