Multiwavelength interferometric observations and modeling of circumstellar disks††thanks: Based on observations made with telescopes of the European Organisation for Astronomical Research in the southern Hemisphere (ESO) at the Paranal Observatory, Chile, under the programs 073.A-9014, 075.C-0014, 075.C-0064, 075.C-0253, 077.C-0750, 079.C-0101, and 079.C-0595.
Abstract
Aims. We investigate the structure of the innermost region of three circumstellar disks around pre-main sequence stars HD 142666, AS 205 N, and AS 205 S. We determine the inner radii of the dust disks and, in particular, search for transition objects where dust has been depleted and inner disk gaps have formed at radii of a few tenths of AU up to several AU.
Methods. We performed interferometric observations with IOTA, AMBER, and MIDI in the infrared wavelength ranges and with projected baseline lengths between and . The data analysis was based on radiative transfer simulations in 3D models of young stellar objects (YSOs) to reproduce the spectral energy distribution and the interferometric visibilities simultaneously. Accretion effects and disk gaps could be considered in the modeling approach. Results from previous studies restricted the parameter space.
Results. The objects of this study were spatially resolved in the infrared wavelength range using the interferometers. Based on these observations, a disk gap could be found for the source HD 142666 that classifies it as transition object. There is a disk hole up to a radius of and a (dust-free) ring between and in the disk of HD 142666. The classification of AS 205 as a system of classical T Tauri stars could be confirmed using the canonical model approach, i.e., there are no hints of disk gaps in our observations.
Key Words.:
Infrared: stars – Accretion disks – Planetary systems: protoplanetary disks – Instrumentation: interferometer – Radiative transfer – Stars: individual: HD 142666, AS 205 N, AS 205 S1 Introduction
Observations of the innermost region of circumstellar disks, i.e., at a distance of a few tenths of AU from the central star, are motivated by the outcomes of theoretical investigations that predict planet formation there. The ambient conditions in this region, such as high direct stellar radiation, high dust particle densities, and long-lived vortices, can favor planet formation (Klahr & Bodenheimer klahr (2003); Wünsch et al. wuensch (2005); Johansen et al. johansen (2007)). Close to the star, the dust temperature reaches values up to the sublimation temperature of resulting in near-infrared (NIR) and mid-infrared (MIR) radiation excess. First, highly resolved, i.e., interferometric observations of YSOs in the NIR wavelength range (Millan-Gabet et al. millan-gabet (2001)) and the subsequent successful modeling of these measurements using simple rings have motivated the idea of a compact, potentially puffed-up rim at the inner dust disk (Dullemond et al. dullemondIII (2001)) where dust at the inner edge of the disk is strongly heated by direct stellar irradiation. However, further interferometric measurements have suggested a more complex disk model where accretion and/or an optically thin envelope close to the inner edge are additionally implemented (Schegerer et al. schegerer (2008)).
The viscous evolution of the disk, i.e., accretion and spreading (Lynden-Bell & Pringle lynden (1974); Hartmann et al. hartmann (1998); Armitage et al. armitage (1999)), photoevaporation (Hollenbach et al. hollenbach (1994); Clarke et al. clarke (2001); Alexander et al. 2006a ; Alexander et al. 2006b ), dust evolution (Monnier & Millan-Gabet monnier (2002)), and planet formation (Youdin & Shu youdin (2002)) strongly affect the inner disk structure. The inner dust disk radius is initially determined by the sublimation temperature of dust in the case of disks with ages up to several million years. For T Tauri stars, the primary inner disk radius is in the range of . But if the viscous accretion inflow rate falls below the photoevaporation rate, the dust density strongly reduces in the inner disk regions where the inner disk radius can increase or a nearly dust-free inner ring can form on a time scale of years (Clarke et al. clarke (2001); see Dullemond et al. dullemondII (2006) for a review). Tidal forces, which can be caused by a stellar companion or a newly formed planet, can accelerate the formation of disk gaps (Bouwman et al. bouwmanIV (2006); Bryden et al. bryden (1999)). Spectrophotometric measurements of YSOs show a strong decrease in infrared radiative excess with age (Haisch et al. haisch (2001); Carpenter et al. carpenter (2005); Sicilia-Aguilar et al. sic06 (2006); Sicilia-Aguilar et al. sic09 (2009)) which is assumed to be caused by the depletion of small dust particles (Weinberger et al. weinberger (1999); Grady et al. grady (2001)). Classical T Tauri stars (CTTS) usually fulfill the photometric conditions and (Kenyon & Hartmann kenyon (1995)). But there are some YSOs where and . McCabe et al. (cabe (2003)) assume that the latter color relation could be a hint of a transition disk object (TO) where an inner disk gap has been formed. To derive further indicators for the classification of YSOs as CTTS and TO, various infrared color relations of huge samples of pre-main sequence stars from different star-forming regions have been studied (e.g., Sicilia-Aguilar et al. sic06 (2006); Sicilia-Aguilar et al. sic09 (2009)). These studies conclude that objects with no significant infrared excess at (but with excess at longer wavelengths) can be classified as TO. However, as pointed out by Ercolano et al. (ercolano (2009)), the missing excess in the NIR wavelength range is a necessary but not sufficient condition for a TO, for late-type stars in particular.
Observations that spatially resolve the inner disk region can directly identify a TO. In fact, Brown et al. (brown (2008)) spatially resolved a radius inner gap in the circumstellar disk around LkH$α $330 in the far-infrared (FIR) wavelength range with the Submillimeter Array. There are more spatially resolved observations of correspondingly large gaps in circumstellar disks (e.g., Guilloteau et al. guilloteau (2008); Sauter et al. sauter (2009)). However, the spatial resolution of the innermost disk region, where the formation of disk gaps is assumed to start, is possible by interferometric observations in the MIR and NIR wavelength range. Considering the spectral energy distribution (SED) and interferometric observations in the MIR wavelength range, Ratzka et al. (ratzkaIII (2007)) found a depletion of the innermost disk regions from warm dust grains, i.e., an increase in the inner disk radius of the TO TW Hya, which supplements the model of Calvet et al. (calvet (2002)). Akeson et al. (akeson (2011)) have recently presented a three-component model of this transition object.
In this study, we present high-resolution interferometric, multiwavelength observations of three YSOs using the Infrared Optical Telescope Array (IOTA), the Astronomical Multi-BEam combineR (AMBER), and the MID-infrared Interferometer instrument (MIDI). The interferometric visibilities that were obtained from these observations allow study of the spatial distribution of dust with temperatures between several (MIDI) and (IOTA, AMBER) supposedly at the innermost regions of protoplanetary disks. In Sect. 2, we describe our interferometric observations and the subsequent data reduction. Computer models of YSOs where the Monte Carlo method is used can explain the observations (Sect. 3). We additionally consider previous studies concerning stellar and accretion parameters, as well as photometric measurements, to get a coherent model of the YSOs. The results of our interferometric observations and modeling efforts are presented in Sect. 4. The uniqueness of our results is discussed in more detail in Sect. 5. There, we also discuss a more advanced modeling approach. We conclude the study in Sect. 6.
2 Interferometric observations and data reduction
| Object | SpTyp | Age | |||||||
|---|---|---|---|---|---|---|---|---|---|
| (h m s) | (∘ ′ ″) | (pc) | (mag) | (M⊙) | (K) | (L⊙) | (Myr) | ||
| HD142666 | A III(10) | ||||||||
| AS 205 N | K | ||||||||
| AS 205 S | M |
References: 1: 2 MASS catalog (Cutri et al. cutri (2003)); 2: Prato et al. (prato (2003)); 3: Eisner et al. (eisnerII (2005)); 4: FEPS data base; 5: Pottasch & Parthasarathy (pottasch (1988)); 6: Houk et al. (houk (1988)); 7: Valenti & Fischer (valenti (2005)); 8: Sylvester et al. (sylvester (1996)); 9: Garcia-Lopez et al. (garcia-lopez (2006)); 10: Blondel et al. (blondel (2006)); 11: van Boekel et al. (boekelII (2005)); 12: Liu et al. (liu (1996))
2.1 Object sample
The objects of our study are HD 142666 and AS 205 which belong to the Ophiuchi star formation region. Selected object parameters known from literature are compiled in Table 1 and in Appendix A. Considering the spectral type, the A III source HD 142666 is a Herbig Ae/Be object while the other two sources are T Tauri objects. HD 142666 is assumed not to have any stellar companion (e.g., Fukagawa et al. fukagawa (2010)). Considering our interferometric measurements, a sinusoidal visibility spectrum could not be found that would be characteristic of a close (stellar) companion in both systems. AS 205 is a triple system (Eisner et al. eisnerII (2005); Koresko et al. koresko (1997)). In this study, we also present the interferometric observation of the main southern (S) companion of AS 205.111Note: For the 2 MASS catalog, AS 205 S is the main component.
2.2 Observations with IOTA
IOTA at the Smithsonian F. L. Whipple Observatory on Mount Hopkins, Arizona, belonged to the first Michelson interferometers observing in the NIR wavelength range (Carleton et al. carleton (1994); Traub traub (1998); Traub traubII (2003)) and was operated until 2006 (Schloerb et al. schloerb (2006)). IOTA consisted of three -Cassegrain telescopes that could be shifted on an L-shaped -track, allowing a flexible modification of the baseline lengths. An angular resolution of five milli-arcseconds (mas) at a maximum baseline length of could theoretically be reached with IOTA. Not only the visibilities and the corresponding differential phases, but also the closure phase could be measured with IOTA. The closure phase, unaffected by atmopheric effects, is a prerequisite for determining asymmetries in the measured brightness distribution, so essential for image reconstruction (e.g., Jennison jennison (1958); Leinert leinertII (1992)). However, numerous interferometric observations are necessary for an acceptable image (Kraus et al. kraus (2005)). Therefore, the closure phase is not discussed any further in this study.
Atmospheric effects were compensated by a piezo-actuated tip-tilt tertiary mirror. After the compensation of the optical path difference by a sequence of light reflections in an evacuated tank, two beams were combined using the IONIC 3 Beam Combiner (Berger et al. berger (2003)). A single exposure consisted of to readouts in four minutes. Photometric measurements and exposures of dark current concluded the observation sequence. The observation of a main-sequence star with known diameter (calibrator) before and after the observation sequence allowed the determination of the modulation transfer function () of the interferometer by linear interpolation. Also, atmospheric and instrumental background were eliminated by the calibration measurements.
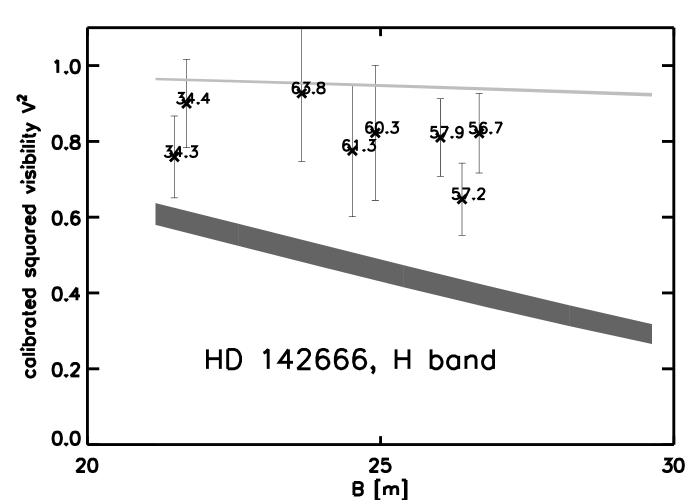
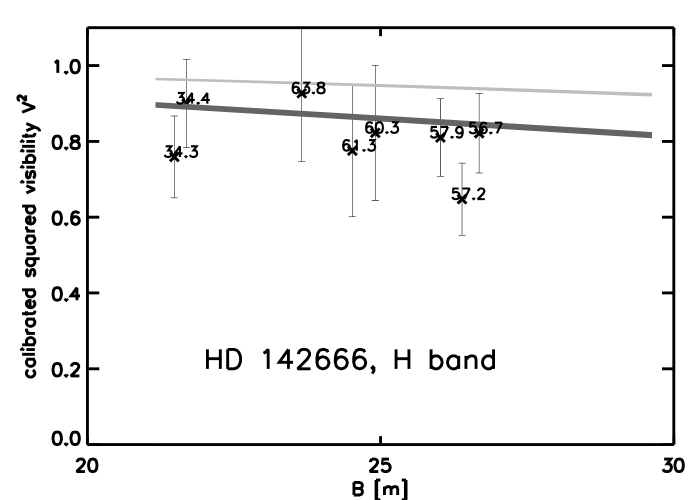
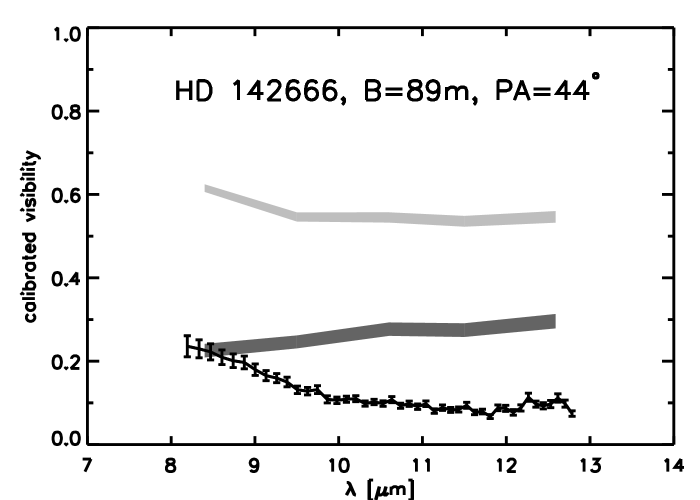
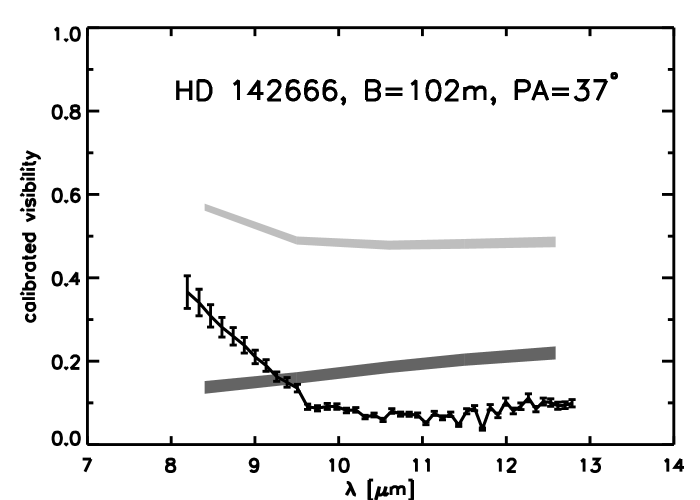
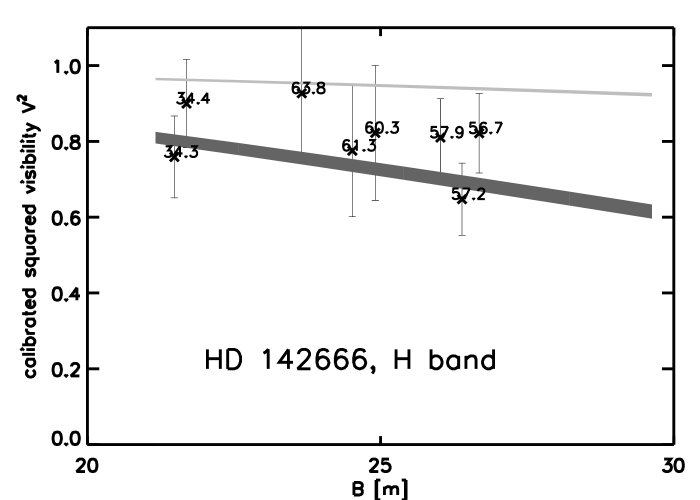
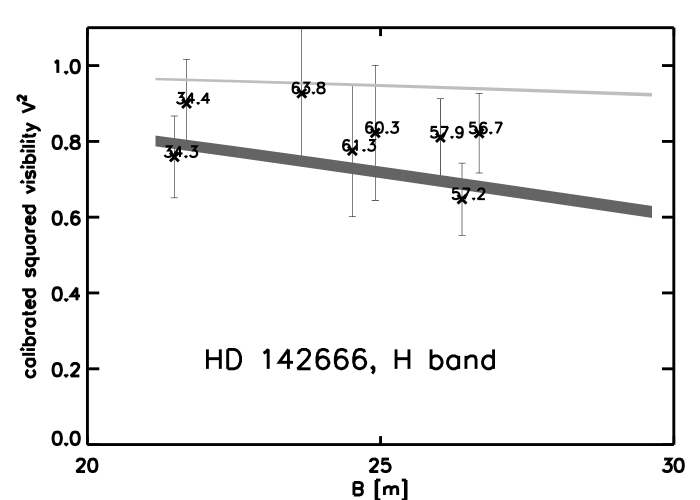
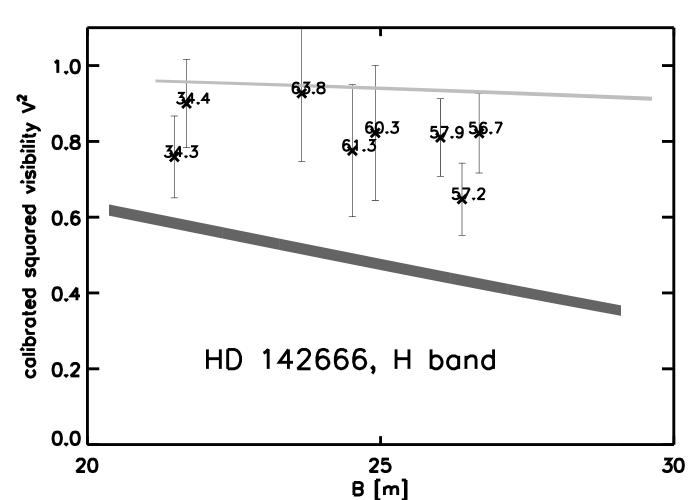
In June 2006, the bright YSO HD 142666 could be observed with IOTA at a maximum projected baseline length of . The H band visibility within the wavelength interval of was measured. For data calibration, we observed the main-sequence stars HD 134758, HD 143033, and HD 139663 with the uniform disk (UD) diameters , , and , respectively, in H band (Merand et al. merand (2005); Bordé et al. borde (2002)). The projected baseline lengths as well as the position angles during our interferometric observations with IOTA are listed in Table 2. The visibilities are shown in Fig. 1.
| Date of | proj. Baseline | Flags | |
|---|---|---|---|
| observation | (m) | (deg) | |
| 05-06-2006 | 25/20/11 | 60/34/-66 | r/u/u |
| 05-06-2006 | 25/20/11 | 61/34/-65 | r/u/u |
| 05-06-2006 | 24/19/12 | 64/34/-63 | r/u/u |
| 08-06-2006 | 29/23/10 | 54/35/-80 | u/u/u |
| 08-06-2006 | 29/23/10 | 54/35/-79 | u/u/u |
| 08-06-2006 | 28/23/10 | 54/35/-78 | u/u/u |
| 08-06-2006 | 28/22/10 | 55/35/-76 | u/u/u |
| 09-06-2006 | 27/22/11 | 57/34/-72 | r/r/u |
| 09-06-2006 | 26/21/11 | 57/34/-71 | r/r/u |
| 09-06-2006 | 26/21/11 | 58/34/-70 | r/u/u |
Observations that are specified with the flags r and u are spatially resolved/unresolved, respectively. Measurements are assumed to be unresolved if the visibility plus standard error is greater than 1.
The IOTA Data Reduction Software (IDRS) was used. It offers two alternative methods of determining the visibility (IDRS v0.7 and v0.8; Kraus et al. kraus (2005)). A first approach uses the linear relation between the measured power spectrum and the visibility (Jackson jackson (1983)). In this standard approach, data sets with low signal-to-noise ratios can be added easily. Gaussian-shaped, narrow signal profiles in the power spectrum result from data sets with low noise. Fitting linear functions to the tails of the Gaussian-shaped profiles allows background noise to be subtracted. Furthermore, a lower and an upper limit are defined to eliminate noise with low and high spatial frequencies. The signal profiles that were measured in this study are broad as a result of a low signal-to-noise ratio. Therefore, the error bars of the visibilities that we obtained for HD 142666 with IOTA are high.
Another approach is based on the continous wavelet transform (CWT). It results from a convolution of the interference signal with a Morlet function from which the power spectrum can be determined. Atmospheric perturbances, instrumental vibrations, as well as background noise, can effectively be eliminated with the CWT method (Kraus et al. kraus (2005)), in particular for data sets of faint objects. The CWT was used to confirm the results obtained from the standard method described above.
2.3 Observations with AMBER
The system AS 205 was observed with AMBER (Petrov et al. petrov (2005); see Table 3), and it operates at the Very Large Telescope Interferometer (VLTI). The combination of three telescopes with AMBER allows the closure phase to be determined. Analogous to our measurements with IOTA, the closure phase is not discussed further in this study. In contrast to observations with IOTA, AMBER allows the observations to be spectrally resolved in H and K band (m).
For our observations with AMBER, we used the Unit Telescopes UT 2, UT 3, and UT 4. This telescope combination not only includes two almost perpendicular baselines, but also offers an appropriate angular resolution. The baseline UT 2-UT 4 reached a baseline length of , which corresponds to a resolution of 1.9 mas at a wavelength of 1.6 m corresponding to and at the distance of the sources HD 142666 and AS 205, respectively. Correspondingly, the angular resolution of the shortest baseline UT2-UT3 with a maximum baseline length of 47 m reaches 3.5 mas, which corresponds to and . The resolution of AMBER on this baseline is thus a factor 2-3 higher than the resolution that can be reached by MIDI in the MIR wavelength range with the longest baseline used (see Sect. 2.4). This allowed us to continuously trace the circumstellar disks from the hot inner regions to the warm parts at distances of several AU from the central star. We chose the low-resolution prism mode with a spectral resolving power of , which is similar to the resolving power provided by MIDI in prism mode, and it allows good spectral coverage. For the observation of the weak source AS 205 S, only measurements in K band were possible, since IRIS (VLTI InfraRed Image Sensor; Gitton et al. gitton (2004)) was operated in the H band to stabilize the beams.
Observations with AMBER start with exposures that are used for the wavelength calibration and the calibration of the offsets between the interferometric and the photometric channels. In a second step, the so-called pixel-to-visibility matrix is determined. This matrix is the between visibility and measured interferogram , i.e.,
| (1) |
The quantity represents here the interferogram measured on the detector after the total flux is subtracted. The total flux is obtained from the photometric channels. The scientific measurements with AMBER consist of several thousands of exposures. A single exposure takes ms. For a calibrated visibility, a standard star with known diameter, i.e., with known visibility is observed. Standard stars were chosen from the CalVin list222www.eso.org/instruments/amber/tools/. We used the standard stars HD 143033 and HD 143900 with the UD diameters and , respectively. Additional measurements are necessary for determining of the detector background and the sky background.
The AMBER Data Reduction Software amdlib v3.0.3 was used to reduce the data.333www.jmmc.fr/data_processing_amber.htm This recent release of the software is based on a new algorithm with an improved data and noise model (Chelli et al. chelli (2009)). The standard procedure described in the user manual was followed. For the frame selection, the following criteria were chosen. The piston, i.e., the mean optical path length difference of the incoming wavefronts, was limited to (Hummel hummel (2008)). Furthermore, only 20% of the frames with the highest signal-to-noise ratio were taken into account to avoid degrading the fringe signal. This percentage is slightly more constraining than the value used in different previous studies using AMBER (e.g., Weigelt et al. weigelt (2007)).
Subsamples of the data from several thousand single exposure frames were created by comparing the resulting visibilities with those derived from the complete data sets. Obvious outliers in the subsample set were discarded. If the overall data quality is low, the selection of the highest signal-to-noise ratios could lead to significantly different results for the complete data set and the subsamples were finally selected as different frames. During our observations, a second calibrator was available. We used this calibrator for a consistency test, i.e., to cross-check the results.
The visibilities presented in this paper were derived by averaging the calibrated subsamples. The error bars that are presented in Sect. 4 represent the corresponding standard deviation. The journal of our observations with AMBER is provided in Table 3.
| Date of | Object | proj. Baseline, U2-U3-U4 | Flags | |
|---|---|---|---|---|
| observation | (m) | (deg) | ||
| 13-04-2006 | AS 205 S | 44/53/75 | 49/128/93 | x |
| 20-03-2008 | AS 205 N | 46/62/89 | 38/109/80 | |
x measurement is not considered in data analysis because of technical failures and/or bad weather conditions
2.4 Observations with MIDI
The studied YSOs have also been observed with MIDI at the VLTI (Leinert et al. 2003a ), see Tables 4 and 5. Operating in N-band (8-13 m), MIDI combines two telescopes and offers – as in our case – a spectral resolving power of using the prism mode.
To determine the of the instrument, different calibrators that were taken from the “MIDI Calibrator Catalogue”444can be found on webpage www.eso.org/ were observed before or after the observation of the scientific object. Five of these calibrators, HD 95272, HD 102461, HD 133774, HD 139127, and HD 178345, were used for absolute flux calibration.555www.eso.org/sci/facilities/paranal/ instruments/midi/tools/ Observations of both scientifc target and calibrator consist of exposures. A single exposure takes ms. For descriptions of MIDI and its operation, see Leinert et al. (2003a ), Leinert et al. (2003b ), and Morel et al. (morel (2004)). The results of our MIDI observations of the objects HD 142666, AS 205 N, and AS 205 S, as well as a basic data analysis, have already been published in Schegerer (buch (2008)).
For data reduction, we used a custom software called MIA+EWS666www.strw.leidenuniv.nl/nevec/MIDI/, www.mpia-hd.mpg.de/MIDISOFT/. The data reduction steps are described in a tutorial on the cited web page, as well as in Leinert et al. (leinert (2004)) and Ratzka et al. (ratzka05 (2005)). The visibilities shown in this paper were derived by using all calibrators that were observed during one night with the same baseline and instrument setup as the scientific targets, which show no peculiarities. The correction of the calibration that is required due to the diameters of the calibrators is considered in the software package. But this correction has a negligible effect on the calibration. The error bars in the visibility curves represent the standard deviation when using the ensemble of calibrator measurements. We discarded a measurement whenever the result that was obtained from the MIA software package differs from the results obtained from the EWS software package.
The journals of our observations with MIDI are provided in Tables 4 and 5. Depending on the baseline that was used, an angular resolution between 8.6 mas and 17 mas corresponding to 0.98 AU - 1.9 AU and 1.4 AU - 2.7 AU at the distances of the sources HD 142666 and AS 205, respectively, was reached in our observations with MIDI.
| Date of | proj. Baseline | Flags | |
|---|---|---|---|
| observation | (m) | (deg) | |
| U1-U3 | |||
| 08-06-2004 | 102 | 37 | f |
| 08-06-2004 | 91 | 44 | x |
| 08-06-2004 | 90 | 44 | |
f fringe track repeated; x measurement is not considered in data analysis because of technical failures and/or bad weather
| Date of | Object | proj. Baseline | Flags | |
| observation | (m) | (deg) | ||
| U1-U2 | ||||
| 29-05-2005 | AS 205 N | 56 | 26 | |
| 29-05-2005 | AS 205 S | 57 | 29 | |
| U1-U3 | ||||
| 29-05-2005 | AS 205 N | 90 | 42 | |
| 29-05-2005 | AS 205 S | 87 | 42 | pfx |
| U3-U4 | ||||
| 30-05-2005 | AS 205 N | 55 | 125 | |
| 30-05-2005 | AS 205 S | 52 | 129 | |
f fringe track repeated; p photometry of one or both beams repeated; x measurement is not considered in data analysis because of technical failures and/or bad weather
For the determination of spatially unresolved spectra, the dedicated software package MIA+EWS was used. It extracts and calibrates raw spectra. The calibration was done by comparing the measured spectrum with the measured spectrum of spectrophotometric calibrators (Table 6).
| Date of | Object | Airmass | Flags |
|---|---|---|---|
| observation | |||
| 29-05-2005 | AS 205 N | 1.01/1.01 | |
| 29-05-2005 | AS 205 S | 1.02/1.02 | |
| 30-05-2005 | AS 205 N | 1.17/1.18 | x |
| 30-05-2005 | AS 205 S | 1.24/1.25 | x |
s spectrophotometric calibrator; x measurement
is not considered in data analysis because of
technical failures and/or bad weather
3 Modeling approach
3.1 Canonical disk model
For a detailed analysis, we used the radiative-transfer code MC3D which is based on a Monte Carlo method (Wolf et al. wolfI (1999)) and which was developed by Schegerer et al. (schegerer (2008)) to the form used here . A predefined, parameterized model of a passive disk is the basic element of our modeling approach. The approach of Shakura & Sunyaev (shakura (1973)) was used where the density distribution is given as
| (2) |
The quantity allows scaling the total disk mass . The quantities and are the radii measured from the disk center and the vertical distance from the disk midplane, respectively, while the quantity is the stellar radius. The function represents the scaleheight777 The scaleheight is defined as the vertical distance from the midplane where the density has decreased by a factor of .
| (3) |
with =. Determining the shape of the disk profile, the parameters and are called profile parameters in this study. In our approach the exponents and satisfy the relation
| (4) |
The latter relation results from the coupling of surface density and temperature of the disk based on the assumption of a disk in hydrostatic equilibrium (Shakura & Sunyaev shakura (1973)). We note that this approach is only correct for geometrically thin disks, where . However, since the scaleheight is at least one order of magnitude smaller than the corresponding radius , this approximation should be justified for those parts of the disk where infrared emission has its maximum. The error in the density of regions is for Taylor’s series. A rounded puffed-up inner rim was not considered as an analytical supplement to our modeling approach (Natta et al. nattaV (2001), Isella & Natta isella (2005)).
The infrared excess that is emitted from YSOs originates in heated dust and scattered light in the circumstellar environment (Vinkovic vinkovic (2012)). Assuming compact, homogeneous, spherical dust grains, their optical properties such as scattering and extinction cross sections were determined by Mie scattering theory from the measured complex refractive index of the specific material (Wolf & Voshchinnikov wolfV (2004)). A dust mixture of a “astronomical silicate” and graphite was assumed with relative abundances of % and %, respectively (Draine & Malhotra draine (1993)). We used a two-layer disk model to take dust settling into account. The disk interior, which is optically thick in N band, contains dust grains with a maximum particle size of . A size of was found for several T Tauri stars with millimeter observations using the Very Large Array (Rodmann et al. rodmann (2006)). The optical depth was measured for constant radii, from the disk atmosphere vertically to the disk midplane. The surface regions consisted of interstellar, unevolved dust with as found in the interstellar medium (Mathis et al. mrn (1977); MRN dust composition).
Accretion effects were taken into account. As extensively described in Schegerer et al. (schegerer (2008)), the potential energy of a particle on its way towards the star is partly released in the disk midplane (Lynden-Bell & Pringle lynden (1974), and Pringle pringle (1981)). Considering the “magnetically mediated” modeling approach (e.g., Uchida & Shibata uchida (1984); Bertout et al. bertout (1988); Calvet & Gullbring calvet+gullbring (1998)), more than half of the potential energy of the accreting particles is released in a boundary region above the stellar surface. The accretion rate , which determines the total accretion luminosity , was not an independent model parameter, but its value was constrained by the results of previous measurements. Correspondingly, the stellar mass , the effective stellar temperature , and the stellar luminosity , which were derived in previous studies, were fixed parameters in the modeling. Because the SED and the infrared emission, in particular, only marginally depend on the disk outer radius , this disk parameter was fixed to . Fitted model parameters of our approach were the scaleheight , the flaring parameter , and the inclination of the circumstellar disk.888An inclination of ° corresponds to a face-on disk. By considering a stellar temperature , the quadratic distance law, a mean dust sublimation temperature of , and the specific absorption coefficients of the adopted dust set, the temperature of single dust grains at any distance from the central star can be determined. The resulting radius where dust sublimates was the initial value of . However, this approach is an approximation for optically thick media since the buildup factor is not considered.
By means of manual modifications of the
parameters, we searched for the model that most successfully reproduces the
measured SED, NIR, and MIR visibilities simultaneously. A manual
modification was necessary because a disk model with a specific SED and
images999used for calculating the
spectrally dispersed visibility at different wavelengths takes several hours to
compute. Therefore,
in our search for the best-fit model, the uniqueness of our final models
cannot be proven.101010There is a faster and parallelized version of the
MC3D code available, now, where the computation could be strongly
accelerated, allowing computation of
up to models in several days. We verified whether the modeling
results can be improved by varying the model parameters using the following
changes:
,
,
, and
.
The step widths can be considered as
the precision to which the local
minimum in the -surface can be determined. The determination of the
modeling errors would require a fit of a polynomial to the -surface
of the
simulation grid of the independent parameters. For inclination , only an
upper value could be determined. Depending on the flaring of the disk,
the sight of the observer onto the star and the innermost disk regions get
worse for an increasing inclination, resulting in a decrease in the visible
(and infrared) flux from the source.
3.2 Extended disk model for TOs
As a result of photoevaporation, as well as planet formation and planet motion, the mass density at the inner disk regions decreases and disk gaps can be formed. To reproduce the SED that was obtained from the 8 Myr-T Tauri object RECX 5 using the InfraRed Spectrograph (IRS) onboard the Spitzer Space Telescope, Bouwman et al. (bouwmanIII (2010)) decreased the mass density in the disk model by a constant factor of up to a disk radius of . This clearing of the disk around the TO RECX 5 was assumed to be a consequence of the formation of a planet. In our approach, we generally assumed the canonical disk model, even for more evolved T Tauri stars and TOs in particular. We found, however, that this conventional approach cannot reproduce all the observations obtained from the source HD 142666. Therefore, a modification of the conventional approach was subsequently necessary for this source.
Depletion of small dust grains at smaller disk radii is characteristic of evolved T Tauri stars, and TOs in particular. To simulate dust depletion in disks, the primary disk density (Eq. 2) was multiplied with an exponential function,
| (5) |
that decreases the density at the inner disk edge by a factor with . The density is not decreased for . This exponential function, which is strictly increasing, is unity at , and it guarantees a smooth transition to the primary disk model in contrast to the approach of Bouwman et al. (bouwmanIII (2010)). For the density reduction factor, only the two different values and were used.
Considering the theoretical effects of photoevaporation or planet formation, another characteristic of TOs is the depletion of small dust grains within a defined disk region, resulting in the formation of an inner hole or ring with (negligibly) low dust density. A dust-free inner hole was implemented by increasing the inner disk radius . A dust-free ring with sharp boundaries, and , could also be cut from the model. The remaining disk structure was not affected by the gap.
The gap parameters were varied using the following step widths:
,
.
4 Observations and modeling results
All scientific targets could be resolved spatially with IOTA or AMBER in the NIR range and MIDI in the MIR range. Because of technical failures and/or bad weather conditions during the measurements, the observations of AS 205 S with AMBER failed. Furthermore, some single observations with AMBER or MIDI at specific baselines and PAs, which are flagged in Tables 4 and 5, are also not considered in the data analysis for the same reason.
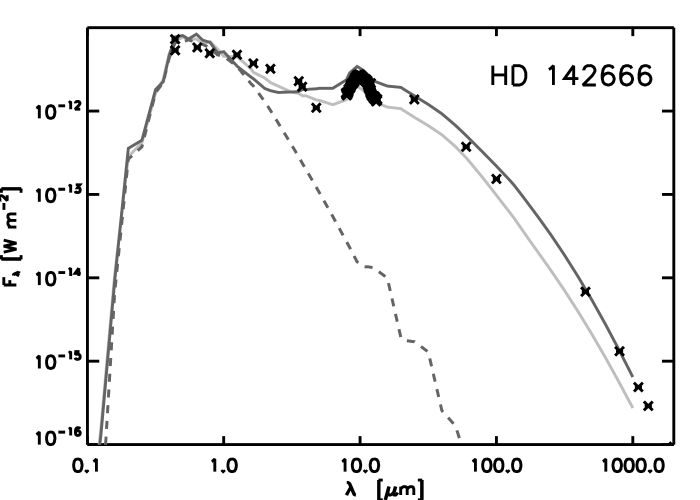
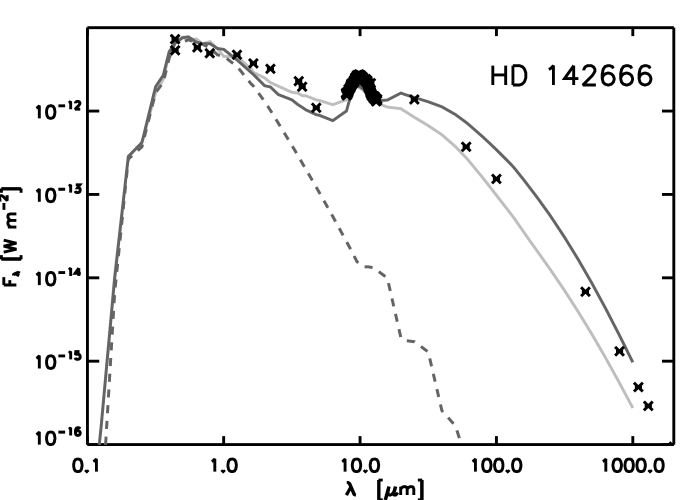
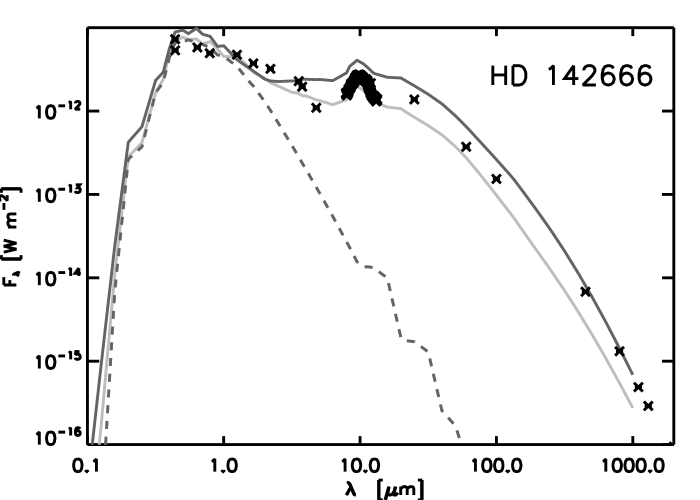
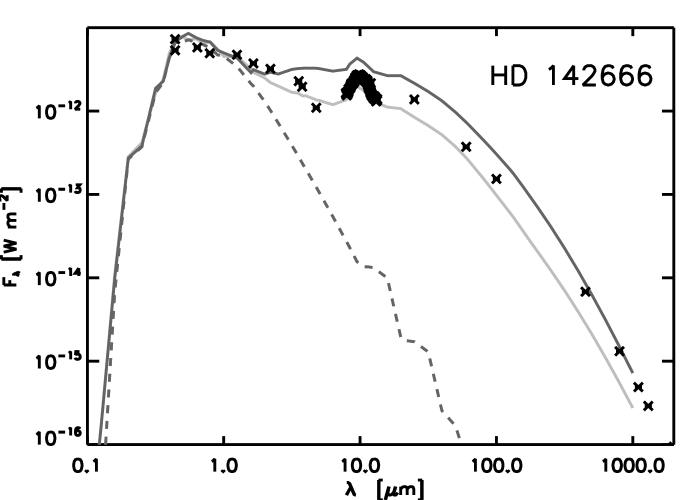
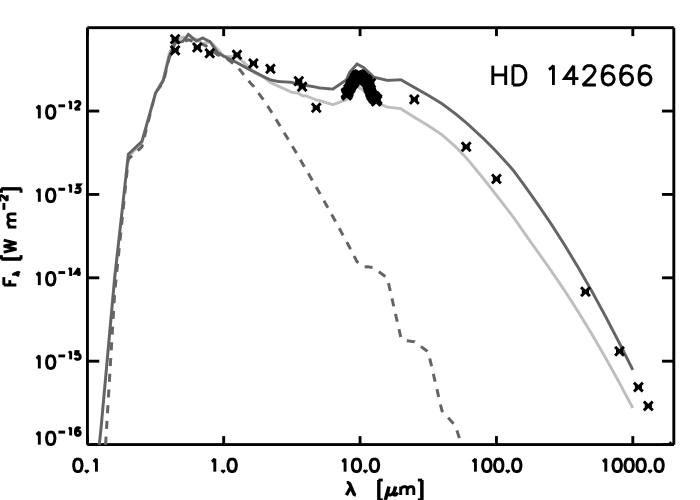
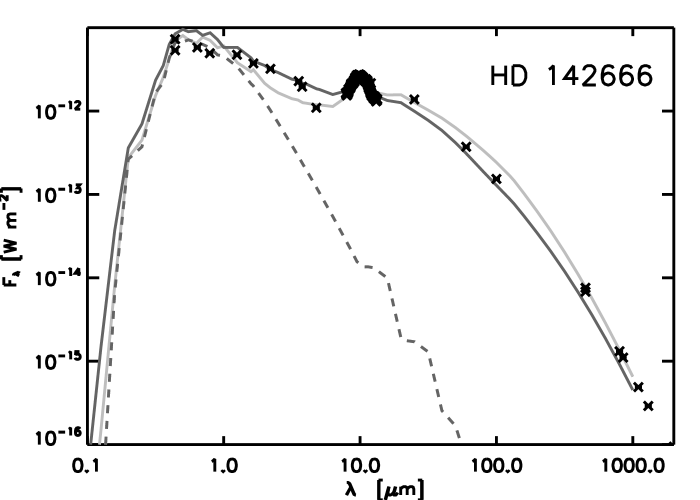
Table 7 presents the parameters resulting from our effort to model the YSOs. The ratio between the stellar and disk model flux at is also listed. The H-band visibilities depend on the ratio between the stellar and disk flux, as well as on the disk geometry. The excess at was calculated by subtracting the observed flux from the value for the assumed stellar photosphere. A negative ratio results from a high inclination of the disk. Flared, outer disk regions screen the infrared flux from the center. Along with the observations, we present and discuss the modeling results for each object of our sample in the following. Previous observations, including photometric measurements, are mentioned in Appendix A. The measured and modeled SED, as well as NIR and MIR visibilities of the objects in this study, are presented in Figs. 1-3.
4.1 HD 142666
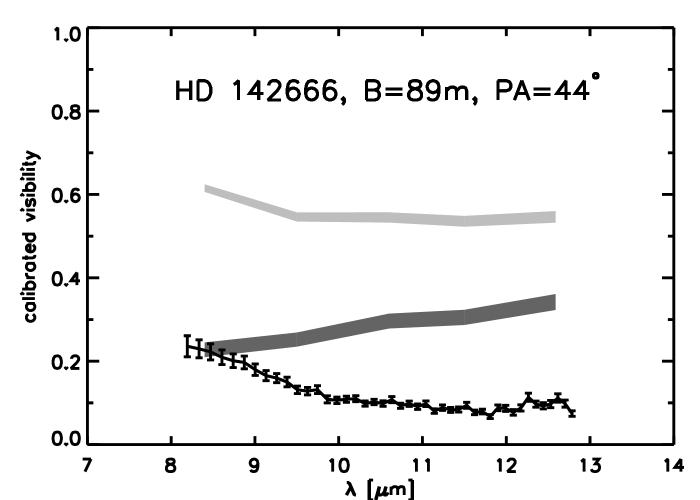
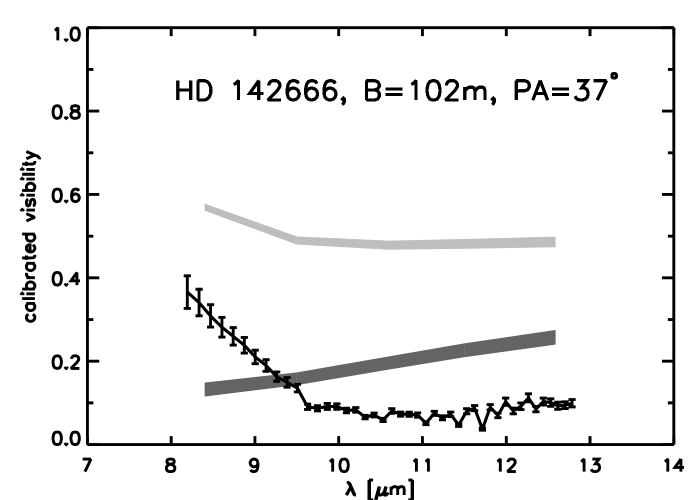
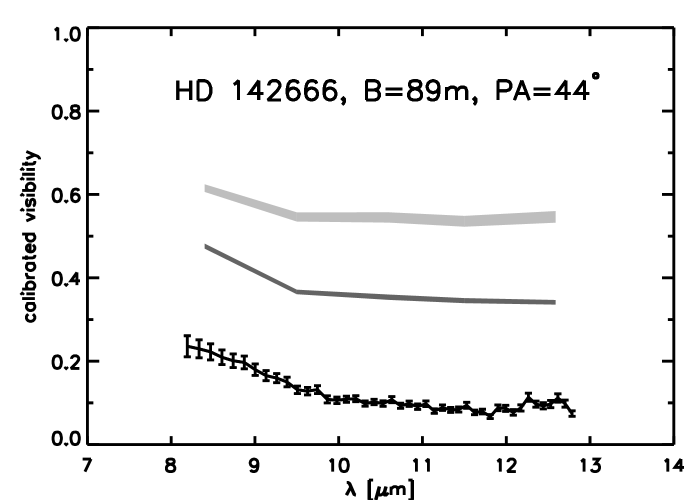
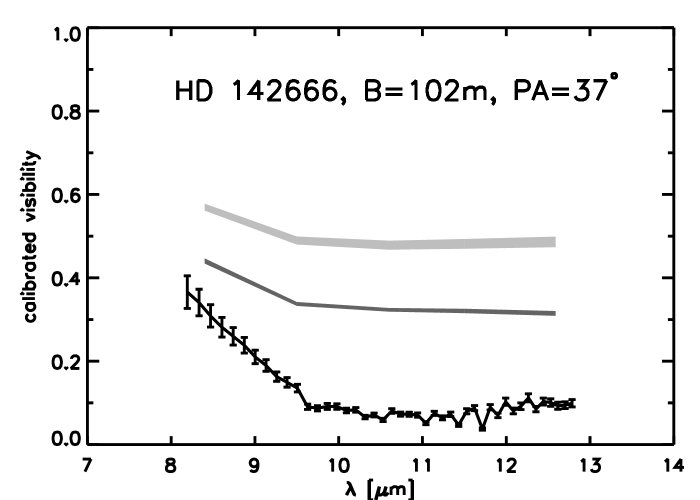
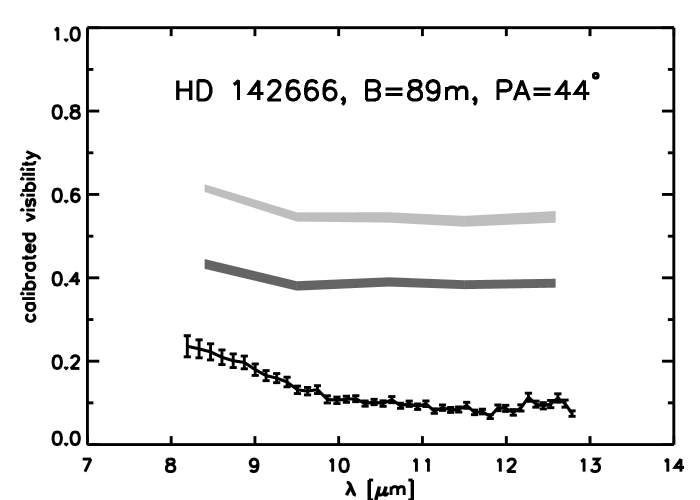
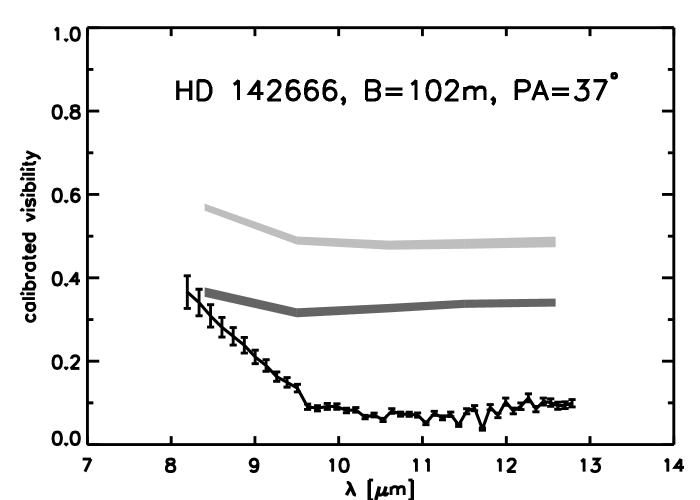
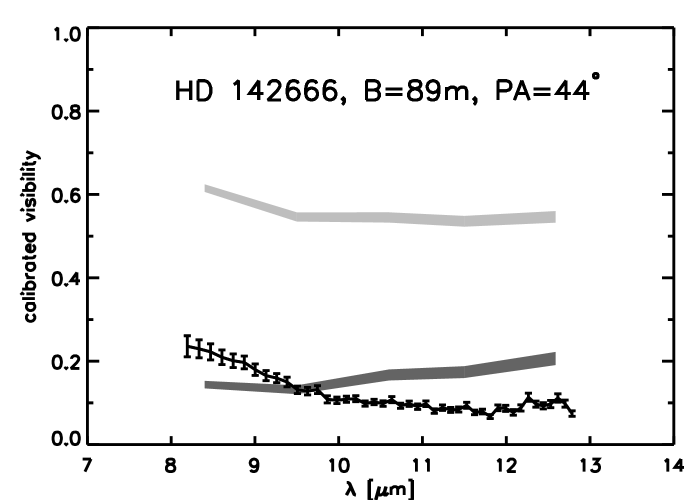
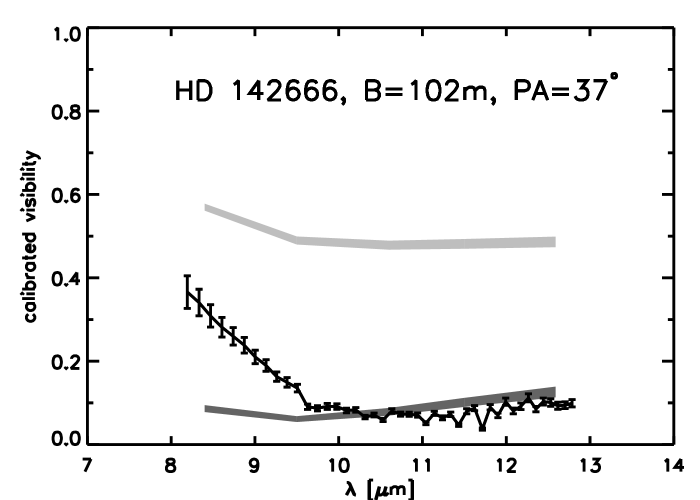
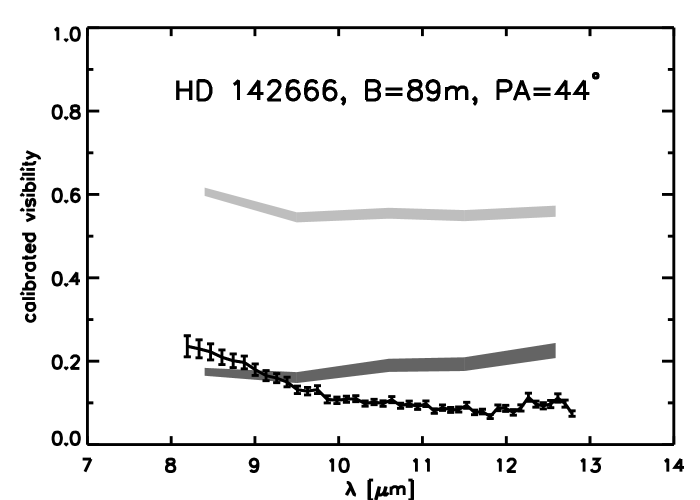
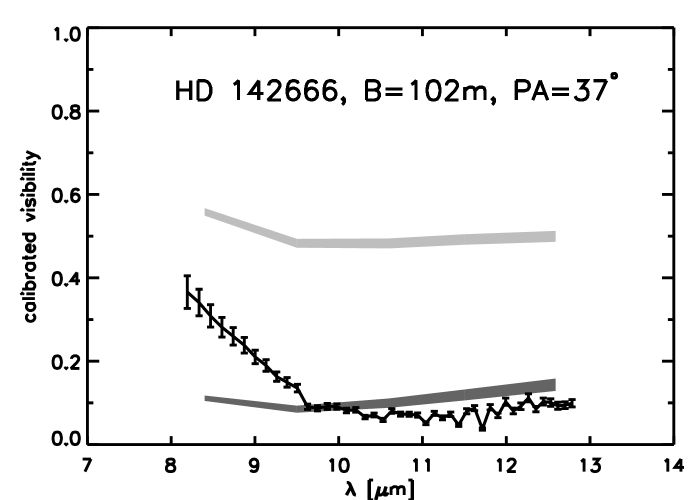
Figure 1 shows the SED of HD 142666, the spectrally unresolved but spatially resolved NIR visibilities from IOTA, as well as the spectrally and spatially resolved MIR visibility spectra from MIDI. With IOTA, an angular resolution of 6.3 mas ( at ) could be reached. The HAeBe object was observed with MIDI in the context of guaranteed time observations where a spatial resolution of and for could be reached using the projected baselines and , respectively. The low MIR visibility spectra correspond to a strongly spatially resolved circumstellar disk in the MIR range.
We used different disk parameter sets and different approaches for disk models until we could finally fit all the data obtained. The models (i-iv; Table 7) show the modeling results that consider the classical approach of Eq. 2 and accretion, while the disk densities were decreased in models (v-vi) using the modifications described in Sect. 3.2.
-
i
Considering the stellar properties, we initially assumed an inner disk radius of . After scanning the parameter space of the canonical approach of Shakura & Sunyaev (shakura (1973)), no model could be found that reproduces the SED, MIR visibility, and NIR visibilities of this source, simultaneously. While the NIR visibilities are consistent with the dust sublimation radius, the emission appears to arise from a region that is more extended than predicted by assuming a smooth radial profile of the dust density and temperature distribution.
-
ii
The low MIR visibility spectra favor an inner radius . For an increasing inner radius, the NIR and MIR flux distribution shift to larger radii resulting in a decrease in the corresponding visibilities. However, a decrease in the NIR visibilities does not solely reproduce the IOTA data. The NIR photometric flux, which has its origin mainly at the inner disk edge (Fig. 4), generally decreases for an increasing inner disk radius , and the fit of the photometric measurements in the NIR range gets worse. As the disk mass is kept constant, there are more particles that emit in the MIR wavelength range at and the MIR photometric flux increases. The upper row of Fig. 1 shows the modifications of the simulation results if the inner disk radius is increased by a factor of from in model (i) to in model (ii).
-
iii
To shift the MIR flux distribution to larger disk radii and, thus, to decrease the MIR visibility spectra in the model, we increased the profile parameters and resulting in disk flaring where outer disk regions are more strongly illuminated and heated by the central star. Another effect of disk flaring is the increase in the far-infared (FIR) flux by orders of magnitude. Outer disk regions are still too cold to contibute sufficiently to the NIR flux, so the NIR visibility only slightly decreases. Considering Eqs. 2 and 4, the mass density of the inner disk regions also decreases, resulting in too low NIR flux with respect to the photometric measurements. The second row of Fig. 1 shows the model (iii) where the profile parameter has been increased from to , while all the other parameters were kept constant.
-
iv
Assuming an inner disk radius to reproduce the MIR visibilities, an increase in the NIR flux and NIR visibility can result from an increase in the accretion rate in model (ii). But in contrast to the effect on the SED, a modification of the accretion rate only slightly increases the NIR visibility in the model with . Furthermore, considering the high age of the object of million years and the measurements of Garcia-Lopez et al. (garcia-lopez (2006)) where an accretion rate of was determined by analyzing the FWHM of the Br line, a large accretion rate can be excluded. Apart from the accretion rate, any further (infrared) source in the disk region that cannot be resolved with IOTA, such as a close stellar/planetary companion or hypothetical inner rim wall that is puffed up by the strong irradiation of the central star, could increase the NIR flux and NIR visibility in disks with larger inner radii. A puffed up inner rim wall, however, also results in a higher concentration of warm dust. Consequently, the MIR visibility does not decrease since it is necessary for a better fit. Furthermore, the stellar temperature and luminosity of HD 142666 are similar to the corresponding properties of the YSO RY Tau. In an extensive study using a self-consistent disk model, Schegerer et al. (schegerer (2008)) have shown that there are not hints of a puffed upper rim wall for this YSO. Finally, we also implemented an optical and geometrically thin disk for with a dust grain radii . Eisner et al. (eisnerIII (2006)) succeed in reproducing the SED and NIR visibilities of the TO TW Hya, assuming such an optically thin structure in the inner hole of the disk. However, not all of the photometric and interferometric data could be reproduced by assuming such an inner thin disk.
-
v
To shift the MIR flux distribution to larger disk radii and decrease the MIR visibility, the disk density was exponentially reduced according to Sect. 3.2 using . Another effect is the increase in the infrared flux. But such a modification in model (v) is not sufficient to fit the MIR visibilities (fourth row in Fig. 1).
-
vi
Therefore, in addition to the latter modification in model (v), we increased the inner disk radius to and cut a dust-free ring from the disk between and in model (vi). The remaining dust ring between and is large enough to provide enough NIR flux and to reproduce the NIR visibility. In contrast, the dust-free ring causes a shift in the MIR flux distribution towards larger disk radii, resulting in a decrease in the corresponding visibilities. The model flux at deviates by from the measured H band flux.
-
vii
In disk model (vii), there is an identical disk gap to the one in model (vi). But the density was not decreased. Here, the MIR visibility is decreased, but not enough to reproduce the observations. Furthermore, the NIR visibility decreased too strongly.
ii
iii
iv

v
vi
vii
4.2 AS 205 N

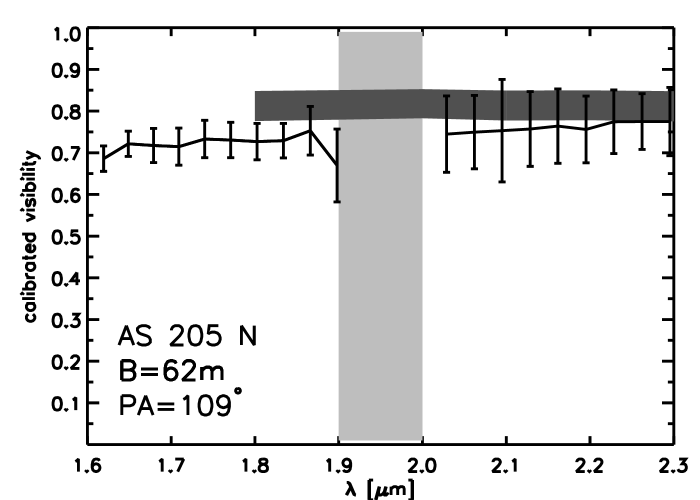
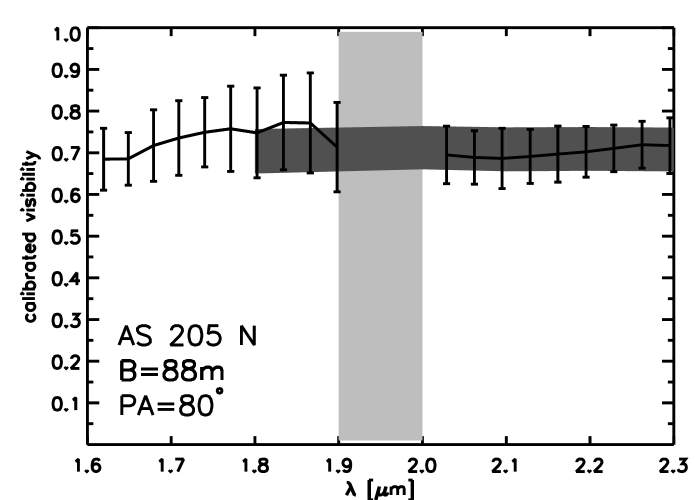
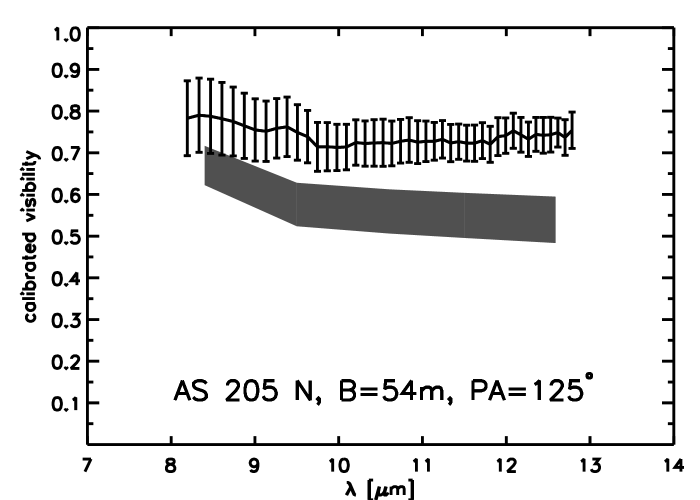

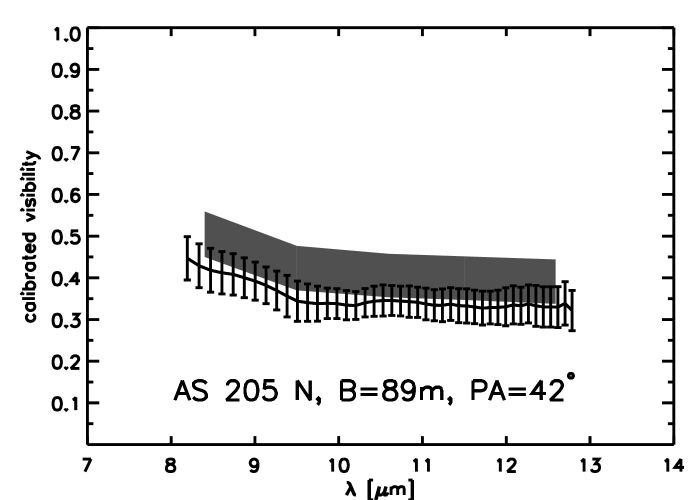
There are previous flux measurements in the NIR and MIR wavelength ranges that can be exclusively ascribed to the northern component (Eisner et al. eisnerII (2005); Prato et al. prato (2003)). Apart from a recent observation at a wavelength of (Andrews et al. (andrews (2011)), we assumed that all other previous photometric measurements could not spatially resolve each single component of the system. Cohen & Kuhi (cohen (1979)) could measure the visual flux of each component, but they missed ascribing the photometric values to each single component. Since AS 205 N is an active and variable source (Johns-Krull et al. johns-krullII (2000); Eisner et al. eisnerII (2005)), it depends on the variability of the visual fluxes if the measurements of Cohen & Kuhi can be correctly assigned. The spectral flux in this wavelength regime and the visibilities have to be measured simultaneously.
The canonical disk model was used for modeling this source, We found that an advanced disk model with a larger inner disk radius and lower dust density in the inner disk region, respectively, cannot reproduce the observations, in particular the photometric measurements. The successful data reproduction using the canonical modeling approach confirms the primordial, unevolved character of the disk, which is consistent with the young age of the source of (Prato et al. prato (2003)). However, there is an ambiguity in the profile parameters and . Models with values and reproduce the measurements just as well.
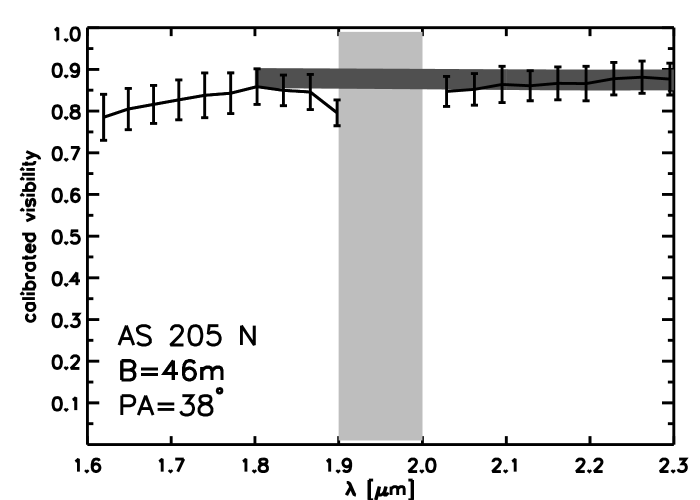
The visibility that was measured with the -baseline is % lower than the modeled value. The SED that results from our best model for AS 205 N differs by about % from the photometric measurements of Prato et al. (prato (2003)) in the NIR wavelength range (Fig. 2). Considering a deviation by %, the modeled SED agrees with the fluxes that were measured by Eisner et al. (eisnerII (2005)). This disagreement with Prato et al. and the agreement with the Eisner et al. probably point to an intrinsic variability of the source in the NIR. However, the stellar luminosity of that was derived by Eisner et al. (eisnerII (2005)) is about a factor of lower than other previous results (Prato et al. prato (2003); Liu et al. liu (1996)) and cannot be confirmed by our model. In contrast, the accretion rate of that is used in our model corresponds to the estimation of Eisner et al. (eisnerII (2005)) and Johns-Krull et al. (johns-krullII (2000): ). The accretion luminosity is about . Therefore, AS 205 N is a T Tauri object with one of the highest accretion rates in comparison to other T Tauri stars (Ratzka et al. ratzkaIII (2007); Schegerer et al. schegerer (2008), Schegerer et al. schegererII (2009)).
Although we assume an accretion rate of , we have found that a model with the same profile parameters as listed in Table 7 but with an accretion rate that is lower by a factor assuming a larger inner disk radius of at the same time can also simultaneously fit the SED, MIR, and NIR visibilities. A lower accretion rate of results in less NIR and MIR radiation and a larger inner disk radius of (instead of ) induces a temperature decrease of on average in the innermost disk regions and a shift of the thermal emission peak to longer wavelengths. Our modeling approach thus allows models with different modeling parameters to fit the whole data set. This ambiguity can be avoided by considering the results of the previous, independent measurements of the accretion rate.

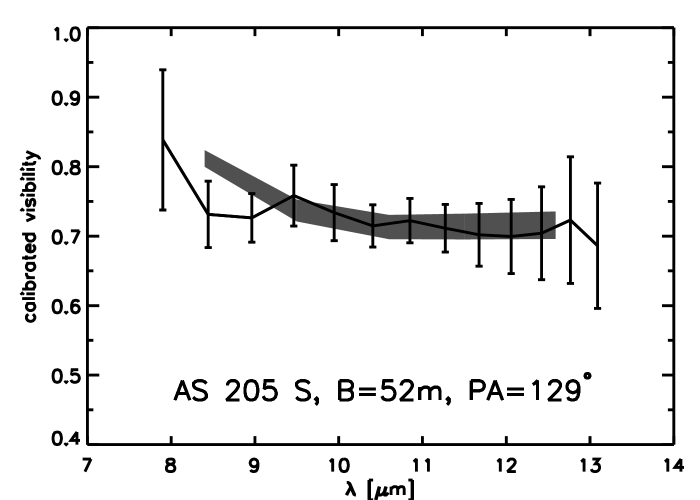
4.3 AS 205 S
Apart from a recent submillimeter observation by Andrews et al. (andrews (2011)), the photometric fluxes in the visual, FIR, and millimeter ranges have to be ascribed to AS 205 N and AS 205 S. Moreover, the visual extinction of the southern component, which is a binary itself, could not be derived unambiguously. While Prato et al. (prato (2003)) assume , Eisner et al. (eisnerII (2005)) and McCabe et al. (cabeII (2006)) derived higher values of and , respectively. Although the measurements approximately agree with each other within the error bars, a standard deviation of makes a subsequent allocation of the photometric, spatially resolved fluxes in the visual range impossible.
The flux in L band, which results from the model of AS 205 S differs by about from the fluxes measured by Prato et al. (prato (2003); Fig. 3). It is possible that photometric variability in the NIR is also responsible for this difference between the measurements and the model of the southern component. The accretion luminosity of this component is . The interferometric measurements on the baselines of and (Table 5) were discarded because of the bad weather conditions during the observations. According to Eisner et al. (eisnerII (2005)), even AS 205 S is a binary. The separation of both components is at a position angle of . Such a binary system was not considered in our models for AS 205 S because a sinusoidal visibility curve that is characteristic of a close binary system could not be identified (Schegerer et al. schegerer (2008)).

5 Discussion
Our comprehensive modeling approach is complex. There are some deficiencies (d-i – d-vi) that should be listed.
-
d-i
The main limitation of our observations is the limited uv coverage, which makes the data analysis model dependent. The physical quantity that can be best constrained is the radial extent of the NIR and MIR disk emission. The goal of this paper was to constrain this quantity for the sources under investigation. Studying SED and visibility, the inclination and the position angle of the disks cannot be derived precisely. Only a few visibility points are not sufficient to derive these values. With respect to the SED only an upper limit of the inclination can be determined. This limit corresponds to the angle where the disk allows the observations of inner disk regions (and the central star).
-
d-ii
There are small, local deviations between measured and modeled data. The modeling approach of Shakura & Sunyaev (shakura (1973)) assumes a rotationally symmetric structure. Deviations between modeled and measured visibilities at fixed baseline lengths but different PAs, for instance, could be caused by local asymmetric structures. In fact, such structural asymmetries could be evoked, e.g., by large-scale eddies (Klahr et al. klahr (2003)), which have already been observed in large-scale images of YSOs (Fukagawa et al. fukagawaI (2004); Lagage et al. lagage (2006)).
-
d-iii
For HD 142666, we found a model for this putative TO by assuming a smooth transition to the canonical disk approach. Although this approach was confirmed by our interferometric observations, there are different possible approaches that are supposed to reproduce the measurements as well (e.g., Bouwman et al. bouwmanIII (2010)).
-
d-iv
A latent ambiguity in our modeling approach cannot be ruled out (Sect. 4.2).
-
d-v
The discontinuous boundaries at the inner disk edge, as well as the edges of a potential ring gap, that can be implemented in our advanced disk model are a simplification.
-
d-vi
A wide variety of outer disk radii can reproduce the measured data of all objects of this study. Because of the intrinsic ambiguity of the SED (Men’shchikov & Henning menshchikov (1994); Thamm et al. thamm (1994)), large photometric errors, and missing spatially resolved observations in the FIR range, an unambiguous determination of the model parameter is not possible.
-
d-vii
The modeled SED can deviate from the measured SED. We assume a dust mixture of ”astronomical silicate” and graphite with the canonical MRN grain-size distribution. But previous studies of the silicate feature and the water ice feature have already shown strong modifications of the composition in circumstellar disks (Bouwman et al. bouwman (2001); Przygodda et al. przygodda (2003); Bouwman et al. bouwmanII (2008); Schegerer & Wolf schegererIII (2010)). The modification of the dust composition depends on properties of the central star and the evolutionary status of the source (van Boekel et al. boekelII (2005); Schegerer et al. schegererI (2006)), as well as on the distance from the star (van Boekel et al. boekel (2004); Schegerer et al. schegerer (2008)) and from the midplane (Rodmann et al. rodmann (2006)). However, the analysis of dust features only allows investigations of the relative occurrence of silicate grains with sizes between and assuming nonporous grains. Therefore, an individual dust composition is not considered in our modeling approach, although the dust composition affects the disk structure as shown by Monnier & Millan-Gabet (monnier (2002)).
Different modeling approaches have been used for the objects of this study. This is discussed in detail in the following.
5.1 HD 142666
Extensive modifications of the parameter of the canonical model, i.e., the inner disk radius , the profile parameters and , and the accretion rate , respectively, failed to reproduce all the observations. Therefore, the modeling of the source HD 142666 required an extension of the canonical approach of Shakura & Sunyaev (shakura (1973); Eq. 2). In our approach for HD 142666, we reduced the dust density at the inner disk edge by multiplying of the canonical disk with the factor . This factor smoothly increased up to unity at . Additionally, we increased the inner disk radius from to and cut a dust-free ring from the disk between and . There are several different approaches in advanced disk models that potentially reproduce the whole data set that we obtained. However, an increased inner disk radius and a disk gap is putatively necessary for a successful fit. While the increased inner disk radius decreases the infrared flux and the NIR visibility, a low MIR visibility results from the disk gap. For a constant disk mass, the NIR flux even increases after cutting the gap from the disk. A larger sublimation radius or a disk gap, alone, cannot explain the infrared visibilities and the SED of this source. Higher accretion rates, an inner optical and geometrically thin disk, a more flared disk, or a puffed-up inner rim can all be excluded.
The disk gaps in HD 142666 classify this source as TO. This result contrasts with previous studies where TOs were classified as sources with specific color relations (McCabe et al. cabe (2003); Alexander et al. 2006b ) or a significant lack of infrared excess at , solely (Table 8). The last two characteristics are not even fulfilled by HD 142666. Recently, several such “unexpected” transition disks have been discovered through direct imaging on the millimeter wave dust emission in more outer disk regions (e.g., Andrews et al. andrews (2011)). All these objects have normal SED but cavities larger than AU, as measured in the millimeter wavelength range.
We assume that this clearing of the disk can be a consequence of planet formation where adjacent regions are strongly affected by tidal forces (Calvet et al. calvet (2002); Rice et al. rice (2003); Quillen et al. quillen (2004)). However, this modeling result also confirms the outcome of the theoretical study of Takeuchi et al. (takeuchi (2003)), in principle, where disk evolution has been modeled combining viscous evolution, photoevaporation, and the differential radial motion of dust grains and gas. In this study, the formation of a dust ring in the disk of HAeBe stars is predicted without assuming planet formation but as a natural consequence of photoevaporation and grain migration. HAeBe stars strongly suffer from a photoevaporative mass loss from the disk. The outer disk regions are slowly eroded, the inner hole grows, and the dust becomes concentrated close to the inner disk edge. We have to note, however, that Takeuchi et al. (takeuchi (2003)) studied more massive (M⊙) and more luminous (L⊙) HAeBe objects where a dust ring appears at radii on the order of AU.
For the case that a young planet has formed the disk gap, we studied its theoretical effects on our interferometric observations. In fact, a planetary companion of the main source evokes a specific sinusoidal visibility curve whose amplitude and frequency depend on the separation , the position angle of the companion with respect to the position angle of the interferometric baseline , and the brightness ratio (Ratzka et al. ratzka (2009)). We assume a brightness ratio of between the main source and a potential planetary companion, the primordial visibility curve without companion would change by , only. Considering a standard deviation of on average (Sect. 4.1), such a modification would be too weak to be noticed using the interferometers available in this study. The brightness ratio should be , at least, to be directly found by our interferometric measurements.
5.2 AS 205
The SED and the MIR visibilities of AS 205 have been investigated and modeled in Schegerer (buch (2008)) and Schegerer et al. (schegererII (2009)). Only a few, small modifications of these previous disk models, which are canonical models, were enough to fit the NIR visibility spectra of these sources, as well. We conclude that the inner disk structure ( up to several s) is strongly determined by SED and MIR visibility spectra. In fact, considering Fig. 4, the regions where MIR and NIR flux arise overlap. However, the spatial resolution of MIDI is probably too low to uniquely determine the parameter , in particular for less evolved objects. For the northern and the southern components of AS 205, the inner disk radius is assumed to be the sublimation radius that was determined by the properties of the star and the dust.
6 Summary and outlook
In this study, we observed three well-known YSOs using the interferometers IOTA and AMBER in the NIR wavelength range and MIDI in the MIR wavelength range. A maximum spatial resolution of and could be reached, respectively, allowing study of the innermost disk regions and of the inner disk edge in particular. The visibility , i.e., the outcome from our interferometric observations, is a complex function of the dust density distribution, dust properties, and stellar properties of the source. Thus, a proper quantitative analysis was only possible by comparison with radiative transfer simulations for circumstellar disk models, which we performed with our radiative transfer code MC3D. We created large samples of models of YSOs and mimicked the interferometric observational data to compare the results with our observations. We considered photometric data and object properties from the literature to obtain a unique disk model that reproduces all the data. AS 205 N and AS 205 S could be modeled using the canonical approach of Shakura & Sunyaev (shakura (1973)) for viscous disks.
Here, we considered accretion effects, as well as a two-layer disk model with the classical MRN dust composition in the surface layer. Several model parameters were constrained by literature values, such as stellar properties, the distance of the object, and its accretion rate. Five (free) parameters were modified in the canonical approach. Since no parameter set could be found that model all the observations that are available for HD 142666, this modeling approach was extended. The disk density at the inner disk edge was multiplied with an exponential function of radius that reduces the mass density at the inner disk edge by a constant and converges to unity at the outer disk radius . Additionally, a dust-free ring was cut from the disk. Thus, the advanced approach where three extra parameters (, , ) are available allows the putative properties of a TO to be modeled, i.e., disk gaps and a low dust density.
Considering the simplifications in our modeling approach (Sect. 5), the models cannot reproduce all the data perfectly. However, the following basic results (r-i – r-vii) can be derived from our modeling approach:
-
r-i
The canonical modeling approach failed to reproduce all the data obtained from high spatially resolved observations of HD 142666, which is a YSO at an advanced evolutionary stage. An advanced modeling approach was a necessary criterion for a TO.
-
r-ii
The HAeBe star HD 142666 could be successfully modeled by implementing an inner disk hole where the inner disk radius () is equal to the initial sublimation radius . The initial sublimation radius was approximated after assuming the stellar temperature and an optically thin disk with MRN dust composition. A dust-free ring between and had to be cut from the disk, leaving a dust ring between and with reduced mass density.
-
r-iii
If we classify a TO as a YSO with a disk gap, the object HD 142666 is a TO. This finding is based on our interferometric observations, while the SED or the color relations are not appropriate for a final classification. Table 8 lists the color for the objects of this study, but a criterion that separates CTTS from TOs could not be found.
-
r-iv
The canonical disk model satisfied the observations for the binary system AS 205 where the components AS 205 N and AS 205 S were separately modeled. The implementation of accretion effects were necessary for a successful reproduction of the observations. The presence of accretion could be a necessary hint that the transmit to a TO has not happened yet. A disk gap or lower dust densities than the canonical model provides can be excluded as the sources of this system.
-
r-v
This study has shown that the SED and the MIR visibilities are generally not sufficient to determine the inner disk radius of more evolved YSOs, although the inner disk edge close to the sublimation radius emits MIR radiation (Fig. 4). NIR visibilities obtained from long enough interferometric baselines can avoid such an ambiguity.
-
r-vi
For both components of the CTTS-system AS 205, the NIR visibility data could confirm the model that we previously derived for both sources considering their SED and MIR visibilities alone. For these sources, the inner disk radius is the sublimation radius that we formerly approximated.
Apart from our findings, the following questions (q-i – q–ii) arise from this study:
-
q-i
Is the small dust ring between and in HD 142666 a region that favors planet formation?
-
q-ii
Do disk gaps (inner disk hole, dust-free ring) result from photoevaporation or can they be attributed to the action of planet formation/motion of young planets? In fact, inner disk gaps such as an inner disk hole in T Tauri objects and an inner hole and dust-free ring in HAeBe stars are an outcome of the theoretical study of Takeuchi et al. (takeuchi (2003)), which only assumes viscous motion and photoevaporation. However, Takeuchi et al. (takeuchi (2003)) studied more massive sources and predicted dust gaps at larger disk radii () than we found. An inner disk hole has also been found and confirmed for the nearby TO TW Hya with an age of million years (Calvet et al. calvet (2002); Ratzka et al. ratzkaIII (2007)). But Setiawan et al. (setiawan (2008)) report the detection of a planetary companion with a mass of around TW Hya in an orbit with radius . The authors of that study supposed that this planet is responsible for clearing the inner disk through the accretion of gas and dust, and they conclude that disk evolution and planet formation are probably directly connected. However, the actual existence of the planet orbiting TW Hya is still being discussed.
Acknowledgements.
A. A. Schegerer and S. Wolf were supported by the German Research Foundation (DFG) through the Emmy-Noether grant WO 857/2 (“The evolution of circumstellar dust disks to planetary systems”). Financial support from the Hungarian OTKA grant NN102014 and K101393 is acknowledged.References
- (1) Akeson, R. L., Millan-Gabet, R., Ciardi, D. R., et al., 2011, ApJ, 728, 96
- (2) Alexander, R. D., Clarke, C. J., & Pringle, J. E., MNRAS, 369, 216
- (3) Alexander, R. D., Clarke, C. J., & Pringle, J. E., MNRAS, 369, 229
- (4) Andrews, S. M., Wilner, D. J., Hughes, A. M., Chunhua, Q., & Dullemond, C. P., 2009, ApJ, 700, 1502
- (5) Armitage, P. J., Clarke, C. J., & Tout, C. A., 1999, MNRAS, 304, 425
- (6) Berger, J.-P., Haguenauer, P., Kern, P. Y., et al., 2003, Proc. SPIE, 4838, 1099
- (7) Bertout, C., Basri, G., & Bouvier, J., 1988, ApJ, 330, 350
- (8) Blondel, P. F. C., Djie, H. R. E., & Tjin, A., 2006, A&A, 456, 1045
- (9) Bordé, P., Coudé du Foresto, V., Chagnon, G., & Perrin, G., 2002, A&A, 393, 183
- (10) Bouwman, J., Meeus, G., de Koter, A., et al., 2001, A&A, 375, 950
- (11) Bouwman, J., Lawson, W. A., Dominik, C., et al., 2006, ApJ, 653, 57
- (12) Bouwman, J., Henning, Th., Hillenbrand, L. A., et al., 2008, ApJ, 683, 479
- (13) Bouwman, J., Lawson, W. A., Juhász, A., et al., 2010, ApJ Letters, 723, 243
- (14) Brown, J. M., Blake, G. A., Qi, C., Dullemond, C. P., & Wilner, D. J., 2008, ApJ, 675, 109
- (15) Bryden, G., Chen, X., Lin, D. N. C., Nelson, R. P., Papaloizou, J. C. B., 1999, AJ, 514, 344
- (16) Calvet, N., & Gullbring, E., 1998, ApJ, 509, 802
- (17) Calvet, N., D’Alessio, P., Hartmann, L., et al., 2002, ApJ, 568, 1008
- (18) Carleton, N. P., Traub, W. A., Lacasse, M. G., et al., 1994, Proc. SPIE, 2200, 152
- (19) Carpenter, J. M., Wolf, S., Schreyer, K., Launhardt, R., & Henning, Th., 2005, AJ, 129, 1049
- (20) Chelli, A., Utrera, O. H., & Duvert, G., 2009, A&A, 502, 705
- (21) Clarke, C. J., Gendrin, A., & Sotomayor, M., 2001, MNRAS, 328, 485
- (22) Cohen, M., & Kuhi, L. V., 1979, ApJS, 41, 743
- (23) Cutri, R. M., Skrutskie, M. F., van Dyk, S., et al., in 2MASS All Sky Catalog of point sources, 2003
- (24) Draine, B. T., & Malhotra, S., 1993, ApJ, 414, 632
- (25) Dullemond, C. P., Dominik, C., & Natta, A., 2001, ApJ, 560, 967
- (26) Dullemond, C. P., Hollenbach, D., Kamp, I., & D’Alessio, P., in Protostars and Planets V, 2006, eds. B. Reipurth, D. Jewitt, & K. Keil
- (27) Eisner, J. A., Hillenbrand, L. A., White, R. J., et al., 2005, ApJ, 623, 952
- (28) Eisner, J. A., Chiang, E. I., & Hillenbrand, L. A., 2006, ApJ, 637, 133
- (29) Ercolano, B., Clarke, C. J., & Robitaille, T. P., 2009, MNRAS, 394, 141
- (30) Fukagawa, M., Hayashi, M., Tamura, M., et al., 2004, ApJ, 605, 53
- (31) Fukagawa, M., Tamura, M., Itoh, Y., et al., 2010, PASJ, 62, 347
- (32) Garcia-Lopez, R., Natta, A., Testi, L., & Habart, E., 2006, A&A, 459, 837
- (33) Gitton, P. B., Lèvêque, B., Samuel, A., Avila, G., & Phan Duc, T., 2004, Proc. SPIE, 5491, 944
- (34) Grady, C. A., Polomski, E. F., Henning, Th., et al., 2001, AJ, 122, 3396
- (35) Gregorio-Hetem, J., Lepine, J. R. D., Quast, G. R., Torres, C. A. O., & de La Reza, R., 1992, AJ, 103, 549
- (36) Guilloteau, S., Dutrey, A., Petry, J., & Gueth, F., 2008, A&A, 478, 31
- (37) Jackson, J. D., in Klassische Elektrodynamik, 1983 (Walter de Gruyter)
- (38) Jennison, R. C., 1958, MNRAS, 118, 276
- (39) Jensen, E. L. N., Mathieu, R. D., & Fuller, G. A., 1996, ApJ, 458, 312
- (40) Johansen, A., Oishi, J. S., McLow, M.-M., et al., 2007, Natur, 448, 1022
- (41) Johns-Krull, C. M., Valenti, J. A., & Linsky, J. L., 2000, ApJ, 539, 815
- (42) Haisch, K. E., Lada, E. A., & Lada, C. J., 2001, ApJ, 553, 153
- (43) Hales, A. S., Gledhill, T. M., Barlow, M. J., & Lowe, K. T. E., 2006, MNRAS, 365, 1348
- (44) Hartmann, L., Calvet, N., Gullbring, E., & D’Alessio, P., 1998, ApJ, 495, 385
- (45) Hollenbach, D., Johnstone, D., Lizano, S., & Shu, F., 1994, ApJ, 428, 654
- (46) Houk, N., Evans, A., & Sowell, J. R., 1988, BAAS, 20, 695
- (47) Hummel, C. A., 2008, Proc. SPIE, 7013, 136H
- (48) IRAS Explanatory Supplement to the Catalogs and Atlasses, 1985, eds. C. Beichmann, G., Neugebauer, H. J. Habing, P. E. Clegg, & T. J. Chester, NASA RP-1190, 1
- (49) Isella, A., & Natta, A. 2005, A&A, 438, 899
- (50) Kenyon, S. J., & Hartmann, L., 1995, ApJS, 101, 117
- (51) Klahr, H., & Bodenheimer, P., 2003, ApJ, 582, 869
- (52) Koresko, C. D., Herbst, T. M. & Leinert, Ch., 1997, ApJ, 480, 741
- (53) Koresko, C. D., 2002, AJ, 124, 1082
- (54) Kraus, S., Schloerb, F. P., Traub, W. A., et al., 2005, AJ, 130, 246
- (55) Lagache, P.-O., Doucet, C., Pantin, E., et al., 2006, Sci, 314, 621
- (56) Leinert, Ch., in Star Formation and Techniques in Infrared and mm-Wave Astronomy, 1992, LNP, eds. T. P. Ray, & S. V. W. Beckwith, Springer (Berlin), 431, 215
- (57) Leinert, Ch., Graser, U., Waters, L. B. F. M., et al., 2003b, Proc. SPIE, 4839, 893
- (58) Leinert, Ch., Graser, U., Przygodda, F., et al., 2003a, Ap&SS, 286, 73
- (59) Leinert, Ch., van Boekel, R., Waters, L. B. F. M., et al., 2004, A&A, 423, 537
- (60) Liu, M. C., Graham, J. R., Ghez, A. M., et al., 1996, ApJ, 461, 334
- (61) Lynden-Bell, D., & Pringle, J. E. 1974, MNRAS, 168, 603
- (62) Mathis, J. S., Rumpl, W., & Nordsieck, K. H., 1977, ApJ, 217, 425
- (63) McCabe, C., Duchêne, G., & Ghez, A. M., 2003, ApJ, 588, 113
- (64) McCabe, C., Ghez, A. M., Prato, L., et al., 2006, ApJ, 636, 932
- (65) Meeus, G., Waelkens, C., & Malfait, K., 1998, A&A, 329, 131
- (66) Meeus, G., Waters, L. B. F. M., Bouwman, J., et al., 2001, A&A, 365, 476
- (67) Men’shchikov, A. B., & Henning, Th., 1994, eds. R. Ferlet, & A. Vidal-Madjar (Editions Frontieres), 381
- (68) Mérand, A., Bordé, P., & Coudé Du Foresto, V., 2005, A&A, 433,1155
- (69) Millan-Gabet, R., Schloerb, F. P., & Traub, W., 2001, ApJ, 546, 358
- (70) Monnier, J. D., Millan-Gabet, R., 2002, ApJ, 579, 694
- (71) Morel, S., Ballester, P., Bauvir, B., et al., 2004, Proc. SPIE, 5491, 1666
- (72) Natta, A., Grinin, V. P., Mannings, V., & Ungerechts, H., 1997, ApJ, 491, 885
- (73) Natta, A., Prusti, T., Neri, R., et al. 2001, A&A, 371, 186
- (74) Natta, A., Testi, L., Neri, R., Shephard, D. S., & Wilner, D. J., 2004, A&A, 416, 179
- (75) Natta, A., Testi, L., & Randich, S., 2006, A&A, 447, 609
- (76) Petrov, R. G., Millour, F., Chesneau, O., et al., 2005, astro-ph, 0509208
- (77) Pottasch, S. R., & Parthasarathy, M., 1988, A&A, 192, 182
- (78) Prato, L., Greene, T. P., & Simon, M., 2003, ApJ, 584, 853
- (79) Preibisch, Th., Brown, A. G. A., Bridges, T., Günther, E., & Zinnecker, H. 2002, ApJ, 124, 404
- (80) Pringle, J. E. 1981, ARA&A, 19, 137
- (81) Przygodda, F., van Boekel, R., Ábráham, P., et al., 2003, A&A, 412, 43
- (82) Quillen, A. C., Blackman, E. G., Frank, A., Varnière, P., 2004, ApJ, 612, 137
- (83) Ratzka, Th., 2005, PhD thesis, Ruprecht-Karls-Universität Heidelberg, Germany
- (84) Ratzka, Th., Leinert, Ch., Henning, Th., et al., 2007, A&A, 471, 173
- (85) Ratzka, Th., Schegerer, A. A., Leinert, Ch., et al., 2009, A&A, 502, 623
- (86) Rice, W. K. M., Wood, K., Armitage, P. J., Whitney, B. A., Bjorkman, J. E., 2003, MNRAS, 342, 79
- (87) Rodmann, J., Henning, Th., Chandler, C. J., Mundy, L. G., & Wilner, D. J., 2006, A&A, 446, 211
- (88) Sandell, G., Weintraub, D. A., & Hamidouche, M., 2011, ApJ, 727, 26
- (89) Sauter, J., Wolf, S., Launhardt, R., et al., 2009, A&A, 505, 1167
- (90) Schegerer, A., Wolf, S., Voshchinnikov, N. V., Przygodda, F., & Kessler-Silacci, J. E. 2006, A&A, 456, 535
- (91) Schegerer, A. A., Wolf, S., Ratzka, Th., & Leinert, Ch., 2008, A&A, 478, 779
- (92) Schegerer, A. A., in Junge Planetensysteme, 2008 (Vdm Verlag Dr. Müller)
- (93) Schegerer, A. A., Wolf, S., Hummel, C. A., Quanz, S. P., Richichi, A., 2009, A&A, 502, 367
- (94) Schegerer, A. A., & Wolf, 2010, A&A, 517, 87
- (95) Schloerb, F. P., Berger, J.-P., Carleton, N. P., et al., 2006, SPIE, 6268, 18
- (96) Setiawan, J., Henning, Th., Launhardt, R., Müller, A., Weise, P., & Kürster, M., 2008, Natur, 451, 38
- (97) Shakura, N. I., & Sunyaev, R. A., 1973, AAP, 24, 337
- (98) Sicilia-Aguilar, A., Hartmann, L., Fürész, G., Henning, Th., Dullemond, C., & Brandner, W., 2006, AJ, 132, 2135
- (99) Sicilia-Aguilar, A., Bouwman, J., Juhász, A., et al., 2009, ApJ, 701, 1188
- (100) Sylvester, R. J., Skinner, C. J., Barlow, M. J., & Mannings, V., 1996, MNRAS, 279, 915
- (101) Takeuchi, T., & Lin, D. N. C., 2003, ApJ, 593, 524
- (102) Thamm, E., Steinacker, J., & Henning, Th., 1994, A&A, 287, 493
- (103) Traub, W. A., 1998, Proc. SPIE, 3350, 848
- (104) Traub, W. A., Ahearn, A., Carleton, N. P., et al., 2003, Proc. SPIE, 4838, 45
- (105) Uchida, Y., & Shibata, K. 1984, PASJ, 36, 105
- (106) Valenti, J. A., & Fischer, D. A., 2005, ApJS, 159, 141
- (107) van Boekel, R., Min, M., Leinert, Ch., et al., 2004, Nat., 432, 479
- (108) van Boekel, R., Min, M., Waters, L. B. F. M., et al., 2005, A&A, 437, 189
- (109) Vieira, S. L. A., Corradi, W. J. B., Alencar, S. H. P., et al., 2003, AJ, 126, 2971
- (110) Vinkovic, D., 2012, MNRAS, 420, 1541
- (111) Weigelt, G., Kraus, S., Driebe, T., et al., 2007, A&A, 464, 87
- (112) Weinberger, A. J., Becklin, E. E., Schneider, G., et al., 1999, ApJ, 525, 53
- (113) Wolf, S., Henning, Th., & Stecklum, B. 1999, A&A, 349, 839
- (114) Wolf, S., & Voshchinnikov, N. V. 2004, CoPhC, 162, 113
- (115) Wünsch, R., Klahr, H., & Różyczka, M., 2005, MNRAS, 362, 361
- (116) Youdin, A. N., & Shu, F. H., 2002, ApJ, 580, 494
- (117) Zacharias, N., Monet, D. G., Levine, S. E., et al., 2005, AAS, 205, 4815
Appendix A Previous measurements
HD 142666, that is also known as V 1026 Sco, was classified as Herbig Ae/Be-star by Gregorio-Hetem et al. (gregorio-hetem (1992)). It has a spectral type of A 7 III (e.g., Blondel et al. blondel (2006)). The source belongs to the star formation region R 1 in Scorpius (Vieira et al. vieira (2003)). According to Meeus et al. (meeus (2001)), HD 142666 is a group-II object whose disk is flat. The object is a photometrically variable UX Ori star (Natta et al. nattaVI (1997)), i.e., dust clouds with a size in the range of the stellar diameter move into the line of sight of the observer from time to time. The extinction then increases and the stellar light can be reddened depending on the absorbing material. Considering polarimetric measurements (Hales et al. hales (2006)) and the high variability of the flux in the NIR and visual wavelength range (; Meeus et al. meeusII (1998)), the disk is assumed to be inclined. The approximate age of the object is million years (Natta et al. nattaVI (1997)). Millimeter measurements indicate this age, as well. The low decrease in the millimeter flux towards longer wavelengths could be a hint of cm-sized dust grains (Natta et al. nattaII (2004)). Br measurements showed that the circumstellar disk around HD 142666 is still active with an accretion rate of (Garcia-Lopez et al. garcia-lopez (2006)).
| wavelength | flux | refs. |
|---|---|---|
| () | (Jy) | |
| 1 | ||
| 1 | ||
| 1 | ||
| 2 | ||
| 2 | ||
| 2 | ||
| 3 | ||
| 3 | ||
| 3 | ||
| 4 | ||
| 4 | ||
| 4 | ||
| 3 | ||
| 5 | ||
| 3 | ||
| 5 | ||
| 3 | ||
| 6 | ||
| 3 | ||
| 6 | ||
| 6 | ||
| 6 |
AS 205, also known as V866 Scorpii, is a member of the Upper Scorpius association, West from the Ophiuc star forming region (Reipurth & Zinnecker 1993). As formerly observed by Herbig & Rao (1974), AS 205 has an infrared companion at a position angle of and at an angular distance of ”, i.e., at a projected distance of (Prato et al. 2003). Observations in the I and NIR bands could spatially resolve both components with the northern component as the brighter source (Reipurth & Zinnecker 1993; Liu et al. 1996). Visual and NIR Speckle-interferometric observations (Koresko koreskoII (2002)) as well as spectrally highly resolving measurements (Eisner et al. 2005), have shown that the southern component is a close binary system (angular distance ”, position angle ), as well. Both components of this system have similar brightnesses in the R and I bands and similar stellar properties ( and ; and ; and , respectively; Eisner et al. 2005). Although the age of the entire system is still discussed, it is assumed that all the components have simultaneously formed by fragmentation from the same region of the molecular cloud. The northern and southern components show hints of accretion (Cohen & Kuhi 1979; Prato et al. 1997; Eisner et al. 2005). Johns-Krull et al. (2000) have derived an accretion rate of from the profile of the C IV line of the northern component. Considering the high activity and variability of the source which has been known for years already, Welin (1976) assumed that AS 205 is a good candidate for future FU Ori variability outbursts.
| AS 205 N | AS 205 S | ||
| wavelength | flux | flux | refs. |
| () | (Jy) | (Jy) | |
| 1 | |||
| 1 | |||
| 1 | |||
| / | 2 | ||
| 1 | |||
| 1 | |||
| – | 1 | ||
| – | 1 | ||
| – | 1 | ||
| 3 | |||
| 3 | |||
| 3 | |||
| 3 | |||
| 4 | |||
| 4 | |||
| 5 | |||
| 5 | |||
| 4 | |||
| 5 | |||
| 6 | |||
| 6 | |||
| 6 | |||
| 7 | |||
| 6 | |||