Hard X-ray spectra of AGN in the INTEGRAL complete sample
Abstract
In this paper, we present the hard X-ray spectral analysis of a complete sample of AGN detected by INTEGRAL/IBIS. In conjunction with IBIS spectra, we make use of Swift/BAT data, with the aim of cross-calibrating the two instruments, studying source variability and constraining some important spectral parameters. We find that flux variability is present in at least 14% of the sample, while spectral variability is found only in one object. There is general good agreement between BAT and IBIS spectra, despite a systematic mismatch of about 22% in normalisation. When fitted with a simple power-law model, type 1 and type 2 sources appear to have very similar average photon indices, suggesting that they are powered by the same mechanism. As expected, we also find that a simple power-law does not always describe the data sufficiently well, thus indicating a certain degree of spectral complexity, which can be ascribed to features like a high energy cut-off and/or a reflection component. Fixing the reflection to be 0, 1 or 2, we find that our sample covers quite a large range in photon indices as well as cut-off energies; however, the spread is due only to a small number of objects, while the majority of the AGN lie within well defined boundaries of photon index (12) and cut-off energy (30Ecut300 keV).
keywords:
Galaxies – AGN – X-rays – Gamma-rays.1 Introduction
The study of active galactic nuclei (AGN) above 10 keV is essential if one wants to study non-thermal processes and observe those sources which are strongly affected by absorption in the soft X-ray band. Another advantage is the possibility of having information on spectral features such as the high energy cut-off and the reflection fraction, which cannot be explored with observations performed below 10 keV. The determination of these parameters is important for many reasons: they provide an insight into the physical properties of the region around the central power source, they play a key role in synthesis models of the cosmic X-ray background and are important ingredients for unification theories and torus studies (e.g Urry & Padovani 1995; Elitzur & Shlosman 2006; Elitzur 2012). Although high energy measurements of AGN have been made in the past, mainly with the BeppoSAX satellite (e.g. Perola et al. 2002; Dadina 2007), these did not generally pertain to a large and complete sample of sources and were limited to a few bright nearby objects. This trend is now changing since the launch of facilities like INTEGRAL (Winkler et al., 2003) and Swift (Gehrels et al., 2004), both having imaging and spectroscopy capabilities on a large field of view. Indeed, both IBIS (Ubertini et al., 2003) on board INTEGRAL and BAT (Barthelmy et al., 2005) on board Swift have been surveying the high energy sky for many years now, providing many detections of both new and previously known active galaxies, which can now be studied in a systematic way for the first time above 10 keV.
Cross-calibration between BAT and IBIS is important if one wants to enhance the signal-to-noise ratio or to study source variability over long timescales. Once calibrated, data from both instruments can be used alone or in conjunction with low energy observations to obtain broadband information and to put stronger constraints on spectral parameters.
In this paper, we present the hard X-ray spectral analysis, conducted in the 17–150 keV energy range, of a complete sample of 87 AGN detected by INTEGRAL/IBIS (Malizia et al., 2009). For 80 of these sources we also used BAT data, with the aim of cross-calibrating the two instruments, studying source variability and constraining the primary continuum. This work can also be useful for future exploitation of the IBIS/BAT AGN archive in conjunction with low energy instrument data, for example as an aid to NuSTAR observations.
2 Complete Sample and Data Analysis
The INTEGRAL complete sample of AGN has been extracted from a set of sources listed in the third IBIS survey (Bird et al., 2007) and having a firm identification with an AGN. This complete sample consists of 87 active galaxies of various optical classifications: 41 type 1 AGN (Seyfert 1, 1.2 and 1.5), 33 type 2 AGN (Seyfert 1.9 and 2), 5 narrow line Seyfert 1s (NLSy1s) and 8 Blazars (QSOs and BL Lacs). Full details on the extraction of the complete sample are given in Malizia et al. (2009). Table 1 lists relevant information (source name, Galactic column density, redshift and AGN class) for all objects in the sample. The INTEGRAL/IBIS data reported here consist of several pointings performed in the period comprised between launch (October 2002) and the end of April 2008, for a total of almost 40000 science windows. IBIS/ISGRI images for each available pointing were generated in various energy bands using the ISDC offline scientific analysis software OSA (Goldwurm et al., 2003) version 7.0. Count rates at the position of the source were extracted from individual images using data from the ISGRI detector (Lebrun et al., 2003) in order to provide light curves in various energy bands; from these light curves, average fluxes were then extracted and combined to produce an average, 14 channels (covering the 17 keV to 300 keV energy range), source spectrum (see Bird et al. 2007 and Bird et al. 2010 for details). This spectral extraction has been adopted to deal with the large number of objects listed in the survey. This method has also been fully tested over the 20–100 keV band in a number of studies of AGN spectral properties (e.g. Molina et al. 2009). Swift/BAT spectra were retrieved on the web111http://swift.gsfc.nasa.gov/docs/swift/results/bs58mon/; these spectra are from the first 58 months of operations of the Swift/BAT telescope (Baumgartner et al., 2010) and provide information over the 14–195 keV band (note that the spectra have an 8 channel binning). In order to overlap with IBIS data and cross-calibrate the two instruments, we explore here a slightly narrower energy band (17–150 keV).
BAT and IBIS spectra have been fitted with XSPEC version 12.7.1, using the statistics, assuming that the data are Gaussian; in the following analysis, each parameter error is quoted at 90% confidence level (=2.71).
| Name | N | z | type | Name | N | z | type |
|---|---|---|---|---|---|---|---|
| 1022 cm-2 | 1022 cm-2 | ||||||
| IGR J00333+6122 | 0.55 | 0.1050 | Sy 1.5 | 4U 1344-60 | 1.07 | 0.0130 | Sy 1.5 |
| 1ES 0033+595 | 0.04 | 0.0860 | BL Lac | IC 4329A | 0.04 | 0.0160 | Sy 1.2 |
| NGC 788 | 0.02 | 0.0136 | Sy 2 | Circinus Galaxy | 0.56 | 0.0014 | Sy 2 |
| NGC 1068 | 0.03 | 0.0038 | Sy 2 | NGC 5506 | 0.04 | 0.0062 | Sy 1.9 |
| QSO B0241+62 | 0.75 | 0.0440 | Sy 1 | ESO 511-G030 | 0.05 | 0.0224 | Sy 1 |
| NGC 1142 | 0.06 | 0.0288 | Sy 2 | IGR J14515-5542 | 0.53 | 0.0180 | Sy 2 |
| B3 B0309+411B | 0.13 | 0.1360 | Sy 1 | IC 4518A | 0.09 | 0.0163 | Sy 2 |
| NGC 1275 | 0.15 | 0.0175 | Sy 2 | IGR J16024-6107 | 0.29 | 0.0110 | Sy 2 |
| 3C 111 | 0.32 | 0.0485 | Sy 1 | IGR J16119-6036 | 0.23 | 0.0160 | Sy 1 |
| LEDA 168563 | 0.54 | 0.0290 | Sy 1 | IGR J16185-5928 | 0.25 | 0.0350 | NLSy1 |
| 4U 0517+17 | 0.22 | 0.0179 | Sy 1.5 | IGR J16351-5806 | 0.25 | 0.0091 | Sy 2 |
| MCG+08-11-011 | 0.20 | 0.0205 | Sy 1.5 | IGR J16385-2057 | 0.12 | 0.0269 | NLSy1 |
| Mkn 3 | 0.08 | 0.0135 | Sy 2 | IGR J16426+6536 | 0.03 | 0.3230 | NLSy1 |
| Mrk 6 | 0.06 | 0.0188 | Sy 1.5 | IGR J16482-3036 | 0.18 | 0.0310 | Sy 1 |
| IGR J07565-4139 | 0.47 | 0.0210 | Sy 2 | IGR J16558-5203 | 0.30 | 0.0540 | Sy 1.2 |
| IGR J07597-3842 | 0.60 | 0.0400 | Sy 1.2 | Swift J1656.3-3302 | 0.22 | 2.4000 | Blazar |
| ESO 209-12 | 0.19 | 0.0396 | Sy 1.5 | NGC 6300 | 0.09 | 0.0037 | Sy 2 |
| QSO B0836+710 | 0.03 | 2.1720 | Blazar | GRS 1734-292 | 0.77 | 0.0214 | Sy 1 |
| FRL 1146 | 0.40 | 0.0316 | Sy 1.5 | 2E 1739.1-1210 | 0.21 | 0.0370 | Sy 1 |
| Swift J0917.2-6221 | 0.19 | 0.0573 | Sy 1 | IGR J17488-3253 | 0.53 | 0.0200 | Sy 1 |
| MCG-05-23-16 | 0.08 | 0.0085 | Sy 2 | IGR J17513-2011 | 0.35 | 0.0470 | Sy 1.9 |
| IGR J09523-6231 | 0.27 | 0.2520 | Sy 1.9 | IGR J18027-1455 | 0.50 | 0.0350 | Sy 1 |
| Swift J1009.3-4250 | 0.11 | 0.0330 | Sy 2 | IGR J18249-3243 | 0.12 | 0.3550 | Sy 1 |
| NGC 3281 | 0.06 | 0.0115 | Sy 2 | IGR J18259-0706 | 0.62 | 0.0370 | Sy 1 |
| Swift J1038.8-4942 | 0.23 | 0.0600 | Sy 1.5 | PKS 1830-211 | 0.22 | 2.5070 | Blazar |
| IGR J10404-4625 | 0.14 | 0.2392 | Sy 2 | ESO 103-35 | 0.08 | 0.0133 | Sy 2 |
| NGC 3783 | 0.08 | 0.0097 | Sy 1 | 3C 390.3 | 0.04 | 0.0561 | Sy 1 |
| IGR J12026-5349 | 0.16 | 0.0280 | Sy 2 | 2E 1853.7+1534 | 0.39 | 0.0840 | Sy 1 |
| NGC 4151 | 0.02 | 0.0033 | Sy 1.5 | IGR J19378-0617 | 0.15 | 0.0106 | NLSy1 |
| 4C 04.42 | 0.02 | 0.9650 | QSO | NGC 6814 | 0.13 | 0.0052 | Sy 1.5 |
| Mrk 50 | 0.02 | 0.0234 | Sy 1 | Cyg A | 0.35 | 0.0561 | Sy 2 |
| NGC 4388 | 0.03 | 0.0084 | Sy 2 | IGR J20186+4043 | 1.20 | 0.0144 | Sy 2 |
| 3C 273 | 0.02 | 0.1583 | QSO | 4C 74.26 | 0.12 | 0.1040 | Sy 1 |
| NGC 4507 | 0.07 | 0.0118 | Sy 2 | S5 2116+81 | 0.07 | 0.0840 | Sy 1 |
| LEDA 170194 | 0.04 | 0.0360 | Sy 2 | IGR J21247+5058 | 1.11 | 0.0200 | Sy 1 |
| NGC 4593 | 0.02 | 0.0090 | Sy 1 | Swift J2127.4+5654 | 0.79 | 0.0140 | NLSy1 |
| IGR J12415-5750 | 0.30 | 0.0244 | Sy 1 | RX J2135+4728 | 0.32 | 0.0250 | Sy 1 |
| 3C 279 | 0.02 | 0.5362 | Blazar | NGC 7172 | 0.02 | 0.0087 | Sy 2 |
| NGC 4945 | 0.16 | 0.0019 | Sy 2 | BL Lac | 0.21 | 0.0686 | BL Lac |
| IGR J13091+1137 | 0.02 | 0.0251 | Sy 2 | MR 2251-178 | 0.03 | 0.0640 | Sy 1 |
| IGR J13109-5552 | 0.22 | 0.0850 | Sy 1 | MCG-02-58-022 | 0.04 | 0.0469 | Sy 1.5 |
| Cen A | 0.09 | 0.0018 | Sy 2 | IGR J23308+7120 | 0.30 | 0.0370 | Sy 2 |
| MCG-06-30-015 | 0.04 | 0.0077 | Sy 1.2 | IGR J23524+5842 | 0.57 | 0.1640 | Sy 2 |
| NGC 5252 | 0.02 | 0.0230 | Sy 2 |
3 INTEGRAL/IBIS versus Swift/BAT: source variability
X-ray variability, both in flux and in spectral shape, is one of the most useful tools to probe the physical processes taking place in the surroundings of the central black hole, being related to the physical size and state of the X-ray emitting region. While AGN variability in the 2–10 keV energy range has been well studied, changes above 10 keV have been much less sampled. In the past, both CGRO/OSSE and BeppoSAX/PDS have conducted studies on AGN variability in the hard X-ray band, but none of these instruments had the possibility of performing the analysis on a complete sample of AGN. This is now possible using the present dataset: indeed, 80 out of 87 AGN listed in Table 1 have both IBIS and BAT data available, making average flux/shape comparison, instrument calibration and spectral studies possible.
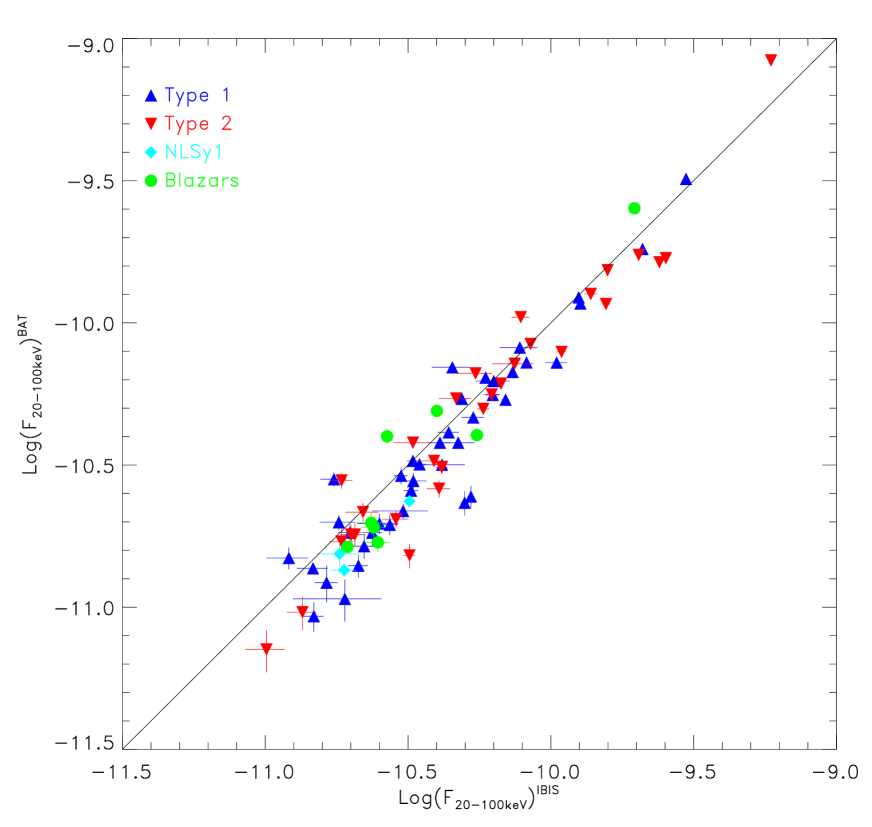
Despite being averaged over a long period, the two datasets have been derived from observations taken over different time intervals and so can be used to search for source variability, if present. The IBIS and BAT spectra have therefore been fitted individually, employing a simple power-law absorbed by intrinsic column density. Although the introduction of the intrinsic column density in the model might not greatly affect sources with small NH, heavy absorption as measured, for example, in Compton Thick (CT) objects, can have nonetheless an effect above 10 keV. Tables 2, 3 and 4 report the fit results for each class of objects and for both instruments, i.e. photon index, 20–100 keV flux, and degrees of freedom; NH values are those reported in Malizia et al. (2009).
Figure 1 shows the 20–100 keV IBIS versus BAT fluxes, both obtained from the individual power-law fits to the high energy spectra. It is quite evident from the plot that there are significant deviations from the 1:1 line, suggesting that above 10 keV long term variability is likely and is detected in all types of objects. Also evident from the figure is the tendency for many points to be located below the 1:1 line, especially for dimmer sources: this can be interpreted as a sign of some systematic differences between the two instruments.
To quantify this mismatch in normalisation, we have calculated the ratios FIBIS/FBAT for the entire sample and fit a gaussian to their distribution in order to estimate the mean and the relative error: we obtain a mean of 1.22 and an error of 0.036. We have then multiplied the BAT flux by this mean value, taking into account the errors and then calculated again FIBIS/FBAT to ensure that the new distribution is compatible within errors with a gaussian having mean 1 (the new value of the mean is 1.03 with an error of 0.03). In the following considerations, this corrected FBAT value will be considered.
To evaluate the presence of flux variability, we then estimated FIBIS-FBAT/, made the histogram of the values obtained and fitted a gaussian to it; at this point we estimated how many sources deviate from this gaussian significantly and are therefore likely to be variable. In particular, we consider a source to be variable if its 20–100 keV flux has changed by more than 3 between the two instruments flux averages. In this way, we find that 11 sources (see last column in Tables 2, 3 and 4) out of 80 (around 14% of the sample) have undergone a change in their flux. In particular, 4 of these variable AGN are type 1 sources, 2 are Blazars and 5 are type 2 objects. The amount of variability observed ranges from 0.5 to about a factor of 2. We emphasise again that these values are corrected for the systematic mismatch in normalization between the two instruments discussed above.
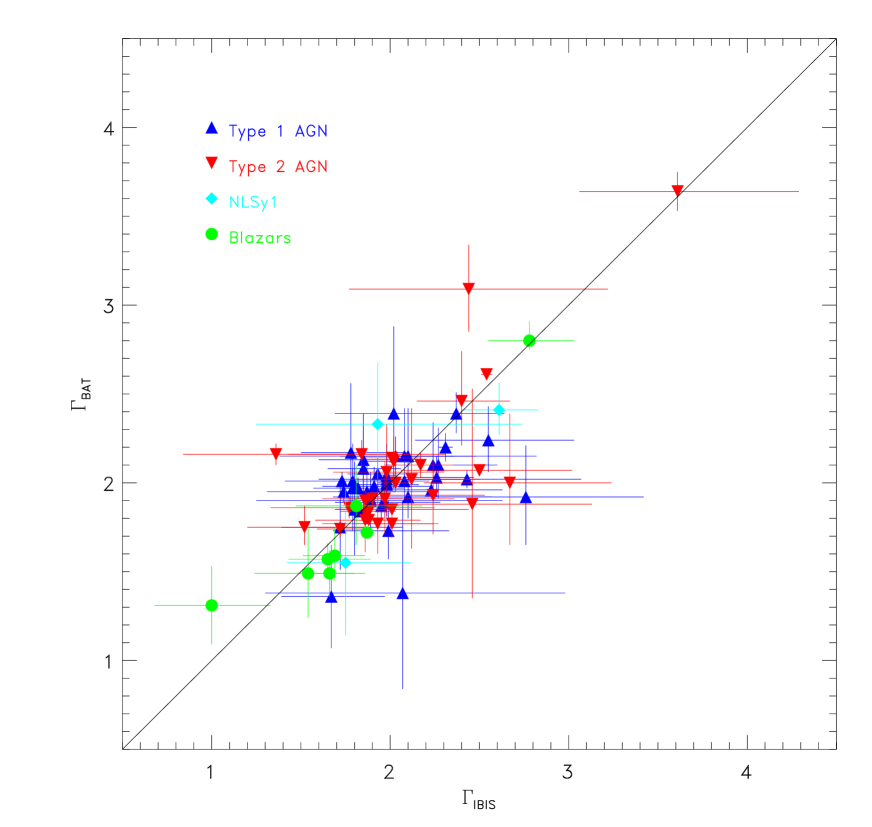
AGN flux variability at hard X-rays has been discussed by Beckmann et al. (2007) using Swift/BAT data for 44 bright AGN: they found that Blazars show stronger variability than type 1 and type 2 AGN, which instead exhibit 10% flux variations or more in at least one third of the sources analysed. The comparison between our results with those of Beckmann et al. (2007) is difficult, due to the different methods of analysis employed. We do not see more variability in Blazars than in Seyferts, and the fraction of variable sources is higher in their sample than in ours. While we would have expected flux changes to be smeared out when considering average fluxes over long timescales, we still find 11 variable sources, which suggests that flux variability is not uncommon at hard X-ray energies, although its amplitude is not dramatic. Therefore this should be taken as a warning when fitting together IBIS and BAT spectra. In order to investigate possible changes also in spectral shape, we plot vs. in Figure 2. It is quite clear from this plot that there is overall good agreement between the IBIS and BAT photon indices, suggesting that our sources are not affected, on average, by changes in their spectral shapes. Only a few sources seem to deviate from the 1:1 line, suggesting a possible change in their photon index between the observations performed by the two instruments. However, the errors on both sides are large, thus indicating that a more appropriate analysis is needed. To highlight these objects, we applied the same procedure described above for the flux comparison: we find that at 3 confidence level only one source, namely 3C 273, is spectrally variable between the BAT and the IBIS measurements. This makes any combined BAT/IBIS analysis difficult to perform and therefore 3C 273 will not be discussed further.
To summarise the comparison between the two data sets, we can say that there is, in general, a good agreement, apart from a few variable sources and a systematic difference in normalisation between the two instruments which can be quantified, at this stage, at around 22%. As a final remark, we note that in the following sections we concentrate our efforts on the BAT/IBIS combined spectral analysis; for this reason, and since we aim at a more in-depth study of our objects, sources for which no BAT spectra are available will not be discussed further. Their simple power-law fits to the IBIS data are nevertheless reported in Tables 2 and 3 for the sake of completeness.
| Name | NH | F | (d.o.f.) | F | (d.o.f.) | Var. | ||
| 1022cm-2 | 10-11 (cgs) | 10-11 (cgs) | ||||||
| IGR J00333+6122 | 0.85 | 1.78 | 1.480.12 | 3.8 (10) | 2.17 | 0.930.11 | 7.4 (5) | |
| QSO B0241+62 | 0.32 | 1.89 | 4.880.26 | 6.4 (10) | 1.91 | 5.410.13 | 7.9 (5) | |
| B3 0309+411 | 0.13 | 2.07 | 1.900.65 | 13.8 (10) | 1.38 | 1.060.18 | 3.9 (5) | |
| 3C 111 | 0.43 | 1.82 | 10.480.90 | 10.7 (10) | 1.97 | 7.250.14 | 2.6 (5) | |
| LEDA 168563 | 0.54 | 2.10 | 4.740.67 | 9.3 (10) | 1.92 | 3.790.15 | 5.5 (5) | |
| 4U 0517+17 | 0.09 | 1.93 | 6.260.34 | 8.2 (10) | 2.05 | 5.580.17 | 6.3 (5) | |
| MCG+08-11-011 | 0.21 | 2.43 | 7.791.18 | 5.5 (10) | 2.02 | 8.190.16 | 29.8 (5) | |
| Mrk 6† | 4.79 | 1.97 | 4.090.36 | 16.1 (10) | 1.89 | 3.790.13 | 10.9 (5) | |
| IGR J07597-3842 | 0.60 | 2.26 | 3.470.21 | 16.4 (10) | 2.03 | 3.180.13 | 2.6 (5) | |
| ESO 209-12 | 0.24 | 1.85 | 2.120.17 | 6.2 (10) | 2.13 | 1.400.13 | 5.3 (5) | |
| FRL 1146 | 0.32 | 2.27 | 1.980.18 | 4.1 (10) | 2.10 | 1.830.13 | 11.1 (5) | |
| Swift J0917.2-6221 | 0.47 | 2.55 | 1.810.26 | 11.7 (10) | 2.24 | 1.990.12 | 4.3 (5) | |
| Swift J1038.8-4942 | 0.62 | 1.72 | 2.220.22 | 4.6 (10) | 1.75 | 1.640.16 | 5.3 (5) | |
| NGC 3783 | 1.15 | 2.23 | 12.690.16 | 19.8 (10) | 1.96 | 11.700.12 | 20.1 (5) | |
| NGC 4151† | 21.9 | 1.83 | 29.740.39 | 28.1 (10) | 1.84 | 32.100.11 | 166.8 (5) | V, 0.81 |
| Mrk 50 | 0.12 | 2.76 | 1.210.20 | 16.0 (10) | 1.92 | 1.490.13 | 2.7 (5) | |
| NGC 4593 | 0.02 | 1.95 | 6.940.22 | 13.6 (10) | 1.87 | 5.370.16 | 10.6 (5) | |
| IGR J12415-5750 | 0.30 | 1.99 | 1.740.18 | 12.7 (10) | 1.73 | 2.820.17 | 1.7 (5) | V, 0.54 |
| IGR J13109-5552 | 0.46 | 1.67 | 2.370.19 | 7.4 (10) | 1.36 | 1.830.20 | 1.6 (5) | |
| MCG-06-30-015 | 0.15 | 2.37 | 4.390.37 | 14.8 (10) | 2.39 | 4.120.16 | 17.6 (5) | |
| 4U 1344-60† | 42.6 | 2.08 | 7.350.18 | 26.8 (10) | 2.01 | 6.720.13 | 13.1 (5) | |
| IC 4329A | 0.35 | 1.98 | 20.950.42 | 43.7 (10) | 2.04 | 18.200.18 | 110.9 (5) | |
| ESO 511-G030 | 0.05 | 1.98 | 3.300.37 | 10.8 (10) | 2.02 | 2.780.19 | 6.5 (5) | |
| IGR J16119-6036 | 0.23 | 2.10 | 2.730.19 | 6.9 (10) | 2.15 | 1.950.16 | 5.4 (5) | |
| IGR J16185-5928 | 0.24 | 1.75 | 1.890.19 | 6.8 (10) | 1.55 | 1.350.07 | 2.3 (5) | |
| IGR J16385-2057 | 0.12 | 2.62 | 1.060.22 | 23.0 (10) | - | - | - | |
| IGR J16426+6536 | - | 4.52 | 1.550.56 | 14.4 (10) | - | - | - | |
| IGR J16482-3036 | 0.01 | 1.87 | 3.290.16 | 5.6 (10) | 1.95 | 3.270.03 | 1.3 (5) | |
| IGR J16558-5203† | 18.6 | 1.98 | 2.990.16 | 10.3 (10) | 1.99 | 2.900.20 | 4.2 (5) | |
| GRS 1734-292 | 0.21 | 2.31 | 8.220.09 | 40.6 (10) | 2.20 | 7.260.22 | 8.7 (5) | |
| 2E 1739.1-1210 | 0.15 | 1.85 | 3.240.19 | 8.2 (10) | 2.08 | 2.570.23 | 6.0 (5) | |
| IGR J17488-3253 | 0.34 | 1.79 | 5.250.10 | 38.5 (10) | 1.97 | 2.450.22 | 4.1 (5) | V, 1.87 |
| IGR J18027-1455 | 0.30 | 1.80 | 4.990.15 | 27.5 (10) | 1.85 | 2.330.23 | 0.4 (5) | V, 1.87 |
| IGR J18249-3243 | 0.14 | 2.06 | 0.570.18 | 27.0 (10) | - | - | - | |
| IGR J18259-0706 | 1.07 | 2.02 | 1.640.15 | 13.9 (10) | 2.39 | 1.220.18 | 1.8 (5) | |
| 3C 390.3 | 0.04 | 1.73 | 5.910.10 | 7.9 (10) | 2.01 | 6.420.13 | 7.3 (5) | |
| 2E 1853.7+1534 | 0.39 | 2.24 | 2.510.41 | 5.9 (10) | 2.10 | 1.970.16 | 2.7 (5) | |
| IGR J19378-0617 | 0.15 | 1.93 | 1.820.31 | 19.8 (10) | 2.33 | 1.540.15 | 3.7 (5) | |
| NGC 6814 | 0.13 | 1.91 | 5.350.48 | 8.2 (10) | 1.98 | 4.650.19 | 5.5 (5) | |
| 4C 74.26 | 0.14 | 2.03 | 4.160.84 | 14.7 (10) | 2.15 | 3.170.09 | 11.2 (5) | |
| S5 2116+81 | 0.24 | 1.89 | 3.040.67 | 10.8 (10) | 1.90 | 2.180.13 | 5.6 (5) | |
| IGR J21247+5058† | 7.76 | 1.98 | 12.510.17 | 26.9 (10) | 2.00 | 12.300.12 | 24.0 (5) | |
| Swift J2127.4+5654 | 0.79 | 2.61 | 3.200.16 | 10.5 (10) | 2.41 | 2.360.09 | 3.6 (5) | |
| RX J2135.9+4728 | 0.23 | 2.08 | 1.470.18 | 13.6 (10) | 2.15 | 1.370.01 | 2.5 (5) | |
| MR 2251-178 | 2.14 | 1.79 | 6.310.86 | 10.5 (10) | 2.01 | 6.240.12 | 15.2 (5) | |
| MCG-02-58-022 | 0.04 | 1.74 | 4.520.69 | 12.2 (10) | 1.95 | 6.980.14 | 7.5 (5) | |
| †: sources with complex absorption (partial covering), for which the highest value of the column density is reported. | ||||||||
| Name | NH | F | (d.o.f.) | F | (d.o.f.) | Var. | ||
|---|---|---|---|---|---|---|---|---|
| 1022 cm-2 | 10-11 (cgs) | 10-11 (cgs) | ||||||
| NGC 788 | 30.2 | 1.88 | 5.800.28 | 5.7 (10) | 1.84 | 4.980.15 | 16.0 (5) | |
| NGC 1068 | 1000 | 2.44 | 2.200.29 | 11.9 (10) | 3.09 | 2.160.16 | 4.3 (5) | |
| NGC 1142 | 44.7 | 2.01 | 6.210.42 | 7.2 (10) | 1.77 | 5.600.16 | 4.8 (5) | |
| NGC 1275 | 0.12 | 3.61 | 3.290.47 | 11.9 (10) | 3.64 | 3.790.07 | 10.6 (5) | |
| Mrk 3 | 100 | 1.72 | 10.900.45 | 6.5 (10) | 1.74 | 7.900.15 | 12.3 (5) | |
| IGR J07565-4139 | 0.59 | 1.89 | 1.310.18 | 8.3 (10) | - | - | - | |
| MCG-05-23-16 | 1.51 | 2.01 | 13.800.66 | 20.7 (10) | 2.14 | 12.630.14 | 98.5 (5) | |
| IGR J09523-6231 | 7.94 | 2.67 | 1.350.16 | 6.2 (10) | 2.00 | 0.960.13 | 5.0(5) | |
| Swift J1009.3-4250 | 26.9 | 1.97 | 2.870.30 | 2.3 (10) | 1.91 | 2.040.14 | 11.2 (5) | |
| NGC 3281 | 200 | 1.84 | 4.660.61 | 11.0 (10) | 2.16 | 5.420.16 | 23.4 (5) | |
| IGR J10404-4625 | 2.67 | 1.98 | 3.200.15 | 8.1 (10) | 2.06 | 1.520.15 | 3.3 (5) | V, 1.84 |
| IGR J12026-5349 | 3.31 | 2.02 | 4.150.20 | 7.7 (10) | 2.12 | 3.100.15 | 9.9 (5) | |
| NGC 4388 | 33.1 | 1.88 | 24.000.36 | 17.9 (10) | 1.79 | 16.330.14 | 11.5 (5) | V, 1.29 |
| NGC 4507 | 28.8 | 1.90 | 15.600.48 | 8.1 (10) | 1.91 | 11.640.18 | 51.1 (5) | |
| LEDA 170194 | 3.08 | 1.93 | 4.060.38 | 6.7 (10) | 1.77 | 2.610.18 | 9.0 (5) | |
| NGC 4945 | 400 | 1.87 | 25.280.27 | 54.3 (10) | 1.82 | 16.880.22 | 41.5 (5) | V, 1.31 |
| IGR J13091+1137 | 89 | 1.52 | 3.900.46 | 19.7 (10) | 1.75 | 3.270.15 | 17.1 (5) | |
| Cen A | 37.0 | 1.86 | 59.000.29 | 10.2 (10) | 1.90 | 83.730.18 | 51.0 (5) | V, 0.62 |
| NGC 5252 | 6.76 | 1.77 | 5.450.77 | 15.2 (10) | 1.86 | 6.640.15 | 3.0 (5) | |
| Circinus Galaxy | 400 | 2.54 | 20.300.18 | 186.7 (10) | 2.61 | 17.330.17 | 185.2 (5) | |
| NGC 5506 | 3.40 | 2.50 | 15.800.22 | 12.1 (10) | 2.07 | 15.310.17 | 198.5 (5) | |
| IGR J14515-5542 | 0.50 | 1.86 | 1.850.17 | 14.5 (10) | 1.79 | 2.790.18 | 10.8 (5) | |
| IC 4518A | 14.0 | 2.40 | 2.060.18 | 15.2 (10) | 2.46 | 1.800.17 | 10.3 (5) | |
| IGR J16024-6107 | 0.28 | 1.88 | 1.560.19 | 8.4 (10) | - | - | - | |
| IGR J16351-5806 | 370 | 2.12 | 1.850.18 | 10.9 (10) | 2.02 | 1.700.20 | 3.4 (5) | |
| NGC 6300 | 23.0 | 2.17 | 6.690.18 | 12.1 (10) | 2.10 | 6.110.17 | 30.3 (5) | |
| IGR J17513-2011 | 0.71 | 1.84 | 3.170.11 | 22.6 (10) | - | - | - | |
| ESO 103-35 | 20.0 | 1.36 | 7.471.23 | 7.6 (10) | 2.16 | 7.180.16 | 42.7 (5) | |
| Cyg A | 36.0 | 2.03 | 8.490.20 | 8.5 (10) | 2.00 | 8.430.13 | 25.0 (5) | |
| IGR J20186+4043 | 10.0 | 2.24 | 2.000.17 | 11.6 (10) | 1.93 | 1.800.15 | 7.8 (5) | |
| NGC 7172 | 8.50 | 2.01 | 7.850.56 | 5.1 (10) | 1.85 | 10.470.16 | 8.9 (5) | V, 0.66 |
| IGR J23308+7120 | 6.02 | 2.46 | 1.010.16 | 7.6 (10) | 1.88 | 0.710.12 | 5.2 (5) | |
| IGR J23524+5842 | 6.30 | 1.58 | 1.130.13 | 14.9 (10) | - | - | - |
| Name | F | (d.o.f). | F | (d.o.f.) | Var. | ||
|---|---|---|---|---|---|---|---|
| 10-11 (cgs) | 10-11 (cgs) | ||||||
| 1ES 0033+595 | 2.78 | 1.940.10 | 15.1 (10) | 2.80 | 1.630.08 | 6.8 (5) | |
| QSO B0836+710 | 1.65 | 5.510.36 | 11.4 (10) | 1.57 | 4.030.12 | 3.1 (5) | |
| 4C 04.42 | 1.00 | 2.350.26 | 6.8 (10) | 1.31 | 1.980.18 | 5.9 (5) | |
| 3C 273 | 1.87 | 19.620.20 | 10.9 (10) | 1.72 | 25.300.15 | 15.0 (5) | V, 0. 69 |
| 3C 279 | 1.54 | 2.400.24 | 10.1 (10) | 1.49 | 1.910.17 | 1.2 (5) | |
| Swift J1656.3-3302 | 1.69 | 2.670.13 | 3.2 (10) | 1.59 | 3.990.24 | 7.2 (5) | V, 0.59 |
| PKS 1830-211 | 1.66 | 3.990.16 | 14.0 (10) | 1.49 | 4.900.24 | 3.9 (5) | |
| BL Lac | 1.81 | 2.480.25 | 4.7 (10) | 1.87 | 1.690.13 | 4.7 (5) |
4 BAT and IBIS combined spectral analysis: cross-calibration and photon index distributions
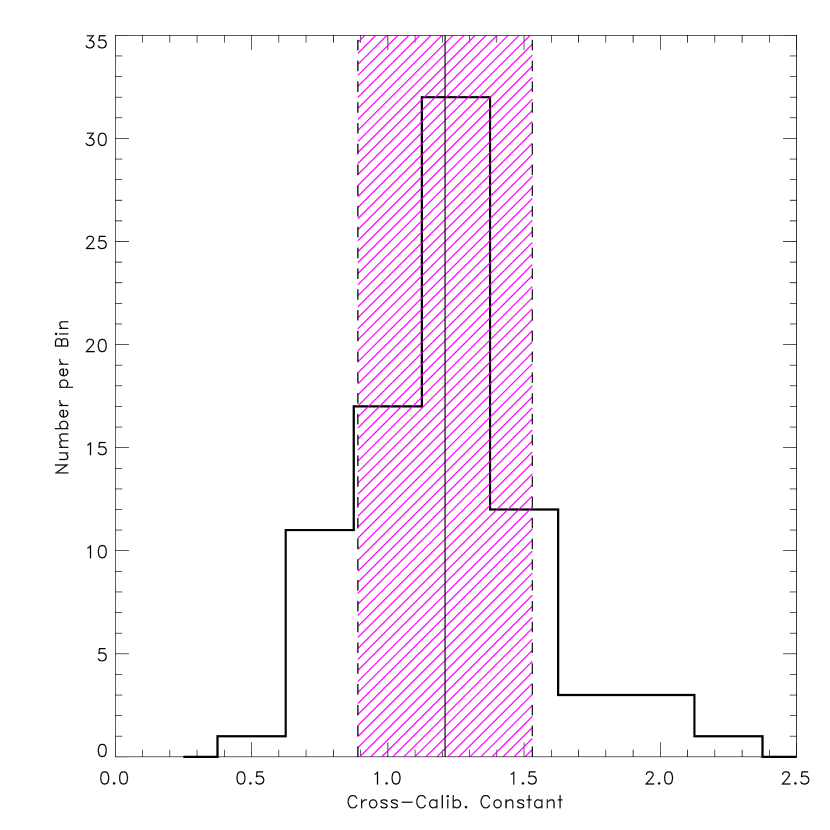
After the initial individual fits of IBIS and BAT spectra, we combined the two datasets and fit them together in XSPEC; this is justified by the lack of significant spectral variability, as discussed in the previous section. To take into account those few cases affected by flux changes and the likely mismatch between the IBIS and BAT spectra discussed above, we introduced a cross-calibration constant, C, in the fit. The model employed is a simple power-law, absorbed by an intrinsic column density, as done for the individual fits. The results of this analysis are reported in Tables 5, 6 and 7, where again we list source name, combined photon index , cross-calibration constant C, IBIS and BAT 20–100 keV flux, and degrees of freedom.
In Figure 3 the distribution of the cross-calibration constants is shown. The average value of C is 1.220.03 (solid vertical line in Figure 3), with a standard deviation of 0.32 (dashed lines and hatched area).
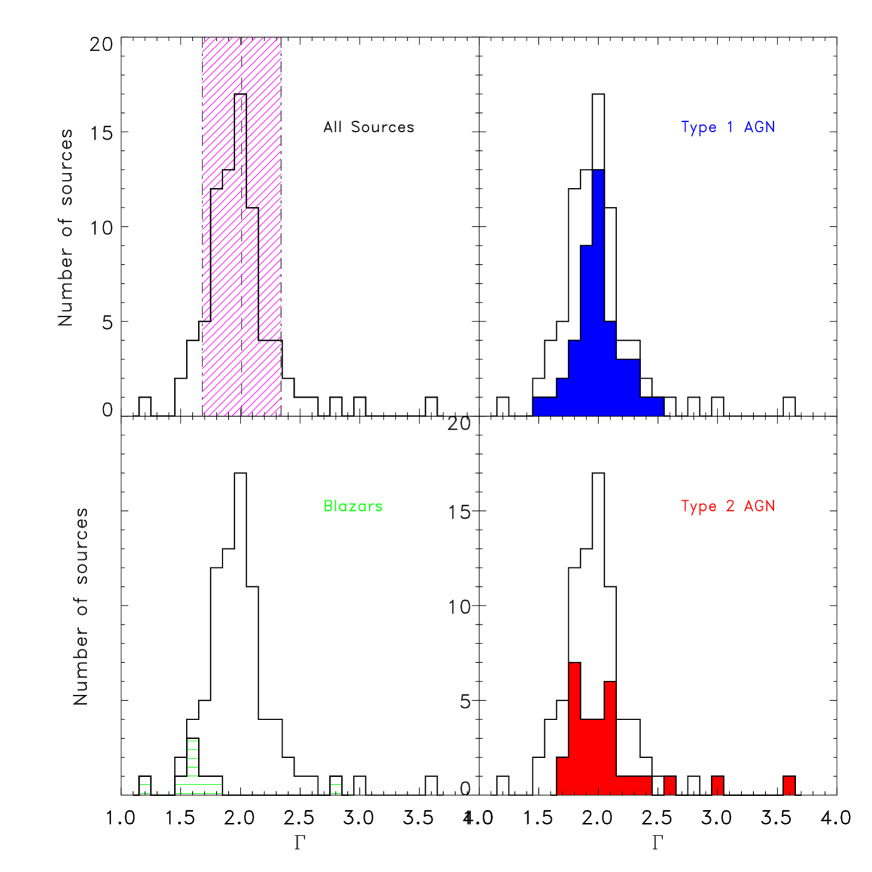
Figure 4 shows the photon index distribution for all 80 AGN in the sample and for each class of objects separately. Considering the entire sample, we find an average photon index of 2.010.04, with a standard deviation of 0.33. For type 1 and type 2 AGN we find =2.000.03 (=0.19) and =2.100.08 (=0.41) respectively, while for Blazars the average photon index is slightly flatter (=1.730.19, =0.50). Our results show that, at high energies, the primary continuum has a “canonical” shape, at least in non-Blazars sources, and further indicate that type 1 and type 2 AGN have overlapping ranges of photon indices, thus suggesting that the high energy emission is produced by the same mechanism.
Beckmann et al. (2009), who analysed a sample of 148 objects employing INTEGRAL/IBIS data, find that the underlying continuum of type 1 and 2 AGN is generally steep as found here but not exactly overlapping. In fact, they report =1.970.03 for Seyfert 1-1.5 and =1.880.02 for Seyfert 2. Similarly, Burlon et al. (2011), using Swift/BAT data of 199 AGN, obtained =2.070.03 (=0.27) for unobscured sources and =1.920.02 (=0.25) for obscured objects; contrary to our results, both these studies suggest that type 2/obscured sources could have a flatter spectral index than type 1/unobscured objects. The difference in the hard X-ray spectral slope between type 1 and 2 has been a point of discussion in the literature for some time now; it was first noted by Zdziarski et al. (1995) using Ginga and CGRO/OSSE data and later confirmed by other studies (Deluit & Courvoisier, 2003; Beckmann et al., 2006). This could be due to the fact that absorption may play a role even above 10 keV if the column density is very high, i.e. close to or in the Compton regime. The resulting effect is a flattening of the hard X-ray spectra of type 2 AGN; should absorption be properly accounted for, no major difference should be evident in the two samples. Indeed, if absorption is not considered in either class, the spectra of Seyfert 2 are flatter, although still consistent with those of Seyfert 1, leaving the issue still open.
We can also compare the mean photon index obtained for our type 1 AGN with that reported in the 2–10 keV band for the CAIXA catalogue (Bianchi et al., 2009). This catalogue consists of all radio-quiet, X-ray unobscured objects observed by XMM-Newton in targeted observations, and lists 156 sources. Albeit limited to only type 1 objects, this soft X-ray catalogue is the most compatible with our sample as it contains bright AGN similar to ours. The average 2–10 keV photon index for the CAIXA sample is =1.73 (=0.45), a much flatter value than that found by our analysis. Even when the CAIXA AGN are fitted with a model that takes into account Compton reflection, the average photon index does not steepen enough to meet our value, being 1.78 (=0.46); this strongly suggests that an extra component, such as a cut-off at high energies, is required to model AGN spectra. We note that other soft X-ray selected samples of AGN report a steeper average photon index (2; see, for example, Corral et al. 2011), but are generally made of weaker objects where spectral analysis is more difficult and uncertain.
| Name | CIBIS/BAT | F | F | (d.o.f.) | |
| 10-11 (cgs) | 10-11 (cgs) | ||||
| IGR J00333+6122 | 1.95 | 1.41 | 1.420.11 | 1.020.12 | 13.2 (16) |
| QSO B0241+62 | 1.91 | 0.91 | 4.850.27 | 5.420.13 | 14.4 (16) |
| B3 0309+411B | 1.59 | 2.05 | 2.040.69 | 1.020.17 | 19.1 (16) |
| 3C 111 | 1.96 | 1.42 | 10.100.91 | 7.270.14 | 14.0 (16) |
| LEDA 168563 | 1.94 | 1.33 | 4.920.74 | 3.770.15 | 15.2 (16) |
| 4U 0517+17 | 2.02 | 1.11 | 6.130.31 | 5.630.17 | 15.4 (16) |
| MCG+08-11-011 | 2.02 | 1.08 | 8.671.13 | 8.170.16 | 36.9 (16) |
| Mrk 6† | 1.89 | 1.12 | 4.180.33 | 3.780.13 | 27.2 (16) |
| IGR J07597-3842 | 2.09 | 1.20 | 3.630.22 | 3.100.12 | 21.7 (16) |
| ESO 209-12 | 2.01 | 1.41 | 2.040.16 | 1.480.13 | 13.2 (16) |
| FRL 1146 | 2.15 | 1.17 | 2.040.18 | 1.780.12 | 15.8 (16) |
| Swift J0917.2-6221 | 2.29 | 1.03 | 1.950.25 | 1.940.12 | 17.2 (16) |
| Swift J1038.8-4942 | 1.74 | 1.37 | 2.210.22 | 1.640.16 | 9.9 (16) |
| NGC 3783 | 1.96 | 1.18 | 1.350.16 | 1.160.02 | 41.4 (16) |
| NGC 4151† | 1.84 | 0.94 | 29.700.36 | 32.100.11 | 195.1 (16) |
| Mrk 50 | 2.11 | 1.09 | 1.460.22 | 1.370.12 | 23.4 (16) |
| NGC 4593 | 1.90 | 1.35 | 7.020.21 | 5.310.16 | 25.2 (16) |
| IGR J12415-5750 | 1.78 | 0.67 | 1.820.20 | 2.770.17 | 15.9 (16) |
| IGR J13109-5552 | 1.52 | 1.37 | 2.390.19 | 1.780.19 | 10.6 (16) |
| MCG-06-30-015 | 2.39 | 1.08 | 4.370.30 | 4.120.16 | 32.5 (16) |
| 4U 1344-60† | 2.04 | 1.14 | 7.450.15 | 6.630.13 | 41.1 (16) |
| IC 4329A | 2.03 | 1.15 | 20.700.41 | 18.300.18 | 156.7 (16) |
| ESO 511-G030 | 2.01 | 1.20 | 3.270.36 | 2.790.19 | 17.3 (16) |
| IGR J16119-6036 | 2.13 | 1.40 | 2.710.19 | 1.970.16 | 12.4 (16) |
| IGR J16185-5298 | 1.67 | 1.47 | 1.900.19 | 1.310.20 | 9.5 (16) |
| IGR J16482-3036 | 1.91 | 1.01 | 3.270.16 | 3.300.03 | 7.1 (16) |
| IGR J16558-5203† | 1.98 | 1.05 | 2.990.15 | 2.900.20 | 14.5 (16) |
| GRS 1734-292 | 2.29 | 1.20 | 8.270.08 | 7.070.21 | 53.2 (16) |
| 2E 1739.1-1210 | 1.95 | 1.22 | 3.170.19 | 2.660.24 | 15.6 (16) |
| IGR J17488-3253 | 1.81 | 2.11 | 5.240.10 | 2.520.23 | 44.0 (16) |
| IGR J18027-1455 | 1.81 | 2.14 | 4.980.15 | 2.360.24 | 28.0 (16) |
| IGR J18259-0706 | 2.17 | 1.22 | 1.580.14 | 1.320.20 | 16.9 (16) |
| 3C 390.3 | 1.99 | 0.87 | 5.480.38 | 6.450.13 | 18.4 (16) |
| 2E 1853.7+1534 | 2.17 | 1.36 | 2.550.16 | 1.910.15 | 9.2 (16) |
| IGR J19378-0617 | 2.29 | 1.14 | 1.740.29 | 1.560.16 | 22.5 (16) |
| NGC 6814 | 1.97 | 1.15 | 5.280.47 | 4.660.19 | 13.8 (16) |
| 4C 74.26 | 2.16 | 1.36 | 4.210.76 | 3.170.09 | 25.0 (16) |
| S5 2116+81 | 1.90 | 1.42 | 3.030.61 | 2.180.13 | 16.4 (16) |
| IGR J21247+5058† | 1.99 | 1.03 | 12.500.12 | 12.300.12 | 51.4 (16) |
| Swift J2127.4+5654 | 2.48 | 1.50 | 3.330.18 | 2.270.09 | 15.7 (16) |
| RX J2135.9+4728 | 2.12 | 1.07 | 1.450.16 | 1.380.14 | 16.1 (16) |
| MR 2251-178 | 2.00 | 0.97 | 5.930.89 | 6.250.12 | 26.3 (16) |
| MCG-02-58-022 | 1.95 | 0.62 | 4.250.06 | 6.990.14 | 20.2 (16) |
| †: see table 2. | |||||
| Name | CIBIS/BAT | F | F | (d.o.f.) | |
|---|---|---|---|---|---|
| erg cm-2 s-1 | erg cm-2 s-1 | ||||
| NGC 788 | 1.85 | 1.19 | 5.810.29 | 4.970.15 | 21.7 (16) |
| NGC 1068 | 3.04 | 0.96 | 2.050.33 | 2.190.17 | 15.4 (16) |
| NGC 1142 | 1.80 | 1.19 | 6.500.39 | 5.560.16 | 14.9 (16) |
| NGC 1275 | 3.64 | 0.82 | 3.020.33 | 3.790.07 | 22.5 (16) |
| Mrk 3 | 1.74 | 1.20 | 9.351.04 | 7.910.15 | 18.9 (16) |
| MCG-05-23-16 | 2.14 | 1.07 | 13.300.66 | 12.660.14 | 121.0 (16) |
| IGR J09523-6231 | 2.28 | 1.84 | 1.510.18 | 0.840.11 | 14.5 (16) |
| Swift J1009.3-4250 | 1.92 | 1.45 | 2.900.29 | 2.030.14 | 13.5 (16) |
| NGC 3281 | 2.15 | 0.80 | 4.280.60 | 5.440.16 | 35.6 (16) |
| IGR J10404-4625 | 2.03 | 2.10 | 3.160.32 | 1.540.15 | 11.2 (16) |
| IGR J12026-5349 | 2.08 | 1.32 | 4.080.16 | 3.150.16 | 18.2 (16) |
| NGC 4388 | 1.80 | 1.53 | 24.420.34 | 16.230.14 | 36.2 (16) |
| NGC 4507 | 1.91 | 1.36 | 15.580.47 | 11.650.18 | 59.3 (16) |
| LEDA 170194 | 1.82 | 1.66 | 4.170.33 | 2.560.18 | 16.1 (16) |
| NGC 4945 | 1.84 | 1.56 | 25.970.26 | 16.810.22 | 99.0 (16) |
| IGR J13091+1137 | 1.74 | 1.15 | 3.730.45 | 3.290.13 | 38.0 (16) |
| Cen A | 1.89 | 0.71 | 58.480.03 | 83.860.18 | 75.5 (16) |
| NGC 5252 | 1.85 | 0.82 | 5.360.75 | 6.640.13 | 18.2 (16) |
| Circinus Galaxy | 2.58 | 1.18 | 20.140.18 | 17.480.17 | 378.9 (16) |
| NGC 5506 | 2.07 | 1.17 | 17.622.11 | 15.300.15 | 213.1 (16) |
| IGR J14515-5542 | 1.81 | 0.68 | 1.870.19 | 2.780.18 | 25.3 (16) |
| IC 4518A | 2.43 | 1.15 | 2.050.16 | 1.830.16 | 25.5 (16) |
| IGR J16351-5806 | 2.05 | 1.13 | 1.880.19 | 1.690.18 | 13.7 (16) |
| NGC 6300 | 2.11 | 1.14 | 6.780.34 | 6.090.18 | 42.8 (16) |
| ESO 103-35 | 2.13 | 0.88 | 6.210.99 | 7.190.14 | 58.0 (16) |
| Cyg A | 2.01 | 1.03 | 8.540.17 | 8.400.13 | 33.8 (16) |
| IGR J20186+4043 | 2.05 | 1.23 | 2.080.17 | 1.730.14 | 21.8 (16) |
| NGC 7172 | 1.86 | 0.80 | 8.210.49 | 10.450.16 | 15.6 (16) |
| IGR J23308+7120 | 2.19 | 1.83 | 1.090.17 | 0.610.10 | 14.2 (16) |
| Name | CIBIS/BAT | F | F | (d.o.f.) | |
|---|---|---|---|---|---|
| erg cm-2 s-1 | erg cm-2 s-1 | ||||
| 1ES 0033+595 | 2.79 | 1.20 | 1.930.10 | 1.640.08 | 21.9 (16) |
| QSO B0836+710 | 1.58 | 1.41 | 5.580.37 | 4.020.12 | 14.8 (16) |
| 4C 04.42 | 1.20 | 1.17 | 2.320.25 | 2.010.18 | 14.3 (16) |
| 3C 279 | 1.52 | 1.28 | 2.410.24 | 1.900.17 | 11.4 (16) |
| Swift J1656.3-3302 | 1.64 | 0.69 | 2.680.13 | 3.960.24 | 10.8 (16) |
| PKS 1830-211 | 1.58 | 0.85 | 4.020.16 | 4.820.24 | 20.4 (16) |
| BL Lac | 1.83 | 1.47 | 2.470.25 | 1.710.14 | 9.4 (16) |
4.1 Spectral Complexity
Although a simple power-law model describes sufficiently well the data points for the majority of our sources, in some cases it does not fit the data properly. In fact, as can be seen from the fits reported in Tables 5 and 6, 28 sources or 30% of the sample (14 type 1 and 14 type 2 objects) have reduced 1.5, suggesting that a more complex model might be needed to describe their spectra. We have adopted a threshold value of 1.5 to discriminate between well and bad fitted objects, as there is only a probability of 10% of exceeding this value by chance, i.e. no more than 8 sources in the entire sample are expected to have a bad fit.
In the case of these 28 AGN, we have re-fitted the combined BAT/IBIS data using the pexrav model in XSPEC; this model takes into account features such as the high energy cut-off (Ecut) and/or the reflection fraction (R), which can both be present in the energy range probed by the present study. The reflection component depends on the inclination angle i between the axis perpendicular to the accretion disk and the line of sight: the smaller the inclination angle, the larger the resulting reflection component. Since the quality of the data does not allow to constrain both reflection and inclination at the same time, we have fixed cos(i) = 0.45 for both type 1 and 2 AGN.
In the first instance, we left all relevant parameters free to vary and report in the first row of Tables 8/9 and 10/11 the results of these fits; for each source, the tables list photon index, high energy cut-off, reflection fraction, cross-calibration constant, and degrees of freedom, as well as the probability of a fit improvement with respect to the simple power-law model reported in Tables 5 and 6. Although the fit improvement is significant in most cases, it is evident that it is quite difficult to put firm constraints on all free parameters, i.e. power-law photon index, high energy cut-off and reflection, at the same time. This is mainly due to the lack of data below 17 keV and the fact that unfortunately the parameters of interest are closely linked in the fitting procedure. Out of 28 AGN analysed, only in two cases (NGC 4151 and IC 4329A) it is possible to put constraints on all 3 parameters at the same time. In most other cases, only two out of three parameters analysed could be constrained, specifically the photon index with either the reflection (in the minority of the sources) or the high energy cut-off (in the majority of the objects). There are nevertheless some AGN in which neither R or Ecut could be constrained at all. This suggests that if one wants to get some spectral information from hard X-ray spectra alone, some assumptions must be made on at least one of the 3 parameters involved in the spectral analysis. For example, among type 1 sources, IGR J21247+5058 is a well studied source which is known to have little reflection (Molina et al., 2007; Tazaki et al., 2010); in this case, if we fix the reflection fraction to zero and leave both the photon index and the cut-off energy as free parameters, both quantities are indeed well constrained (see Table 8, 9) and are compatible with previous studies. On the other hand, the Circinus Galaxy (a Compton thick AGN) has a well-known cut-off energy located at around 50 keV, measured by several instruments such as BeppoSAX and XTE (e.g. Yang et al. 2009): fixing Ecut at this value, we are able to constrain both to be 1.80 and R to be 0.59. Unfortunately not all our sources are well studied at high energies as these two objects and so a more general approach has been adopted in order to deal with all 28 AGN. We therefore choose to fix the reflection component to be 0, 1, or 2; the higher value of R allows for the extra reflection often observed in AGN and likely due to a more complex or peculiar geometry, such as one in which a molecular torus is present alongside an accretion disk, more radiation is emitted toward the reflector than toward the observer or light bending effects are at work (Molina et al., 2009).
The results obtained with fixed values of reflection are reported in Tables 8/9 and 10/11, where again a significant fit improvement (close to 99% or more in at least one of the three cases of R analysed) is evident in many objects, when comparing these fits with single power-law ones; the improvement occurs in 75% of the sources, therefore leaving only a handful of AGN where the improvement is not as significant. In a couple of AGN, we could not obtain any constraints on the cut-off energy, presumably because it is located at higher energies than those probed by IBIS/BAT. Finally, in a small number of objects, i.e. 10 out of 28, the reduced obtained using the pexrav model is still above the threshold of 1.5 adopted in the present study, meaning that in these sources we have not yet achieved a good fit. These 10 AGN (4 type 1 and 5 type 2) are highlighted in Tables 8, 9 and 10, 11 and are discussed in more detail in the next section.
4.2 Further spectral considerations
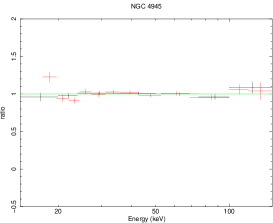
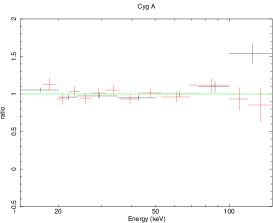
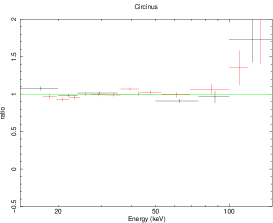
The fact that a number of sources are still badly fitted after substituting the simple power-law with the pexrav model could have various explanations, among which a certain degree of flux variability (see Tables 5/6) and/or poor quality data (either related to IBIS, BAT or both). In addition, there may be further spectral complexity like in Cygnus A, where the hot temperature of the surrounding cluster could have an effect on the source spectrum, even above 10 keV (Molina et al., 2006). However, a common problem that we find in these 9 cases is a divergence between model and data points at either low (i.e. around 17-20 keV) or high energies (i.e. above 100 keV). For instance, in NGC 4945 (Figure 5), the first IBIS point is causing problems to the fit, while in Cygnus A (Figure 6) the problem arises due to the last BAT spectral point. On the other hand, in the Circinus Galaxy (Figure 7), IBIS and BAT points track each other perfectly well, but both diverge from the model above 100 keV; given the good agreement between IBIS and BAT spectra, this could be a true feature of the source (which is of some scientific interest) or could be due to problems related for example to an incorrect background subtraction. This is not an uninteresting issue, which we intend to pursue as more data on this source become available. In order to test the aforementioned problem, we have refitted all 9 objects using the same approach described in section 4.1, but limiting the analysis to the 20–100 keV energy range. We find that the resulting fits become acceptable, at least in one of the various cases of R considered; the only exception are IGR J2124+5058 and the Circinus Galaxy, where the reduced still remains above 1.5. Inspection of the data-to-model ratios for these two sources indicates that the fits are nonetheless acceptable, suggesting that these may just be the 2-3 objects where the reduced is above 1.5 just by chance in a sample of 28 objects. As a final remark, we note that, in general, the parameter values obtained in this restricted energy range are consistent with those obtained in the 17–150 keV fits.
| Name | Ec (keV) | R | CIBIS/BAT | (d.o.f.) | prob.† | |
| MCG+08-11-011 | 1.51 | 38 | 3.67 | 1.05 | 9.4 (14) | 99.9% |
| 1.35 | 56 | 0f | 1.05 | 9.8 (15) | 99.9% | |
| 1.79 | 148 | 1f | 1.05 | 9.7 (15) | 99.9% | |
| 1.99 | 137 | 2f | 1.05 | 10.6 (15) | 99.9% | |
| Mrk 6 | 1.29 | 68 | 1.06 | 1.09 | 18.0 (14) | 94% |
| 1.29 | 68 | 0f | 1.09 | 18.0 (15) | 98.6% | |
| 1.70 | 76 | 1f | 1.09 | 20.5 (15) | 95.7% | |
| 1.87 | 118 | 2f | 1.09 | 22.0 (15) | 92.1% | |
| NGC 3783 | 1.94 | 100 | 0.82 | 1.18 | 20.3 (14) | 99.3% |
| 1.58 | 102 | 0f | 1.18 | 23.5 (15) | 99.6% | |
| 1.99 | 262 | 1f | 1.18 | 20.3 (15) | 99.9% | |
| 2.04 | 942 | 2f | 1.18 | 23.2 (15) | 99.6% | |
| NGC 4151 | 1.59 | 158 | 0.16 | 0.93 | 24.9 (14) | 99.9% |
| 1.59 | 151 | 0f | 0.93 | 25.0 (15) | 99.9% | |
| 1.91 | NC | 1f | 0.92 | 97.5 (15) | 99.9% | |
| 1.94 | NC | 2f | 0.92 | 278.7 (15) | 99.9% | |
| NGC 4593 | 1.48 | 100 | 0.39 | 1.33 | 15.9 (14) | 96% |
| 1.48 | 100 | 0f | 1.33 | 15.9 (15) | 99% | |
| 1.87 | 157 | 1f | 1.32 | 21.3 (15) | 94% | |
| 1.97 | NC | 2f | 1.32 | 25.0 (15) | 88% | |
| MCG-06-30-015 | 2.55 | 94 | NC | 1.07 | 20.4 (14) | 96% |
| 1.44 | 35 | 0f | 1.06 | 22.6 (15) | 97.8% | |
| 1.90 | 31 | 1f | 1.06 | 21.3 (15) | 98.7% | |
| 2.19 | 42 | 2f | 1.07 | 20.9 (15) | 98.9% | |
| 4U 1344-60 | 1.47 | 72 | 0.58 | 1.12 | 16.5 (14) | 99.8% |
| 1.47 | 72 | 0f | 1.12 | 15.5 (15) | 99.9% | |
| 1.84 | 202 | 1f | 1.12 | 20.8 (15) | 99.8% | |
| 1.99 | 181 | 2f | 1.12 | 23.9 (15) | 99.5% | |
| IC 4329A | 1.64 | 101 | 0.61 | 1.13 | 23.5 (14) | 99.9% |
| 1.35 | 57 | 0f | 1.13 | 28.1 (15) | 99.9% | |
| 1.76 | 143 | 1f | 1.13 | 23.9 (15) | 99.9% | |
| 1.95 | 335 | 2f | 1.13 | 27.2 (15) | 99.9% | |
| GRS 1734-292 | 1.98 | 60 | 1.41 | 1.19 | 17.5 (14) | 99.9% |
| 1.83 | 89 | 0f | 1.19 | 18.4 (15) | 99.9% | |
| 2.15 | 161 | 1f | 1.19 | 18.4 (15) | 99.9% | |
| 2.30 | NC | 2f | 1.19 | 20.8 (15) | 99.9% | |
| IGR J17488-3253 | 1.81 | NC | 0.07 | 2.11 | 44.0 (14) | … |
| 1.81 | NC | 0f | 2.11 | 44.0 (15) | … | |
| 1.81 | NC | 1f | 2.11 | 75.1 (15) | … | |
| 1.81 | NC | 2f | 2.11 | 92.4 (15) | … | |
| IGR J18027-1455 | 1.83 | NC | 0.15 | 2.17 | 28.3 (14) | … |
| 1.81 | NC | 0f | 2.14 | 28.0 (15) | … | |
| 1.81 | NC | 1f | 2.14 | 41.7 (15) | … | |
| 1.81 | NC | 2f | 2.14 | 49.1 (15) | … | |
| 4C 74.26 | 1.93 | 62 | 6.65 | 1.34 | 21.3 (14) | 85% |
| 1.69 | 0f | 1.34 | 21.6 (15) | 95% | ||
| 2.05 | 1f | 1.34 | 21.3 (15) | 95% | ||
| 2.20 | NC | 2f | 1.34 | 21.4 (15) | 95% | |
| †: F-test probability obtained from the comparison between the simple power-law fits and the | ||||||
| current model. | ||||||
| Note: sources with 1.5 are highlighted in bold typeface. | ||||||
| Name | Ec (keV) | R | CIBIS/BAT | (d.o.f.) | prob.† | |
| IGR J21247+5058 | 1.72 | 155 | 0.23 | 1.02 | 27.7 (14) | 98.8% |
| 1.72 | 155 | 0f | 1.02 | 27.7 (15) | 99.7% | |
| 2.03 | NC | 1f | 1.01 | 42.7 (15) | 89.9% | |
| 2.06 | NC | 2f | 1.01 | 67.0 (15) | … | |
| MR 2251-178 | 1.37 | 42 | 0.96 | 10.2 (14) | 99.9% | |
| 1.37 | 62 | 0f | 0.96 | 10.2 (15) | 99% | |
| 1.78 | 80 | 1f | 0.95 | 11.4 (15) | 99.9% | |
| 1.96 | 128 | 2f | 0.95 | 12.5 (15) | 99.9% | |
| †: F-test probability obtained from the comparison between the simple power-law fits and the | ||||||
| current model. | ||||||
| Note: sources with 1.5 are highlighted in bold typeface. | ||||||
| Name | Ec (keV) | R | CIBIS/BAT | (d.o.f.) | prob† | |
| MCG-05-23-16 | 1.65 | 72 | 2.82 | 1.04 | 20.6 (14) | 99.9% |
| 1.37 | 47 | 0f | 1.04 | 22.1 (15) | 99.9% | |
| 1.73 | 85 | 1f | 1.04 | 20.8 (15) | 99.9% | |
| 1.93 | 139 | 2f | 1.04 | 22.1 (15) | 99.9% | |
| NGC 3281 | 1.26 | 43 | 3.71 | 0.78 | 13.3 (14) | 99.9% |
| 1.24 | 42 | 0f | 0.78 | 13.2 (15) | 99.9% | |
| 1.57 | 68 | 1f | 0.78 | 14.3 (15) | 99.9% | |
| 1.74 | 96 | 2f | 0.78 | 15.1 (15) | 99.9% | |
| NGC 4388 | 1.60 | 202 | 0.23 | 1.52 | 13.4 (14) | 99.9% |
| 1.60 | 202 | 0f | 1.52 | 13.4 (15) | 99.9% | |
| 1.85 | NC | 1f | 1.52 | 27.2 (15) | 95.9% | |
| 1.88 | NC | 2f | 1.51 | 52.2 (15) | … | |
| NGC 4507 | 1.53 | 109 | 2.37 | 1.33 | 14.6 (14) | 99.9% |
| 1.34 | 72 | 0f | 1.34 | 15.8 (15) | 99.9% | |
| 1.63 | 145 | 1f | 1.33 | 14.8 (15) | 99.9% | |
| 1.79 | 150 | 2f | 1.33 | 16.1 (15) | 99.9% | |
| NGC 4945 | 1.37 | 101 | 2.18 | 1.56 | 27.5 (14) | 99.9% |
| 1.37 | 101 | 0f | 1.56 | 27.5 (15) | 99.9% | |
| 1.59 | 218 | 1f | 1.55 | 26.6 (15) | 99.9% | |
| 1.71 | 445 | 2f | 1.55 | 29.6 (15) | 99.9% | |
| IGR J13091+1137 | 1.09 | 68 | 1.02 | 1.14 | 29.8 (14) | 93.9% |
| 1.09 | 67 | 0f | 1.14 | 29.8 (15) | 93.9% | |
| 1.27 | 61 | 1f | 1.13 | 32.1 (15) | 88% | |
| 1.47 | 85 | 2f | 1.13 | 33.5 (15) | 82% | |
| Cen A | 1.89 | NC | 0.007 | 0.71 | 75.6 (14) | … |
| 1.89 | NC | 0f | 0.71 | 75.6 (15) | … | |
| 1.94 | NC | 1f | 0.70 | 841.1 (15) | … | |
| 1.96 | NC | 2f | 0.70 | 1649.9 (15) | … | |
| Circinus | 1.65 | 41 | 1.42 | 1.15 | 64.1 (14) | 99.9% |
| 1.50 | 34 | 0f | 1.15 | 65.0 (15) | 99.9% | |
| 1.81 | 51 | 1f | 1.15 | 65.3 (15) | 99.9% | |
| 2.00 | 68 | 2f | 1.15 | 69.0 (15) | 99.9% | |
| NGC 5506 | 2.01 | 88 | 8.90 | 1.14 | 15.0 (14) | 99.9% |
| 1.04 | 36 | 0f | 1.15 | 37.7 (15) | 99.9% | |
| 1.39 | 54 | 1f | 1.14 | 23.6 (15) | 99.9% | |
| 1.60 | 76 | 2f | 1.14 | 19.2 (15) | 99.9% | |
| †: F-test probability obtained from the comparison between the simple power-law fits and the | ||||||
| current model. | ||||||
| Note: sources with 1.5 are highlighted in bold typeface. | ||||||
| Name | Ec (keV) | R | CIBIS/BAT | (d.o.f.) | prob† | |
| IGR J14515-5542 | 1.36 | 74 | 1.05 | 0.69 | 23.67 (14) | 37% |
| 1.40 | 46 | 0f | 0.69 | 23.66 (15) | 67% | |
| 1.77 | 1f | 0.68 | 26.29 (15) | … | ||
| 1.84 | 150 | 2f | 0.68 | 27.56 (15) | … | |
| IC 4518A | 0.65 | 20 | 31 | 1.10 | 11.74 (14) | 99.9% |
| 0.61 | 20 | 0f | 1.10 | 11.70 (15) | 99.9% | |
| 0.85 | 24 | 1f | 1.10 | 12.67 (15) | 99.8% | |
| 1.11 | 30 | 2f | 1.10 | 13.16 (15) | 99.8% | |
| NGC 6300 | 2.18 | 518 | 0.49 | 1.11 | 12.27 (14) | 99.9% |
| 1.25 | 44 | 0f | 1.10 | 16.66 (15) | 99.98% | |
| 1.57 | 71 | 1f | 1.10 | 14.04 (15) | 99.9% | |
| 1.67 | 88 | 2f | 1.10 | 13.22 (15) | 99.9% | |
| ESO 103-G35 | 1.81 | 31 | 34.23 | 0.82 | 14.31 (14) | 99.9% |
| 1.17 | 38 | 0f | 0.82 | 16.52 (15) | 99.9% | |
| 1.51 | 61 | 1f | 0.82 | 14.80 (15) | 99.9% | |
| 1.63 | 74 | 2f | 0.82 | 14.44 (15) | 99.9% | |
| Cyg A | 2.01 | NC | 0.09 | 1.03 | 33.85 (14) | … |
| 2.01 | NC | 0f | 1.03 | 33.85 (15) | … | |
| 2.04 | NC | 1f | 1.03 | 63.52 (15) | … | |
| 2.06 | NC | 2f | 1.02 | 86.16 (15) | … | |
| †: F-test probability obtained from the comparison between the simple power-law fits and the | ||||||
| current model. | ||||||
| Note: sources with 1.5 are highlighted in bold typeface. | ||||||
5 The high energy continuum and its cut-off energy
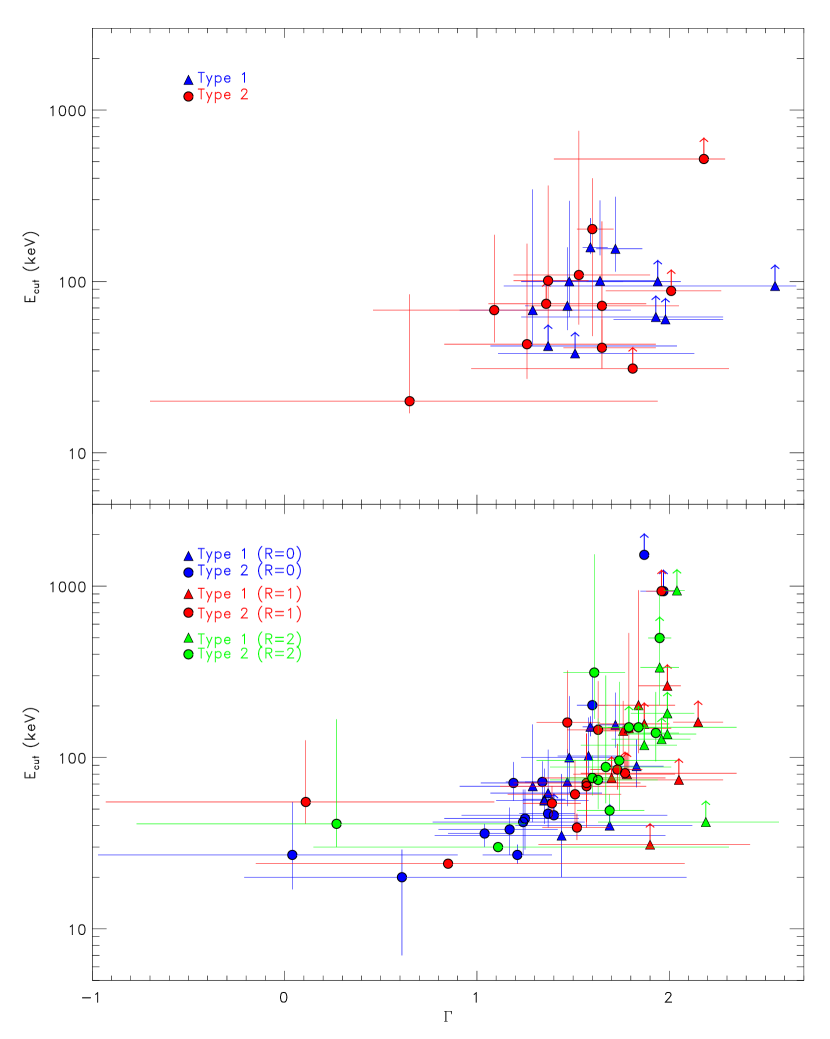
In Figure 8, we show the high energy cut-off (Ecut) vs. the photon index for the AGN where these two quantities could be measured (data are either from Table 8/ 9 and 10/11); in the figure upper panel, we show the parameter space obtained when leaving R as a free parameter in the fits, while in the lower panel, we show the parameter space obtained when R is allow to have only the values of 0, 1 and 2. Different colouring and symbols reflect the different R values assumed and the different AGN types analysed. One thing which is immediately evident is that the two figures are fully compatible, suggesting that the choice of fixing R is acceptable if one wants to have more precise information on a large sample of sources. The second evident thing is the banana shape of the space covered by the parameters explored in both plots; this is a clear sign of the inter-relation between the two analysed quantities, in the sense that flatter spectra provide lower cut-off energies than steeper ones. This again underlines the difficulties of extracting spectral information from the analysis of narrow band data. From the figure, it is also evident that the sample covers quite a large range in photon indices as well as cut-off energies; however, as can be seen in the lower panel of Figure 8, the spread is due only to a small number of objects (20% of the sample) while the majority of our AGN lies within well defined boundaries of photon index (12) and cut-off energy (30Ecut300 keV). In fact, the average power-law photon index and high energy cut-off for all AGN where both could be measured are = 1.39, 1.62, 1.75 ( = 0.39 in each case) and Ecut = 215, 204, 205 keV ( = 368, 274, 295 keV) assuming R = 0, 1, and 2 respectively; note that lower limits on the high energy cut-off have been considered.
Our results are in line with BeppoSAX observations which indicate a spread in Ecut from about 50 keV up to around 300 keV (Perola et al., 2002; Dadina, 2008); they also agree with the results of Beckmann et al. (2009), but are barely consistent with those obtained by Ricci et al. (2011), who locate the cut-off energy above 200-300 keV.
The values of and Ecut are linked to the Comptonising hot plasma temperature kTe and optical depth , according to the relation discussed by Petrucci et al. (2001) and also analysed by Molina et al. (2009).
In particular, the plasma temperature kTe is estimated as kTe = Ecut/2 if 1 and kTe = Ecut/3 if 1. The most likely range of Ecut estimated in the present sample (30-300 keV), indicates a range of plasma temperatures from 10 to 150 keV (or 1.16108-1.74109 K). The equation (solved for both low and high values of and Ecut and assuming our average value of =1.65 in the case of R=1) has therefore acceptable solutions for in the range 1 to 6. These results are in good agreement with what was previously found for a small sample of Seyfert 1 galaxies studied by Petrucci et al. (2001) and Molina et al. (2009) and indicate that the Comptonising hot plasma has a typical temperature of 8070 keV and is mildly thick (7). Available models should be able to explain and cover the observed range of values.
As a final remark, we also note that synthesis model of the cosmic diffuse background (CXB) often assume as an upper limit to the cut-off energy a value of 200 keV; this choice is basically driven by the intensity and the shape of the CXB spectrum above the peak, which cannot be exceeded; even a value of 300 keV has difficulties in accommodating all available observations and CXB measurements (Gilli et al., 2007). Thus our analysis agrees and supports this CXB model assumption.
6 Summary and Conclusions
In this work we present the hard X-ray properties of a complete sample of AGN using both INTEGRAL/IBIS and for the majority of the sources also Swift/BAT data. In particular, the main objective of this work is to analyse the cross-calibration between IBIS and BAT, study source variability and constraining some important spectral parameters such as the high energy continuum and its cut-off energy. The main results found in this paper can be summarised as follows:
-
-
We find that out of 80 sources for which both BAT and IBIS spectra are available, 11 show signs of flux variability. This result suggests that flux variability is not uncommon at high energies, although it is not very dramatic (see Section 3). Spectral variability is instead quite rare, being found only in one source (i.e. 3C 273).
-
-
There is general good agreement between INTEGRAL/IBIS and Swift/BAT data, although we find a systematic difference in the normalisation between the two instruments of about 22%. This is also reflected in the combined fits discussed in Section 4, where we find that the average cross-calibration constant between IBIS/BAT is 1.22.
-
-
We find, from the combined fits reported in Section 4, that the average photon index for our sample is around 2, with quite a narrow spread. We also find that type 1 and type 2 sources have very similar average photon indices, a clear indication that they are powered by the same mechanism.
-
-
Another interesting result is that a simple power-law is not always the most appropriate model to describe high energy data. Indeed, 35% of the sources show signs of spectral complexity (see Section 4.1) and therefore have to be fitted with a model that takes into account a high energy cut-off and a reflection component.
-
-
This more complex model yields a fit improvement in 75% of the sources considered, thus providing evidence for the presence of a high energy component.
-
-
Although it is quite hard to constrain at once the high energy continuum, its high energy cut-off and the reflection fraction, it is possible to put constraints on at least two parameters while the other is fixed. By fixing the reflection fraction to be 0, 1 and 2, we have been able to determine the parameter space defined by the photon index and the high energy cut-off.
-
-
Our sample covers quite a large range in photon indices as well as cut-off energies; however, the spread is due only to a small number of objects while the majority of the AGN lie within well defined boundaries of photon index (12) and cut-off energy (30Ecut300 keV).
-
-
The values of and Ecut are linked to the Comptonising hot plasma temperature kTe and optical depth ; from our analysis we find that, for the sources in our sample, the plasma has a typical temperature of (8070) keV and is mildly thick (7).
Acknowledgements
The authors acknowledge financial support from ASI under contracts ASI/033/10/0 and ASI/INAF I/009/10/0.
References
- Barthelmy et al. (2005) Barthelmy S. D., Barbier L. M., Cummings J. R. et al. 2005, Space Science Reviews, 120, 143
- Baumgartner et al. (2010) Baumgartner W. H., Tueller J., Markwardt C., Skinner G., 2010, in Bulletin of the American Astronomical Society, Vol. 42, AAS/High Energy Astrophysics Division #11, p. 675
- Beckmann et al. (2006) Beckmann V., Soldi S., Shrader C. R., Gehrels N., Produit N., 2006, ApJ, 652, 126
- Beckmann et al. (2007) Beckmann V., Barthelmy S. D., Courvoisier T., Gehrels N., Soldi S., Tueller J., Wendt G., 2007, A&A, 475, 827
- Beckmann et al. (2009) Beckmann V., Soldi S., Ricci C. et al. 2009, A&A, 505, 417
- Bianchi et al. (2009) Bianchi S., Guainazzi M., Matt G., Fonseca Bonilla N., Ponti G., 2009, A&A, 495, 421
- Bird et al. (2007) Bird A. J., Malizia A., Bazzano A. et al., 2007, ApJS, 170, 175
- Bird et al. (2010) Bird A. J., Bazzano A., Bassani L. et al., 2010, ApJS, 186, 1
- Burlon et al. (2011) Burlon D., Ajello M., Greiner J., Comastri A., Merloni A., Gehrels N., 2011, ApJ, 728, 58
- Corral et al. (2011) Corral A., Della Ceca R., Caccianiga A., Severgnini P., Brunner H., Carrera F. J., Page M. J., Schwope A. D., 2011, A&A, 530, A42
- Dadina (2007) Dadina M., 2007, A&A, 461, 1209
- Dadina (2008) Dadina M., 2008, A&A, 485, 417 2012, MNRAS, 420, 2087
- Deluit & Courvoisier (2003) Deluit S., Courvoisier T. J.-L., 2003, A&A, 399, 77
- Elitzur & Shlosman (2006) Elitzur M. and Shlosman I., 2006, ApJL, 648, 101
- Elitzur (2012) Elitzur M., 2012, ApJL, 747, 33
- Gehrels et al. (2004) Gehrels N., Chincarini G., Giommi P. et al., 2004, ApJ, 611, 1005
- Gilli et al. (2007) Gilli R., Comastri A., Hasinger G., 2007, A&A, 463, 79
- Goldwurm et al. (2003) Goldwurm A., David P., Foschini L. et al., 2003, A&A, 411, L223
- Lebrun et al. (2003) Lebrun F., Leray J. P., Lavocat P. et al., 2003, A&A, 411, L141
- Malizia et al. (2009) Malizia A., Stephen J. B., Bassani L., Bird A. J., Panessa F., Ubertini P., 2009, MNRAS, 399, 944
- Molina et al. (2006) Molina M., Malizia A., Bassani L. et al., 2006, MNRAS, 371, 821
- Molina et al. (2007) Molina M., Giroletti M., Malizia A. et al., 2007, MNRAS, 382, 937
- Molina et al. (2009) Molina M., Bassani L., Malizia A. et al., 2009, MNRAS, 399, 1293
- Perola et al. (2002) Perola G. C., Matt G., Cappi M., Fiore F., Guainazzi M., Maraschi L., Petrucci P. O., Piro L., 2002, A&A, 389, 802
- Petrucci et al. (2001) Petrucci P. O., Haardt F., Maraschi, L. et al., 2001, ApJ, 556, 716
- Ricci et al. (2011) Ricci C., Walter R., Courvoisier T. J.-L., Paltani S., 2011, A&A, 532, A102
- Tazaki et al. (2010) Tazaki F., Ueda Y., Ishino Y., Eguchi S., Isobe N., Terashima Y., Mushotzky R. F., 2010, ApJ, 721, 1340
- Ubertini et al. (2003) Ubertini P., Lebrun F., Di Cocco G. et al., 2003, A&A, 411, L131
- Urry & Padovani (1995) Urry C. M. & Padovani P., 1995, PASP, 107, 803
- Winkler et al. (2003) Winkler C., Courvoisier T. J.-L., Di Cocco G. et al. 2003, A&A, 411, L1
- Yang et al. (2009) Yang Y., Wilson A. S., Matt G., Terashima Y., Greenhill L. J., 2009, ApJ, 691, 131
- Zdziarski et al. (1995) Zdziarski A. A., Johnson W. N., Done C., Smith D., McNaron-Brown K., 1995, ApJL 438, L63