Electromagnon in ferrimagnetic nanograin ceramics
Abstract
Electromagnons are known from multiferroics as spin waves excited by the electric component of electromagnetic radiation. We report the discovery of an excitation in the far-infrared spectra of which we attribute to an electromagnon appearing below 110 K, where the ferrimagnetic structure becomes incommensurately modulated. Inelastic neutron scattering shows that the electromagnon energy corresponds to that of a magnon from the Brillouin zone boundary. Dielectric measurements did not reveal any sign of ferroelectricity in down to 10 K, despite its acentric crystal structure. This shows that the activation of an electromagnon requires, in addition to the polar ferrimagnetic structure, a modulation of the magnetic structure. We demonstrate that a combination of inelastic neutron scattering with infrared and / or terahertz spectroscopies allows detecting electromagnons in ceramics, where no crystal-orientation analysis of THz and infrared spectra is possible.
pacs:
76.50.+g, 77.22.-d, 63.20.kd, 75.85.+tI Introduction
In the last years, there has been an increasing interest in so-called multiferroic materials, displaying simultaneously spontaneous ferroelectric (FE) polarization and ferro- or antiferromagnetic (AFM) ordering. Multiferroics exhibit a rich variety of fundamental physical phenomena, and it is generally believed that they have a potential for novel applications in non-volatile memories Scott (2007); Roy et al. (2012), magnonics Kruglyak et al. (2010) and magnetic sensors Nan et al. (2008). These applications would rely on the coupling of order parameters on various time scales, from quasi-static to ultrafast. However, the understanding of the microscopic mechanism of the magnetodielectric coupling is still a fundamental problem of solid state physics. The static and dynamic magnetoelectric (ME) couplings can have different origins. Owing to the static ME coupling, the macroscopic FE polarization emerges in the cycloidal or transverse conical modulated magnetic structures; this polarization can change with magnetic field. In contrast, the dynamic ME coupling generates an oscillatory polarization and leads to a dielectric dispersion in the terahertz (THz) region. Indeed, THz studies of multiferroics revealed a new kind of electric-field-active spin excitations contributing to the dielectric permittivity , called electromagnons (EMs) Pimenov et al. (2006). Their characteristic feature is a coupling with polar phonons, which manifests itself in the spectra by a transfer of dielectric strength from phonons to EMs on cooling Valdés Aguilar et al. (2007). In contrast to ferromagnetic and AFM resonances, which are magnons from the Brillouin zone (BZ) center contributing to the magnetic permeability , the EMs can be activated also outside of the BZ center Valdés Aguilar et al. (2009); Takahashi et al. (2012); Stenberg and de Sousa (2012); Mochizuki et al. (2010). The understanding of this fact is not trivial, because the photons which excite EMs have wavevectors much smaller than the EMs. Thus, to date, there are several different theories attempting to explain the observed properties of EMs in various materials Valdés Aguilar et al. (2009); Stenberg and de Sousa (2012); Mochizuki et al. (2010); Khomskii (2009).
The EMs were discovered first in TbMnO3 and GdMnO3 Pimenov et al. (2006) which belong to multiferroics denoted Khomskii (2009) as type II, where the FE order is induced by a special magnetic ordering. Since then, EMs were confirmed in numerous type-II multiferroics Valdés Aguilar et al. (2009, 2007); Sushkov et al. (2007, 2008); Pimenov et al. (2008); Kida et al. (2009); Seki et al. (2010); Kézsmárki et al. (2011); Shuvaev et al. (2011). Other reports of EMs in type-I multiferroics (e.g. BiFeO3 Cazayous et al. (2008); Talbayev et al. (2011); Komandin et al. (2010) or hex-YMnO3 Pailhès et al. (2009)) appear inconclusive, since no transfer of the dielectric strength from polar phonons to EMs was observed Cazayous et al. (2008); Pailhès et al. (2009). Also, recent infrared IR and THz studies did not confirm the EM in hex-YMnO3 Kadlec et al. (2011).
Here we report experiments which reveal an excitation identified as an EM in the ferrimagnetic phase of . Thanks to its chemical simplicity, this phase appears also as a suitable model system for theoretical studies of electromagnonic excitations. While - is quite rare and less known than the (hematite) or (maghemite) phases of Machala et al. (2011), its properties make it attractive for applications, such as electromagnetic-wave absorbers and memories Namai et al. (2008, 2012); Ohkoshi et al. (2007). Owing to limited phase stability, it can be synthesized only in the form of nanoparticles tens of nanometers in size Namai et al. (2012); Tuček et al. (2010), epitaxial thin films Gich et al. (2010) or nanowires a few micrometers long Ding et al. (2007). Below 480–495 K, it is ferrimagnetic Jin et al. (2004); Sakurai et al. (2005); at room-temperature, it has a collinear spin structure Tuček et al. (2011) and exhibits a coercive field of Jin et al. (2004)—the highest known value among metal oxides. The crystal lattice has a temperature-independent non-centrosymmetric orthorhombic structure with the space group Tronc et al. (1998) (magnetic space group ). It consists of three crystallographically non-equivalent octahedra, forming chains along the direction, and one type of tetrahedra Tuček et al. (2010); Gich et al. (2006a). Compared to isostructural GaFeO3, the low-temperature phase diagram of - is complex—below 150 K, a series of magnetic phase transitions occurs. Below , an incommensurate magnetic ordering appears where the magnetic structure modulation has a periodicity of about 10 unit cells Gich et al. (2006a). Near , a drop in was observed, and magnetocapacitive measurements revealed a quadratic coupling Gich et al. (2006b). Room-temperature microwave measurements provided evidence of a strong ferromagnetic resonance (FMR) near 0.74 meV (frequency of 180 GHz) which can be tuned by doping with Al, Ga or Rh Namai et al. (2008); Ohkoshi et al. (2007); Namai et al. (2012). In order to gain insight into the dynamic ME properties of -, we obtained THz, IR and inelastic neutron scattering (INS) spectra of - nano-grain ceramics upon cooling down to 10 K, providing information about polar and magnetic excitations.
II Samples and experimental methods
The nanoparticles of - were synthesized by sol-gel chemistry. - composite gels containing 30 wt. % of were prepared from iron nitrate nonahydrate (Sigma-Aldrich ) and tetraethoxysilane (TEOS, Sigma-Aldrich 98%) in hydroethanolic medium at TEOS:H2O:EtOH = 1:6:6 molar ratio. Iron nitrate was first dissolved and then TEOS added dropwise to the mixture under stirring. The sol was poured into 5 cm diameter petri dishes that were closed with its cover and gelation took place for between 4 and 5 weeks. The gels were dried overnight in a stove at 70 , crushed and thermally treated in air atmosphere for 3 hours at 1100 (heating rate 80 /h). The resulting material was a composite of - nanoparticles of about 25 nm in diameter dispersed in an amorphous matrix as checked by X-ray diffraction (XRD) which did not reveal any trace of other polymorphs. The silica was removed by stirring the composite powder for 12 h in a 12M aqueous NaOH solution at 80 under reflux. XRD patterns recorded after the silica removal revealed that the microstructure and the phase stability of - nanoparticles were not affected by the etching process. The nanoparticles were further processed by spark plasma sintering (SPS) in order to prepare a pellet suitable for dielectric, terahertz (THz) and IR measurements by pressing the - powder in a graphite mould for 4 minutes at 350 under 100 MPa. The XRD analysis of the sintered pellet showed that the SPS process did not induce any grain growth or phase transformation. Finally, the SPS pellets were polished to thin disks with a thickness of 1.2 mm. Some IR and THz measurements were performed on - pellets with a diameter of about 6 mm, which were prepared from powder at room temperature using a standard tabletop manual hydraulic press (Perkin Elmer). The spectra were qualitatively the same, only the value of the high-frequency IR reflectance was affected by the roughness of the sample surface, which could not be polished.
IR reflectance measurements with the resolution of 0.25 meV were performed using the Fourier transform infrared spectrometer Bruker IFS-113v in near-normal reflectance geometry with an incidence angle of . An Oxford Instruments Optistat optical cryostat with polyethylene windows was used for sample cooling down to 10 K, and a liquid-He-cooled Si bolometer operating at 1.6 K was applied as a detector. We also measured far-IR reflectivity with applied magnetic field up to 13 T. To this aim, another Bruker IFS-113v spectrometer and a custom-made superconducting magnetic cryostat allowing the measurements at 2 and 4 K were used. Time-domain THz spectroscopy was based on measurements of sample transmittance using custom-made spectrometers based on Ti:sapphire femtosecond lasers; one with an Optistat cryostat with mylar windows for measurements without magnetic field but with a higher frequency resolution, enabling to discern the FMR profile, and one with an Oxford Instruments Spectromag cryostat, enabling measurements with magnetic field of up to 7 T. Here, the Voigt configuration was used with the external static magnetic field perpendicular to the magnetic component of the THz radiation . Similar effects were observed also for .
INS experiments were performed between 10 and 190 K using about 3 g of loose nanopowder in the IN4 time-of-flight diffractometer at the Institut Laue-Langevin in Grenoble, France.
III Results and discussion
III.1 Broad-band study of the electromagnetic response.
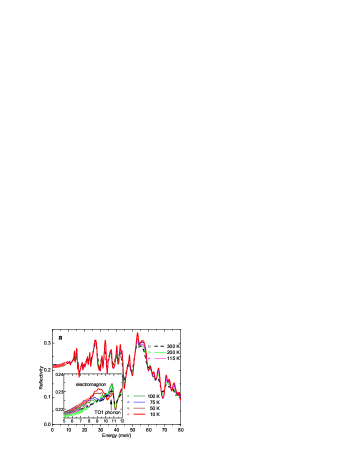
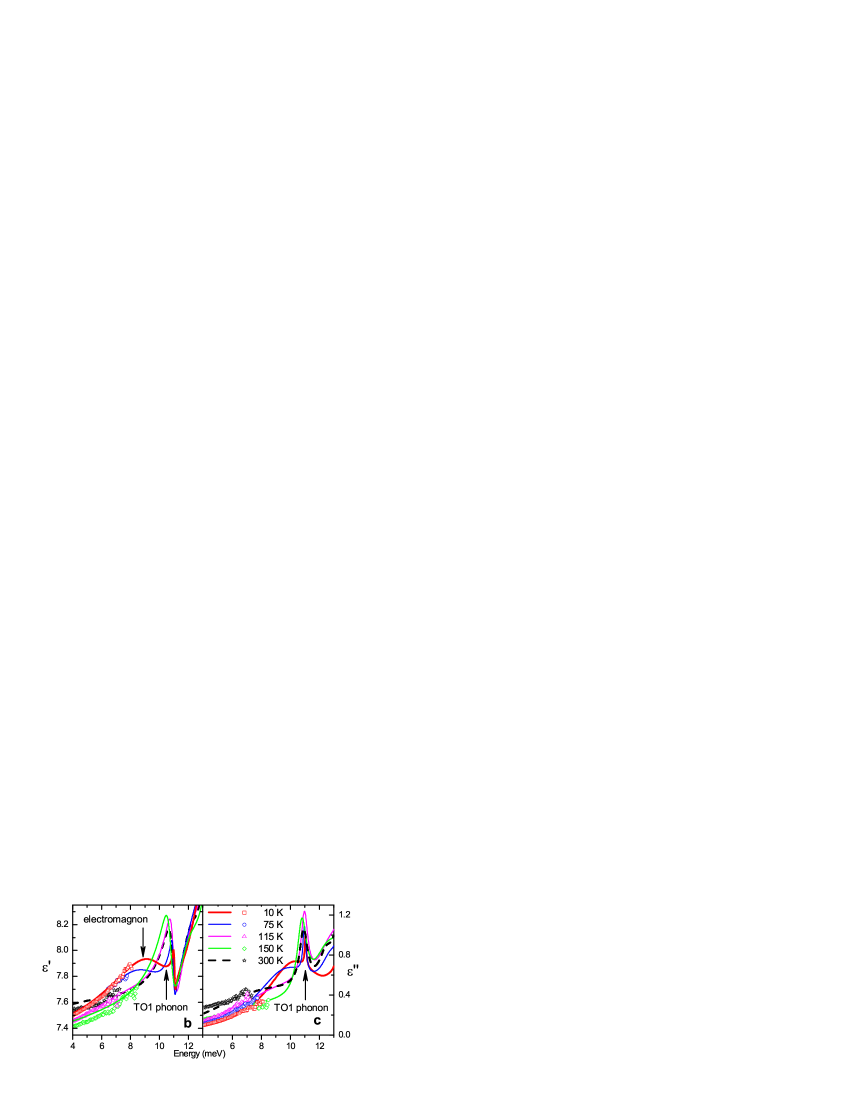
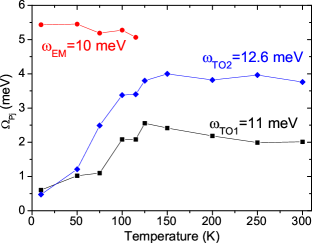
Fig. 1a shows the far and mid-IR reflectivity spectra displaying polar optical phonons of - between 10 and 300 K. Figs. 1b, c show the far-IR spectra calculated from the fits of IR reflectivity together with the experimental THz data. To this purpose, we used a model involving 35 harmonic oscillators; this number is lower than the number of IR active modes provided by the factor group analysis (see Appendix A); apparently, a part of the modes are too weak to be observed. Upon cooling, all phonons above 12 meV exhibit the usual behavior—their intensity increases due to reduced phonon damping at low temperatures. The TO1 phonon near 11 meV exhibits an anomalous behavior: on cooling, its intensity increases only down to 115 K. Below this temperature, it markedly weakens, while a supplementary broad reflectivity peak develops below and becomes more intense upon cooling (see the inset of Fig. 1a). This transfer of strengths involves also the TO2 phonon (see Fig. 2), evidencing a coupling among these three polar modes. Despite the lattice distortions which occur between 150 K and 75 K, the crystal symmetry of does not change with temperature Gich et al. (2006a); Tseng et al. (2009). This is further confirmed by our IR reflectivity spectra, displaying a temperature-independent number of polar phonons; should a structural phase transition occur, it would imply a change of the factor group analysis and different phonon selection rules. Given the high number of atoms in the unit cell, multiple new reflection bands throughout the IR range would be observed. Therefore, one can exclude the new mode to originate in a structural modification.
Another option to be considered is the polar phonon splitting due to exchange coupling below AFM phase transitions which was reported in various transition-metal monoxides and chromium spinels Kant et al. (2012); the mode splitting increased on cooling below the Néel temperature. However, this explanation cannot be valid as we observe an opposite temperature dependence—the new mode appears below at low energies and hardens towards the TO1 phonon energy on cooling, i.e. their energy difference decreases.
Finally, one cannot a priori exclude the hypothesis of activation of the TO1 phonon branch from the area of the BZ near its edge. This would require a folding of the structural BZ which could be caused by a transfer of the magnetic BZ folding (linked to incommensurability) via magnetostriction. Nevertheless, in the X-ray diffraction studies, no appropriate satellite reflections were observed. Even supposing these satellite reflections to be very weak, one would expect the off-center phonons to activate also at higher energies, which we did not observe. This hypothesis therefore seems unlikely. Based on further experimental evidence, especially in view of an analogous temperature behavior observed by INS, we argue below that the reflection band activated below is most probably an EM.
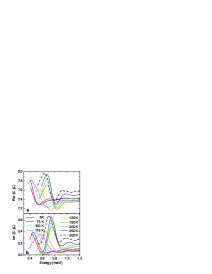
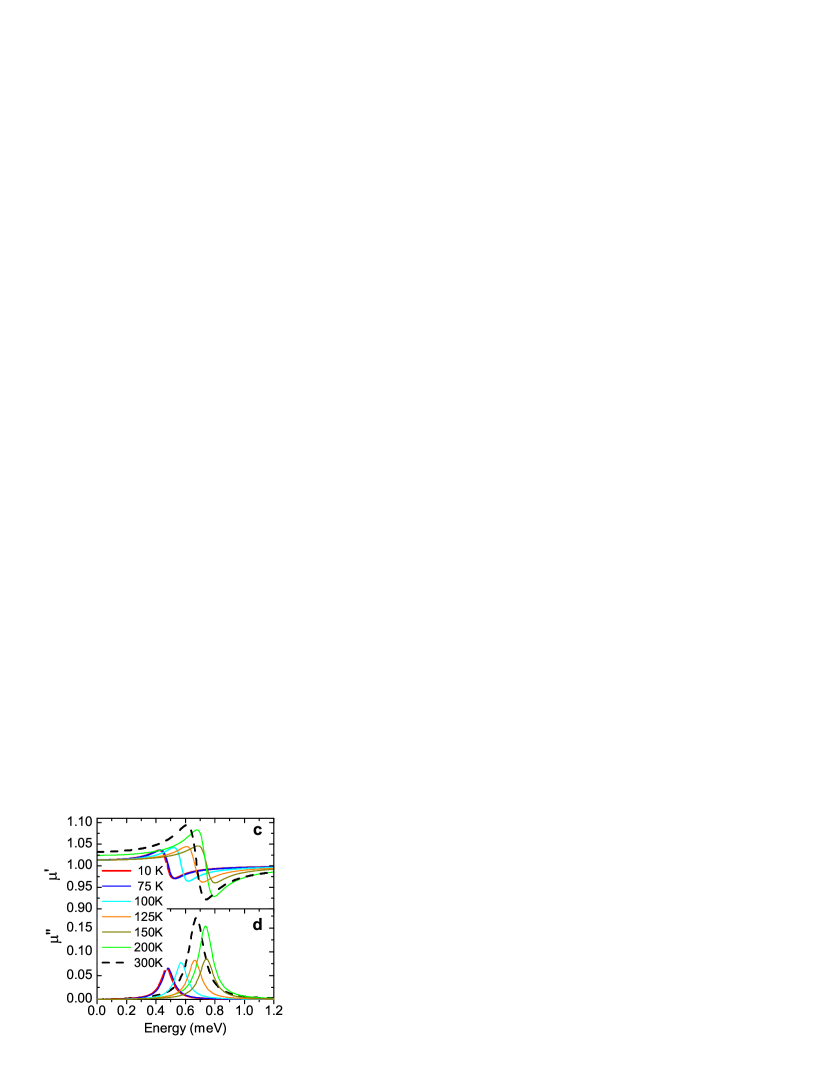
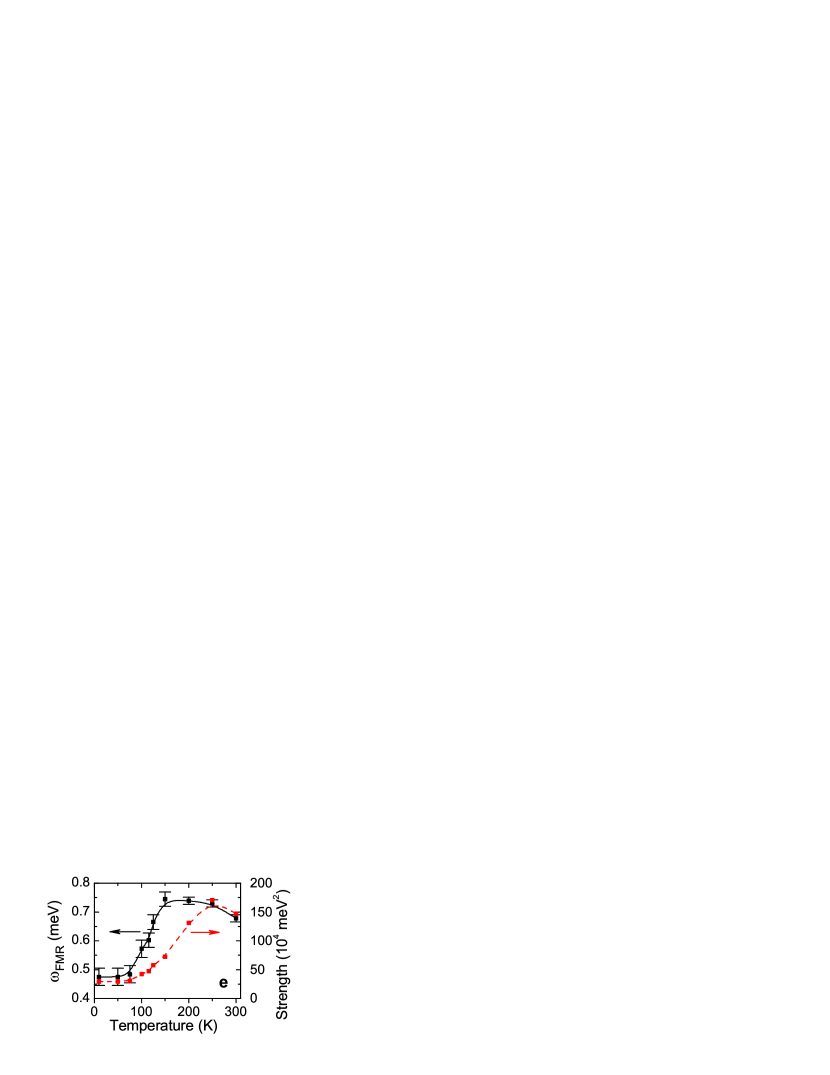
The temperature dependent THz spectra (see Fig. 3) reveal the sharp FMR which was previously reported at room temperature Namai et al. (2008, 2012). To quantify its temperature behavior, we used the harmonic oscillator model for all phonons and one term accounting for the FMR in , while assuming a smooth dependence of in this interval. The resulting spectra, matching well the measured data, are shown in Fig. 3c,d. From the fit parameters, we derived the temperature dependence of the magnon strength and FMR energy (see Fig. 3e). We observe a sharp drop in the resonance energy between 150 K and 75 K, very similar to that of the coercive field Gich et al. (2005). This can be explained by the fact that the FMR energy is proportional to the magnetocrystalline anisotropy field . As the sample consists of randomly oriented particles with a uniaxial magnetic anisotropy, is proportional to the value Ohkoshi et al. (2007).
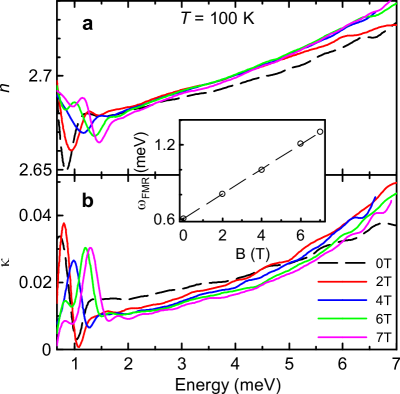
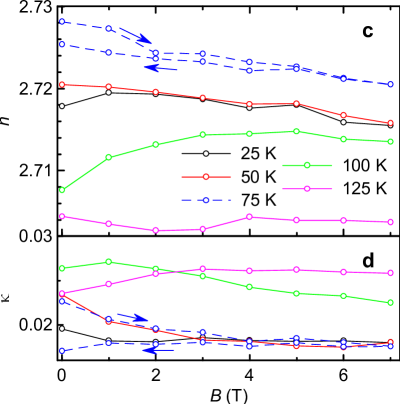
Furthermore, we measured THz time-domain spectra with external magnetic field ranging from 0 to 7 T. Because of the high absorption of the EM, lying near 10 meV, the sample was opaque above 7 meV. Therefore, we could measure only the low-frequency wing of the EM. When the magnetic field is applied, two types of changes in the THz spectra can be observed: an increase of the FMR frequency corresponding to the peak of the spectra, and a change of the slope of both real and imaginary parts of the index of refraction, indicating shifts of the EM frequency with magnetic field. An example of the former behavior at is shown in Fig. 4a, b; the FMR frequency, upon applying a static magnetic field of , increases from 0.6 to 1.3 meV (see inset of Fig. 4a, b). The latter phenomenon is illustrated by Fig. 4c, d which traces the values of the complex refractive index at as a function of temperature and applied magnetic field. While changes only close to the sensitivity level were detected at temperatures of 10 and 300 K (not shown in Fig. 4), there is a clear -dependence of the spectra at intermediate temperatures. The highest sensitivity was observed at 100 K, close to the magnetic phase transition. Also, at , a marked hysteresis in occurs, similarly to the temperature hysteresis observed by radio-frequency impedance spectroscopy techniques near this temperature (see Figure 5); this observation will be discussed below. At , where the magnetic structure is probably stable, the changes of with magnetic field are smaller. This explains also why we did not detect any significant changes of the far-IR spectra with magnetic field at K.
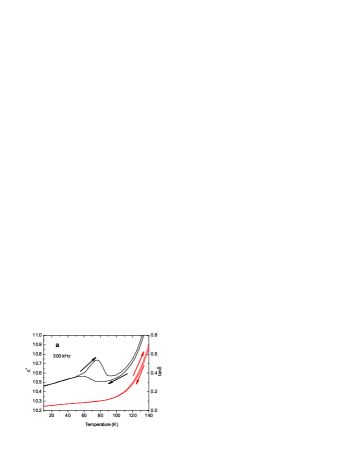


In the frequency range from 10 Hz to 1 MHz, the complex permittivity was measured by impedance spectroscopy as a function of temperature (see Fig. 6). No sign of a FE phase transition was detected. Above 200 K, both and increase due to the leakage conductivity and the related Maxwell-Wagner polarization. Between 100 and 200 K, we observed a step-like decrease of towards lower temperatures and maxima in losses , which is typical of a dielectric relaxation. The temperature dependence of the relaxation time obtained from the peaks of follows an Arrhenius behavior, with denoting the Boltzmann constant, and . The origin of this relaxation is not clear, however, similar effects are known from several perovskite rare-earth manganites, including the multiferroics TbMnO3 and DyMnO3 Schrettle et al. (2009). We attribute the relaxation to thermally activated vibrations of the FE domain walls or magnetic domain walls which can be polar Pyatakov et al. (2011). The huge room-temperature coercive field is the consequence of a single-domain magnetic structure of the nanograins Namai et al. (2012). Below 200 K, strongly decreases due to a transition to a polydomain structure Gich et al. (2005) which explains why the dielectric relaxation exists only in this temperature range.

The inset of Fig. 6 shows the measured dependences of the polarization on applied electric field. No open FE hysteresis loops nor signs of saturation were observed under the applied fields. Since the crystal structure of corresponds to a pyroelectric space group, we cannot exclude that an applied electric field with an intensity higher than the one we used (beyond 5 kV/cm, our sample became leaky) would switch the polarization and that is in fact FE. Actually, one of us recently investigated strained epitaxial thin films and, under an applied electric field one order of magnitude stronger, observed a room-temperature FE switching.Gich et al. (in preparation) Since the crystal symmetry of does not change with temperature Nižňanský (No change of the crystal structure was observed in XRD up to 800 K), one can not exclude that the nanograins are also FE already above the ferrimagnetic phase transition occurring near 490 K; in any case, it is at least pyroelectric. Consequently, would belong to type-I multiferroics.
Near 75 K, a small peak in was observed in our impedance spectroscopy measurements (as marked by the arrow in Fig. 6). This peak is rather weak on cooling, but it becomes more distinct on heating, and it exhibits a temperature hysteresis of 15 K (see also Fig. 5). This is reminiscent of a dielectric anomaly typical for pseudoproper or improper FE phase transitions, such as those in perovskite rare-earth manganites. However, this hypothesis is not confirmed by the polarization measurements shown in Fig. 6, and the X-ray and neutron diffraction investigations did not reveal any structural changes near 75 K either Gich et al. (2006a); Tseng et al. (2009). In type-II multiferroics, a narrow dielectric peak is seen at only at frequencies below 1 MHz and its intensity strongly decreases with rising frequency Schrettle et al. (2009). By contrast, in our impedance spectra, the peak is present at all frequencies up to the THz region (see Fig. 5b), although it is partly covered by the stronger dielectric relaxation at low frequencies. Therefore, this anomaly must originate from phonons or an EM. As the observed dielectric anomaly occurs at a temperature close to the lowest-temperature magnetic phase transition Gich et al. (2006a), we propose that it arises from the transfer of the dielectric strength from the TO1 and TO2 phonons to the EM (see Fig. 2). We note that in single-crystal multiferroics, often a step-like increase of the permittivity occurs below the temperature where the electromagnon activates. Sushkov et al. (2008) Our observations on nanograin samples are somewhat different—while a step-like increase of below K, superimposed with the narrow-range anomaly near 75 K, was detected in the THz range (see Fig. 5b), only the anomaly near 75 K manifests itself in the kHz range (see Fig. 5a). We suppose that the step in the low-frequency permittivity is screened by the observed dielectric relaxation in the microwave range.
We also investigated the dependence of the permittivity at 1 kHz on external magnetic field up to 9 T. We found that exhibits the highest changes (almost 2%) near 70 and 130 K (see Fig. 5c). Both of these anomalies are clearly linked to the changes of magnetic structure Gich et al. (2006a). We suppose that the lower-temperature change corresponds to the EM anomaly observed also in THz experiments, while that observed near 130 K is due to the relaxation linked to the magnetic and simultaneously polar domain walls.


III.2 Neutron scattering.
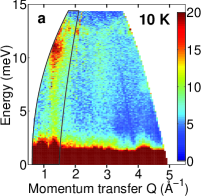
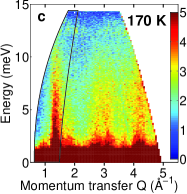
In order to further explore the hypothesis of an EM, we performed time-of-flight INS experiments which allow measuring the phonon and magnon density of states (DOS) in the meV energy range. As the nanopowder does not allow us to determine directly the phonon and magnon dispersion branches in the BZ, the data represent an orientation-averaged scattering function where is the total momentum transfer and the energy transferred between the crystal lattice and the neutrons (see Fig. 7). The data reveal a steep column of intense scattering, emanating from magnetic Bragg peaks at , and extending up to . The weaker columns at are due to scattering in higher-order BZs. The fact that the area of most intense scattering is located at low shows unambiguously Shirane et al. (2002) that the dominant contribution to the low- scattering comes from spin waves.
A qualitatively similar magnon response was recently observed in INS spectra of polycrystalline BiFeO3 Delaire et al. (2012); the spin wave character of the excitation was confirmed by INS on BiFeO3 crystals, where the magnon dispersion branch was directly measured Jeong et al. (2012). Our scattering from the magnon waves becomes weaker on cooling due to the decreasing Bose-Einstein factor. Around 10 meV, a distinct scattering peak persists down to low temperatures, corresponding to a maximum of the magnon DOS; this is obviously due to a flat end of the branch below the BZ boundary. Moreover, the energy at the maximal magnon DOS, as well as its temperature evolution, corresponds to that of the newly IR-activated mode (see Fig. 7d).
The inset of Fig. 7d shows a schematic view of an acoustic-like magnon dispersion branch giving rise to the observed excitations, both the one below 10.5 meV (at the BZ boundary) and the FMR near 0.5 meV (in the BZ center). This dispersion behavior is similar to that observed in the ferrimagnetic Rhyne and Koon (1978), which exhibits a slightly higher Curie temperature of 597 K. In , the optic-like magnon branches lie probably above 12 meV, beyond the energy range used in our INS experiments. We suggest that this acoustic-like magnon is activated in the IR spectra due to the loss of magnetic translation symmetry in the incommensurate magnetic phase below . Such an activation is analogous to that of phonons with in structurally modulated crystals Petzelt (1981). We suppose that the large damping of the newly activated excitation can be explained by an activation of the magnon DOS in the IR spectra. Since the observed spin-wave excitation is coupled with the lowest-energy TO1 phonon, it must be excited by the electric component of the electromagnetic radiation; at the same time, it has to contribute to dielectric permittivity. Therefore, the excitation seen near 10 meV must be an EM.
IV Conclusion
In conclusion, in , we have discovered an excitation, appearing simultaneously with the modulation of the magnetic structure, at energies below the TO1 phonon. We attribute this excitation to an EM whose energy corresponds to a magnon from the BZ boundary. We did not observe any other excitation at lower energies, in contrast to type-II multiferroics. There, the Dzyaloshinskii-Moriya (D.-M.) interaction breaks the center of symmetry, induces ferroelectricity Khomskii (2009) and the EMs are activated thanks to magnetostriction (()-type interaction) Valdés Aguilar et al. (2009). In , the crystal structure is acentric at all temperatures and it permits to activate the D.-M. interaction in an originally collinear ferrimagnetic structure Fennie (2008); the D.-M. interaction tilts the spins and finally induces an incommensurately modulated magnetic structure below , where the EM activates due to magnetostriction.
Up to now, EMs were reported mainly in type-II multiferroics. Previous reports of EMs in type-I multiferroics were lacking evidence of their coupling with polar phonons, e.g. in BiFeO3 Cazayous et al. (2008); Talbayev et al. (2011); Komandin et al. (2010) or hex-YMnO3 Pailhès et al. (2009). Our results indicate that belongs to type-I multiferroics; it is pyroelectric and perhaps FE even above the ferrimagnetic phase transition Nižňanský (No change of the crystal structure was observed in XRD up to 800 K) at 490 K, but the EM is activated only below , corresponding to the onset of the incommensurately modulated magnetic structure. In our case, a clear transfer of dielectric strength from a low-energy phonon to the zone boundary magnon was observed.
Finally, we would like to stress that EMs were previously identified only in single crystals using a thorough polarization analysis of measured spectra. Here we have determined an EM from unpolarized IR and THz spectra of nanograin ceramics showing its coupling with a TO1 phonon. Simultaneously, we have shown from INS experiments made on powder that the EM in - comes from the BZ boundary. This combination of experimental methods provides a guideline for an unambiguous determination of EMs in materials where sufficiently large single crystals for polarized IR and THz measurements are not available.
Acknowledgements.
This work was supported by the Czech Science Foundation (project P204/12/1163). The experiment in ILL Grenoble was carried out at the IN4 spectrometer within the project LG11024 financed by the Ministry of Education of the Czech Republic. M.G. acknowledges funding from the Spanish Ministerio de Economía y Competitividad (projects RyC-2009-04335, MAT 2012-35324 and CONSOLIDER-Nanoselect-CSD2007-00041) and the European Commission (FP7-Marie Curie Actions, PCIG09-GA-2011-294168). S.K. thanks Petr Brázda for his stimulation of our - research and S. Artyukchin for a helpful discussion.Appendix A Phonons in
For the orthorhombic crystal structure of with 8 formula units per unit cell Gich et al. (2006a), the factor group analysis predicts the following phonon counts and symmetries in the BZ center:
| (1) | |||||
Here, , and mark electric polarizations of the IR wave for which the phonons are IR active, while the rest of symbols are components of the Raman tensor. After subtraction of the three acoustic phonons, 87 IR-active phonons are expected. We have observed 35 of them (see their parameters in Table 1); the remaining ones cannot be identified, either because of low intensities or because they overlap with other ones.
| No. | [meV] | [meV] | No. | [meV] | [meV] | ||||||||
|---|---|---|---|---|---|---|---|---|---|---|---|---|---|
| EM | 0. | 27 | 10. | 47 | 4. | 67 | 18 | 0. | 02 | 38. | 40 | 1. | 34 |
| 1 | 0. | 01 | 11. | 05 | 0. | 13 | 19 | 0. | 18 | 40. | 13 | 1. | 40 |
| 2 | 0. | 01 | 12. | 61 | 0. | 87 | 20 | 0. | 15 | 42. | 16 | 1. | 37 |
| 3 | 0. | 08 | 13. | 85 | 0. | 44 | 21 | 0. | 13 | 43. | 37 | 1. | 48 |
| 4 | 0. | 24 | 15. | 25 | 0. | 82 | 22 | 0. | 02 | 46. | 76 | 0. | 99 |
| 5 | 0. | 06 | 16. | 26 | 0. | 49 | 23 | 0. | 16 | 48. | 04 | 1. | 87 |
| 6 | 0. | 02 | 17. | 58 | 1. | 82 | 24 | 0. | 02 | 49. | 39 | 1. | 20 |
| 7 | 0. | 07 | 18. | 64 | 0. | 83 | 25 | 0. | 25 | 52. | 78 | 2. | 24 |
| 8 | 0. | 03 | 19. | 95 | 0. | 76 | 26 | 0. | 40 | 55. | 42 | 4. | 68 |
| 9 | 0. | 09 | 21. | 87 | 0. | 99 | 27 | 0. | 07 | 57. | 45 | 3. | 03 |
| 10 | 0. | 08 | 23. | 42 | 0. | 65 | 28 | 0. | 11 | 60. | 84 | 3. | 32 |
| 11 | 0. | 56 | 27. | 18 | 2. | 33 | 29 | 0. | 03 | 63. | 02 | 1. | 95 |
| 12 | 0. | 02 | 28. | 88 | 0. | 77 | 30 | 0. | 14 | 65. | 66 | 3. | 62 |
| 13 | 0. | 01 | 29. | 59 | 0. | 46 | 31 | 0. | 07 | 70. | 78 | 2. | 29 |
| 14 | 0. | 09 | 30. | 91 | 0. | 96 | 32 | 0. | 03 | 72. | 58 | 1. | 96 |
| 15 | 0. | 21 | 33. | 05 | 1. | 12 | 33 | 0. | 07 | 75. | 29 | 3. | 61 |
| 16 | 0. | 01 | 34. | 94 | 0. | 44 | 34 | 0. | 05 | 78. | 46 | 4. | 71 |
| 17 | 0. | 37 | 36. | 44 | 2. | 60 | 35 | 0. | 08 | 85. | 68 | 5. | 43 |
References
- Scott (2007) J. Scott, Nat. Mater. 6, 256 (2007).
- Roy et al. (2012) A. Roy, R. Gupta, and A. Garg, Adv. in Cond. Matt. Phys. 2012, 926290 (2012).
- Kruglyak et al. (2010) V. V. Kruglyak, S. O. Demokritov, and D. Grundler, J. Phys. D: Appl. Physics 43, 264001 (2010).
- Nan et al. (2008) C. Nan, M. Bichurin, S. Dong, D. Viehland, and G. Srinivasan, J. Appl. Phys. 103, 031101 (2008).
- Pimenov et al. (2006) A. Pimenov, A. Mukhin, V. Ivanov, V. Travkin, A. Balbashov, and A. Loidl, Nat. Phys. 2, 97 (2006).
- Valdés Aguilar et al. (2007) R. Valdés Aguilar, A. B. Sushkov, C. L. Zhang, Y. J. Choi, S.-W. Cheong, and H. D. Drew, Phys. Rev. B 76, 060404 (2007).
- Valdés Aguilar et al. (2009) R. Valdés Aguilar, M. Mostovoy, A. B. Sushkov, C. L. Zhang, Y. J. Choi, S.-W. Cheong, and H. D. Drew, Phys. Rev. Lett. 102, 047203 (2009).
- Takahashi et al. (2012) Y. Takahashi, R. Shimano, Y. Kaneko, H. Murakawa, and Y. Tokura, Nat. Phys. 8, 121 (2012).
- Stenberg and de Sousa (2012) M. P. V. Stenberg and R. de Sousa, Phys. Rev. B 85, 104412 (2012), ibid. 80, 094419 (2009).
- Mochizuki et al. (2010) M. Mochizuki, N. Furukawa, and N. Nagaosa, Phys. Rev. Lett. 104, 177206 (2010).
- Khomskii (2009) D. Khomskii, Phys. 2, 1 (2009).
- Sushkov et al. (2007) A. Sushkov, R. Aguilar, S. Park, S. Cheong, and H. Drew, Phys. Rev. Lett. 98, 27202 (2007).
- Sushkov et al. (2008) A. B. Sushkov, M. Mostovoy, R. V. Aguilar, S.-W. Cheong, and H. D. Drew, J. Phys.: Cond. Matt. 20, 434210 (2008).
- Pimenov et al. (2008) A. Pimenov, A. M. Shuvaev, A. A. Mukhin, and A. Loidl, J. Phys.: Cond. Matt. 20, 434209 (2008).
- Kida et al. (2009) N. Kida, Y. Takahashi, J. Lee, R. Shimano, Y. Yamasaki, Y. Kaneko, S. Miyahara, N. Furukawa, T. Arima, and Y. Tokura, J. Opt. Soc. Am. B 26, A35 (2009).
- Seki et al. (2010) S. Seki, N. Kida, S. Kumakura, R. Shimano, and Y. Tokura, Phys. Rev. Lett. 105, 097207 (2010).
- Kézsmárki et al. (2011) I. Kézsmárki, N. Kida, H. Murakawa, S. Bordács, Y. Onose, and Y. Tokura, Phys. Rev. Lett. 106, 57403 (2011).
- Shuvaev et al. (2011) A. M. Shuvaev, A. A. Mukhin, and A. Pimenov, J. Phys.: Cond. Matt. 23, 113201 (2011).
- Cazayous et al. (2008) M. Cazayous, Y. Gallais, A. Sacuto, R. De Sousa, D. Lebeugle, and D. Colson, Phys. Rev. Lett. 101, 37601 (2008).
- Talbayev et al. (2011) D. Talbayev, S. Trugman, S. Lee, H. Yi, S. Cheong, and A. Taylor, Phys. Rev. B 83, 094403 (2011).
- Komandin et al. (2010) G. Komandin, V. Torgashev, A. Volkov, O. Porodinkov, I. Spektor, and A. Bush, Phys. Solid State 52, 734 (2010).
- Pailhès et al. (2009) S. Pailhès, X. Fabrèges, L. P. Régnault, L. Pinsard-Godart, I. Mirebeau, F. Moussa, M. Hennion, and S. Petit, Phys. Rev. B 79, 134409 (2009).
- Kadlec et al. (2011) C. Kadlec, V. Goian, K. Z. Rushchanskii, P. Kužel, M. Ležaić, K. Kohn, R. V. Pisarev, and S. Kamba, Phys. Rev. B 84, 174120 (2011).
- Machala et al. (2011) L. Machala, J. Tuček, and R. Zbořil, Chem. Mater. 23, 3255 (2011).
- Namai et al. (2008) A. Namai, S. Sakurai, M. Nakajima, T. Suemoto, K. Matsumoto, M. Goto, S. Sasaki, and S. Ohkoshi, J. Am. Chem. Soc. 131, 1170 (2008).
- Namai et al. (2012) A. Namai, M. Yoshikiyo, K. Yamada, S. Sakurai, T. Goto, T. Yoshida, T. Miyazaki, M. Nakajima, T. Suemoto, and H. Tokoro, Nat. Commun. 3, 1035 (2012).
- Ohkoshi et al. (2007) S. Ohkoshi, S. Kuroki, S. Sakurai, K. Matsumoto, K. Sato, and S. Sasaki, Angew. Chem. Int. Ed. 46, 8392 (2007).
- Tuček et al. (2010) J. Tuček, R. Zbořil, A. Namai, and S. Ohkoshi, Chem. Mater. 22, 6483 (2010).
- Gich et al. (2010) M. Gich, J. Gazquez, A. Roig, A. Crespi, J. Fontcuberta, J. C. Idrobo, S. J. Pennycook, M. Varela, V. Skumryev, and M. Varela, Appl. Phys. Lett. 96, 112508 (2010).
- Ding et al. (2007) Y. Ding, J. Morber, R. Snyder, and Z. Wang, Adv. Funct. Mater. 17, 1172 (2007).
- Jin et al. (2004) J. Jin, S. Ohkoshi, and K. Hashimoto, Adv. Mater. 16, 48 (2004).
- Sakurai et al. (2005) S. Sakurai, J. Jin, K. Hashimoto, and S. Ohkoshi, J. Phys. Soc. Japan 74, 1946 (2005).
- Tuček et al. (2011) J. Tuček, S. Ohkoshi, and R. Zbořil, Appl. Phys. Lett. 99, 253108 (2011).
- Tronc et al. (1998) E. Tronc, C. Chanéac, and J. Jolivet, Journal of Solid State Chemistry 139, 93 (1998).
- Gich et al. (2006a) M. Gich, C. Frontera, A. Roig, E. Taboada, E. Molins, H. R. Rechenberg, J. D. Ardisson, W. A. A. Macedo, C. Ritter, V. Hardy, et al., Chem. Mater. 18, 3889 (2006a).
- Gich et al. (2006b) M. Gich, C. Frontera, A. Roig, J. Fontcuberta, E. Molins, N. Bellido, C. Simon, and C. Fleta, Nanotechnology 17, 687 (2006b).
- Tseng et al. (2009) Y.-C. Tseng, N. M. Souza-Neto, D. Haskel, M. Gich, C. Frontera, A. Roig, M. van Veenendaal, and J. Nogués, Phys. Rev. B 79, 094404 (2009).
- Kant et al. (2012) C. Kant, M. Schmidt, Z. Wang, F. Mayr, V. Tsurkan, J. Deisenhofer, and A. Loidl, Phys. Rev. Lett. 108, 177203 (2012).
- Gich et al. (2005) M. Gich, A. Roig, C. Frontera, E. Molins, J. Sort, M. Popovici, G. Chouteau, D. M. y Marero, and J. Nogués, J. Appl. Phys. 98, 044307 (2005).
- Schrettle et al. (2009) F. Schrettle, P. Lunkenheimer, J. Hemberger, V. Y. Ivanov, A. A. Mukhin, A. M. Balbashov, and A. Loidl, Phys. Rev. Lett. 102, 207208 (2009).
- Pyatakov et al. (2011) A. Pyatakov, D. Sechin, A. Sergeev, A. Nikolaev, E. Nikolaeva, A. Logginov, and A. Zvezdin, Europhys. Lett. 93, 17001 (2011).
- Gich et al. (in preparation) M. Gich, I. Fina, A. Morelli, F. Sánchez, M. Alexe, J. Fontcuberta, and A. Roig (in preparation).
- Nižňanský (No change of the crystal structure was observed in XRD up to 800 K) D. Nižňanský, private communication. (No change of the crystal structure was observed in XRD up to 800 K).
- Shirane et al. (2002) G. Shirane, S. M. Shapiro, and J. M. Tranquada, Neutron Scattering with a Triple-Axis Spectrometer (Cambridge University Press, 2002), pp. 36 ff.
- Delaire et al. (2012) O. Delaire, M. B. Stone, J. Ma, A. Huq, D. Gout, C. Brown, K. F. Wang, and Z. F. Ren, Phys. Rev. B 85, 064405 (2012).
- Jeong et al. (2012) J. Jeong, E. A. Goremychkin, T. Guidi, K. Nakajima, G. S. Jeon, S.-A. Kim, S. Furukawa, Y. B. Kim, S. Lee, V. Kiryukhin, et al., Phys. Rev. Lett. 108, 077202 (2012).
- Rhyne and Koon (1978) J. J. Rhyne and N. C. Koon, J. Appl. Phys. 49, 2133 (1978).
- Petzelt (1981) J. Petzelt, Phase Trans. 2, 155 (1981).
- Fennie (2008) C. Fennie, Phys. Rev. Lett. 100, 167203 (2008).