Moderate stem cell telomere shortening rate postpones cancer onset in stochastic model.
Abstract
Mammalian cells are restricted from proliferating indefinitely. Telomeres at the end of each chromosome are shortened at cell division and, when they reach a critical length, the cell will enter permanent cell cycle arrest - a state known as senescence. This mechanism is thought to be tumor suppressing, as it helps prevent precancerous cells from dividing uncontrollably.
Stem cells express the enzyme telomerase, which elongates the telomeres, thereby postponing senescence. However, unlike germ cells and most types of cancer cells, stem cells only express telomerase at levels insufficient to fully maintain the length of their telomeres leading to a slow decline in proliferation potential. It is not yet fully understood how this decline influences the risk of cancer and the longevity of the organism.
We here develop a stochastic model to explore the role of telomere dynamics in relation to both senescence and cancer. The model describes the accumulation of cancerous mutations in a multicellular organism and creates a coherent theoretical framework for interpreting the results of several recent experiments on telomerase regulation.
We demonstrate that the longest average cancer free life span before cancer onset is obtained when stem cells start with relatively long telomeres that are shortened at a steady rate at cell division. Furthermore, the risk of cancer early in life can be reduced by having a short initial telomere length.
Finally, our model suggests that evolution will favour a shorter than optimal average cancer free life span in order to postpone cancer onset until late in life.
pacs:
87.10.Mn, 87.19.xj, 82.39.RtI Introduction
Telomeres are the non-coding ends of chromosomes that prevent loss of genomic information during chromosome replication Blasco (2005). Each cell division leads to a telomere shortening of 50-100 base pairs, partly due to what is known as the end-replication problem Lorenz et al. (2001); Huffman et al. (2000). When the telomeres reach a critical length the cell goes senescent, a state of permanent replication arrest that prohibits any further proliferation Campisi and d’Adda di Fagagna (2007). The number of divisions a cell can undergo before it reaches senescence is called the Hayflick limit Campisi (2005a).
Short telomeres have been linked to increased mortality and age related diseases Cawthon et al. (2003a) and accumulation of senescent cells is seen as one of the major causes of ageing Campisi (2005a); Collado et al. (2007); Bendtsen et al. (2012). However, the proliferation limit associated with telomere attrition is thought to work as a fail-safe mechanism against cells that divide in an uncontrolled and rapid fashion, particularly cancer cells Collado and Serrano (2010).
Genes that are critical in maintaining cells in a non-cancerous state are called proto-oncogenes or tumor suppressor genes. Estimates of the number of mutations in these genes needed for a healthy cell to turn cancerous range from 3-6 Alberts (2008) and above Beckman and Loeb (2005).
Cancer cells replicate uncontrollably and have unlimited proliferation capability, known as cellular immortality Hiyama and Hiyama (2007). Consequently, the cancerous cell must by-pass the end-replication problem, which in 90% of cancers is done by expressing the enzyme telomerase Shay et al. (2012). Telomerase, which mainly consists of the two components TERT and TERC, elongates the telomeres such that the telomere length of cancer cells is maintained during replication Blasco (2007). Besides being present in cancer cells, telomerase is also found in stem cells and germ line cells Hiyama and Hiyama (2007).
The amount of telomerase in germ line cells is sufficient to maintain telomere length Blasco (2005). For stem cells, however, the level of telomerase is so low that telomeres are still shortened after each cell division, but at a lower rate than for somatic cells Cong et al. (2002).
It is an open question why stem cells express telomerase, and why the level of telomerase is not high enough to avoid a shortening of the telomere length throughout life.
It has been suggested that telomere shortening is a trade-off between limiting oncogenesis and reducing physiological ageing Campisi et al. (2001); Campisi (2005b); Rodier and Campisi (2011).
The capability of cells to tune their telomere shortening rate by varying the expression of telomerase suggests the possibility of optimal telomere shortening strategies.
In this paper we present a stochasticl model that analyses how shortening of stem cell telomeres are coupled to the trade-off between ageing and postponing cancer. Previous mathematical models for telomere dynamics have mostly focused on the cellular transition to a senescent state Portugal et al. (2008); op den Buijs et al. (2004), and previous cancer models have focused mostly on oncogenesis Tomlinson et al. (2002); Beckman and Loeb (2006). This work tries to bridge these areas of focus, developing a more coherent mathematical modelling framework for considering telomere dynamics in relation to both senescence and cancer. We find that there exists a telomere shortening rate that optimizes the cancer free life span of the organism. Our results also show that a suboptimal cancer free life span strategy may be selected in order to reduce the risk of cancer before the childbearing age.
II The model
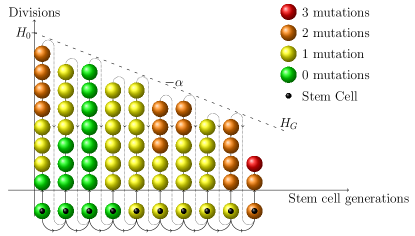
The stochatic model describes the accumulation of cancerous mutations in a multicellular organism, where each cell division will result in a shortening of the telomere sequence due to the end-replication-problem.
Mutations can arise during division of either somatic cells or stem cells. Initially an unmutated stem cell divides, thereby creating a somatic cell and a daughter stem cell. The somatic cell then proliferates until it, after divisions, reaches the Hayflick limit and undergoes senescence.
The Hayflick limit can be interpreted as the conversion of an initial telomere length, since a correlation between the replicative capacity of a cell and its initial telomere length has been shown Allsopp et al. (1992).
During each division, the somatic cell has a probability of acquiring a cancerous mutation, which is then propagated through the cell lineage in our model. In order to maintain homeostasis, only one daughter cell survives after each replication.
When the somatic cell has gone senescent it is removed and all mutations accumulated in the somatic cell lineage are lost.
The daughter stem cell then divides to produce a new daughter stem cell and a new generation of somatic cells.
Each time a stem cell divides, the Hayflick limit is reduced by a constant amount , corresponding to the daughter stem cell having shorter telomeres than its parent. Additionally, there is a probability of a cancerous mutation occurring in the self-renewing stem cell. Such mutations are permanent and are inherited by all stem cells in the stem cell lineage in the model.
If at any point the cell accumulates more than mutations, the organism is no longer cancer free. This will inevitably happen as mutations are steadily accumulated in the stem cell lineage, such that somatic cell lines start with more and more mutations.
The total number of cell divisions that the system undergoes before the onset of cancer is interpreted as the cancer free life span of the organism. A schematic illustration of the model is shown in Fig. 1.
III Theoretical analysis
In this section we derive a mathematical expression for the average cancer free life span obtained for different telomere shortening strategies.
Each time a stem cell is introduced to the tissue, the Hayflick limit is reduced from its initial value due to the telomere shortening of the stem cell. After generations the Hayflick limit is given by
| (1) |
where denotes rounding to the nearest integer. During each of the subsequent cell divisions, the cells have a probability of acquiring a cancerous mutation. The probability that the cell line acquires or fewer mutations before it reaches the Hayflick limit is given by the Binomial cumulative distribution function
| (2) |
At each stem cell division there is a risk of acquiring a permanent mutation in the stem cell lineage. The probability for the organism to have mutations in the stem cells after generations, but still be cancer free, is denoted . This is given by the recurrence relation
| (3) |
where the expression in the bracket is the probability of having mutations in the stem cell, and is the probability of not exceeding the critical number of mutations during the somatic divisions, thereby developing cancer.
The initial stem cell is unmutated, , so in terms of Kroeniker-delta the starting condition is
| (4) |
Using Eq. (3) and Eq. (4), the system can be solved numerically. Notice that when , the Hayflick limit will eventually drop to zero, after which the stem cell undergoes senescence even if the cell line is still cancer free. According to Eq. (1) this will happen after generations, which therefore gives an upper bound for the total cancer free life span of the organism.
The overall probability that the organism will not have developed cancer at a given generation is defined as.
| (5) |
The average cancer free life span is the mean number of cell divisions the organism will live before exceeding the critical number of mutations. It can be found by multiplying the probability of getting cancer at each generation by the number of cancer free generations and the average Hayflick limit each of these consisted of.
| (6) |
When the Hayflick limit is constant and Eq. (6) becomes
| (7) |
Note that for this case will never reach 0 and a cut off is necessary. This is made when and has negligible influence on the cancer free life span.
IV Results
We now fix the ratio between the mutation probabilities such that according to Albertini et al. (1990); Cervantes et al. (2002), and set = 10-2 and .
These choices of parameter values are not essential for the conclusions and other choices yield qualitatively similar results (see supplementary material).
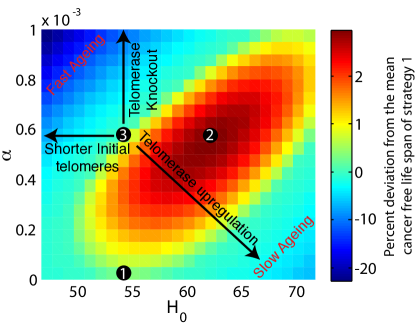
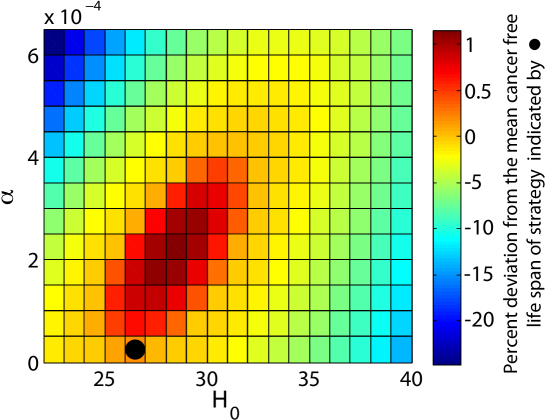
The average cancer free life span is calculated from Eq. (6) and Eq. (7) and their performance compared to the strategy with no stem cell telomere shortening that yields the longest cancer free life span, as obtained from Eq. (7). The result is shown in Fig. 2, where three strategies for further study are labeled in the following way:
-
1.
The strategy where stem cells express a telomerase activity, such that the telomere length of stem cells is constant over time (). The initial Hayflick limit is chosen such that the cancer free life span is maximized.
-
2.
The strategy that gives the longest cancer free life span when allowing stem cell telomeres to shorten at each division (). Again, the initial Hayflick limit is chosen such that the cancer free life span is maximized. This results in a larger initial Hayflick limit than for strategy 1.
-
3.
The strategy that combines the initial Hayflick limit from strategy 1 and the stem cell telomere shortening rate from strategy 2. Note that this strategy yields similar cancer free life span as obtained for strategy 1.
The shorter the telomere length of stem cells is, the more frequent is the need for self renewal in order to maintain homeostasis in the tissue. Every self renewal is accompanied with the risk of accumulating an additional permanent mutation Cervantes et al. (2002). Therefore, a lower value for increases the rate at which mutations occur in the stem cells.
Furthermore, a shorter will reduce the amount of cell divisions before stem cell senescence, resulting in faster ageing and a shorter maximum cancer free life span.
Keeping fixed and down-regulating the telomerase production is equivalent to increasing , thus moving upwards in Fig. 2. The higher will suppress the risk of developing cancer, as the risk can be managed by undergoing fewer divisions before senescence. The higher turnover rate results in systems where cancer is rarely developed, but where the cancer free life span of otherwise healthy cell lineages is limited by stem cells going senescent.
Up-regulation of telomerase in stem cells results in a lower while up-regulation of telomerase in somatic cells will increase the proliferation potential, which is equivalent to a higher . These two effects combined can, therefore, in Fig. 2 be illustrated as a shift downwards to the right.
This shift of strategy can in small quantities be advantageous and prolong life, but is also associated with an increased risk of developing cancer since somatic cells are able to continue proliferating for longer before the senescent fail-safe mechanism sets in.
These observation are supported by Fig. 3a and 3b, which show the probability of the organism to still be cancer free as a function of time, for each of the strategies 1, 2, and 3.
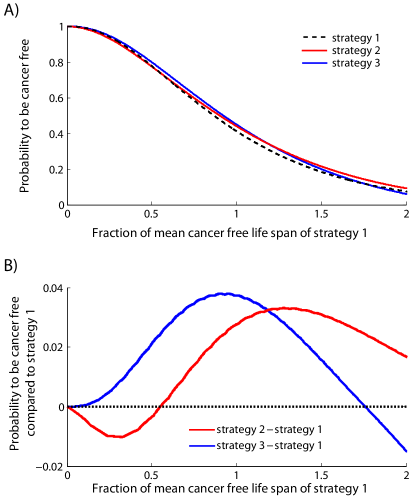
Surprisingly, we see that strategy 2, which yields the longest cancer free life span, is also the one that is most exposed to cancer early in life. This strategy benefits from less stem cells attrition late in life, thereby supplying the system with less mutated cells, which in the end increases the average time before cancer development. Minimizing the risk of developing cancer at an early age can be done by lowering , raising , or both. With strategy 3 a higher percentage of a population would therefore still be a cancer free in the early in life compared to other strategies as 1 and 2 that have similar or longer cancer free life span.
These results indicate that evolution would favour species with a restricted telomerase production in their stem cells above species that maintain their stem cells telomere length fully throughout life. This shortening rate can then be adjusted such that a lower cancer risk is obtained at the childbearing age, thereby increasing the chance of giving birth.
Therefore, strategies that solely optimize cancer free life span may not be advantageous from an evolutionary point of view, if they increase the risk of cancer early in life when reproduction takes place, as seen with strategy 2. We also find that cancer free life span for some strategies, e.g. Strategy 3, can be prolonged even further if telomerase is up-regulated at a later stage in life (see supplementary materials).
Strategy 3 and other stem cell shortening strategies are not without downsides, as the somatic cells will undergo senescence after fewer and fewer divisions. Shorter telomeres and an accumulation of senescent cells are closely related to biological ageing Cawthon et al. (2003b); Herbig et al. (2006), hence, strategies that suppresses cancer early in life by shortening their telomeres are associated with accelerated aging.
V Discussion and conclusion
In our model a decrease of telomerase activity (TERT or TERC) leads to a faster shortening of stem cell telomeres per cell division. Our model predicts that any reduction of telomerase activity decreases the risk of cancers early in life, but at the same time causes a higher rate of stem cell replications. The increased replication rate leads to an increased rate of cancerous mutations in the stem cells. For certain regimes the advantages of telomerase activity down regulation resulting in a low risk of cancer early in life is outweighed by the higher risk of cancer later in life, and therefore the total cancer free life span of the organism is reduced. The increased cancer risk when telomerase is removed was observed in a study by González et al. (2000) , where they found a slight increase in oncogenesis in highly proliferating tissue for TERC deficient miceGonzález-Suárez et al. (2000). In addition our model also predicts that stem cells will go senescent faster, and therefore cause faster ageing. This is also consistent with experimental observations; in a TERC mouse study Liu et al. (1998) found that a lack of telomerase caused the mice to present premature ageing symptoms, especially in highly proliferating tissue Lee et al. (1998).
Our model demonstrates that telomerase up-regulation, in general, leads to an organism more prone to developing cancer, which was observed experimentally by González et al. (2002)González-Suárez et al. (2002).
Furthermore, the model predicts that a temporal induction of telomerase could increase cancer free life span (see Supplementary). If the organism starts with a moderate telomerase activity and then increases the activity, the organism could prevent cancer onset at an early stage of life and postpone ageing, thereby increasing longevity. A recent study by Bernandes de Jesus et al. (2012) supports this result. By inducing telomerase activity in adult mice, they were able to increase longevity without increasing the risk of cancer Bernardes de Jesus et al. (2012).
Additionally, it has been shown that, when comparing two types of TERC deficient mice with different genetic backgrounds - one type with initially shorter telomeres and one with normal initial telomere length - the mice with shorter telomeres show decreased viability, not due to cancer, but due to premature ageing Rudolph et al. (1999); Herrera et al. (1999). Our model demonstrates that decreasing leads to a faster attrition of the stem cell pool and therefore faster ageing.
In conclusion, our model offers an explanation to why stem cells express telomerase at a moderate level, such that their telomere lengths are not conserved but is shortened at a lower rate than in somatic cells. Furthermore, our results suggest that, in stem cells, evolution will favor short initial telomeres that are slowly shortened at each division (strategy 3), as this strategy is able to reduce the likelihood of cancer early in life.
References
- Blasco (2005) M. A. Blasco, Nat Rev Genet 6, 611 (2005).
- Lorenz et al. (2001) M. Lorenz, G. Saretzki, N. Sitte, S. Metzkow, and T. von Zglinicki, Free Radical Biology and Medicine 31, 824 (2001).
- Huffman et al. (2000) K. E. Huffman, S. D. Levene, V. M. Tesmer, J. W. Shay, and W. E. Wright, Journal of Biological Chemistry 275, 19719 (2000).
- Campisi and d’Adda di Fagagna (2007) J. Campisi and F. d’Adda di Fagagna, Nat Rev Mol Cell Biol 8, 729 (2007).
- Campisi (2005a) J. Campisi, Cell 120, 513 (2005a).
- Cawthon et al. (2003a) R. M. Cawthon, K. R. Smith, E. O’Brien, A. Sivatchenko, and R. A. Kerber, Lancet 361, 393 (2003a).
- Collado et al. (2007) M. Collado, M. A. Blasco, and M. Serrano, Cell (2007).
- Bendtsen et al. (2012) K. M. Bendtsen, J. Juul, and A. Trusina, PloS one 7, e36018 (2012).
- Collado and Serrano (2010) M. Collado and M. Serrano, Nature Reviews Cancer 10, 51 (2010).
- Alberts (2008) B. Alberts, Molecular Biology of the Cell, Reference Edition (Garland Pub, 2008).
- Beckman and Loeb (2005) R. A. Beckman and L. A. Loeb, Seminars in cancer biology (2005).
- Hiyama and Hiyama (2007) E. Hiyama and K. Hiyama, British journal of cancer (2007).
- Shay et al. (2012) J. W. Shay, R. R. Reddel, and W. E. Wright, Science 336, 1388 (2012).
- Blasco (2007) M. A. Blasco, Nature chemical biology (2007).
- Cong et al. (2002) Y.-S. Cong, W. E. Wright, and J. W. Shay, Microbiology and molecular biology reviews 66, 407 (2002).
- Campisi et al. (2001) J. Campisi, S.-h. Kim, C.-S. Lim, M. Rubio, et al., Experimental gerontology 36, 1619 (2001).
- Campisi (2005b) J. Campisi, Mech. Ageing Dev. (2005b).
- Rodier and Campisi (2011) F. Rodier and J. Campisi, The Journal of Cell Biology 192, 547 (2011).
- Portugal et al. (2008) R. D. Portugal, M. G. P. Land, and B. F. Svaiter, Biosystems 91, 262 (2008).
- op den Buijs et al. (2004) J. op den Buijs, P. P. J. van den Bosch, M. W. J. M. Musters, and N. A. W. van Riel, Mech. Ageing Dev. 125, 437 (2004).
- Tomlinson et al. (2002) I. Tomlinson, P. Sasieni, and W. Bodmer, The american journal of pathology 160, 755 (2002).
- Beckman and Loeb (2006) R. A. Beckman and L. A. Loeb, PNAS 103, 14140 (2006).
- Allsopp et al. (1992) R. C. Allsopp, H. Vaziri, C. Patterson, S. Goldstein, E. V. Younglai, A. B. Futcher, C. W. Greider, and C. B. Harley, Proceedings of the National Academy of Sciences 89, 10114 (1992).
- Albertini et al. (1990) R. J. Albertini, J. A. Nicklas, J. P. O’Neill, and S. H. Robison, Annual review of genetics 24, 305 (1990).
- Cervantes et al. (2002) R. B. Cervantes, J. R. Stringer, C. Shao, J. A. Tischfield, and P. J. Stambrook, Proceedings of the National Academy of Sciences 99, 3586 (2002).
- Cawthon et al. (2003b) R. M. Cawthon, K. R. Smith, E. O’Brien, A. Sivatchenko, and R. A. Kerber, The Lancet 361, 393 (2003b).
- Herbig et al. (2006) U. Herbig, M. Ferreira, L. Condel, D. Carey, and J. M. Sedivy, Science 311, 1257 (2006).
- González-Suárez et al. (2000) E. González-Suárez, E. Samper, J. M. Flores, and M. A. Blasco, Nat Genet 26, 114 (2000).
- Lee et al. (1998) H. W. Lee, M. A. Blasco, G. J. Gottlieb, J. W. Horner, C. W. Greider, and R. A. DePinho, Nature 392, 569 (1998).
- González-Suárez et al. (2002) E. González-Suárez, J. M. Flores, and M. A. Blasco, Molecular and cellular biology 22, 7291 (2002).
- Bernardes de Jesus et al. (2012) B. Bernardes de Jesus, E. Vera, K. Schneeberger, A. M. Tejera, E. Ayuso, F. Bosch, and M. A. Blasco, EMBO Molecular Medicine 4, 691 (2012).
- Rudolph et al. (1999) K. L. Rudolph, S. Chang, H.-W. Lee, M. Blasco, G. J. Gottlieb, C. Greider, and R. A. DePinho, Cell 96, 701 (1999).
- Herrera et al. (1999) E. Herrera, E. Samper, J. Martín-Caballero, J. M. Flores, H.-W. Lee, and M. A. Blasco, The EMBO Journal 18, 2950 (1999).
– SUPPLEMENTARY MATERIAL –
In this supplementary note, we show that the choices of the parameter values and are not essential for the overall conclusions drawn in the article regarding cancer free life span obtained by shortening the Hayflick limit after each stem cell division.
VI
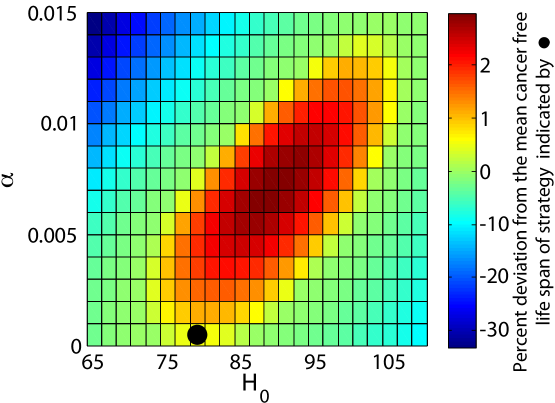
We here present three cases where the value of one parameter is varied, compared to those used for generating figure 2 in the article, while the two others kept constant. We show again, that some shortening strategies can both prolong life and postpone cancer early in life, and that the benefits of this depends on the choice of parameter values. The black dot on the figures represents the strategy with a constant Hayflick limit that produces the longest cancer free life span. First we keep and fixed and change to 4. See figure 4
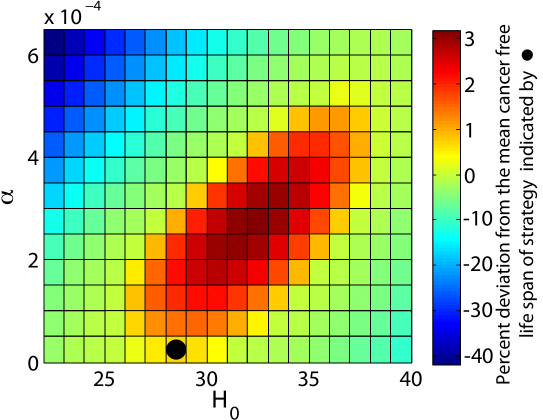
Second, the stem cell mutation rate is increased by a factor 10, with and kept fixed. See figure 5
Lastly, the mutation rate for somatic cells is increased by a factor 2, with and kept unchanged. See figure 6
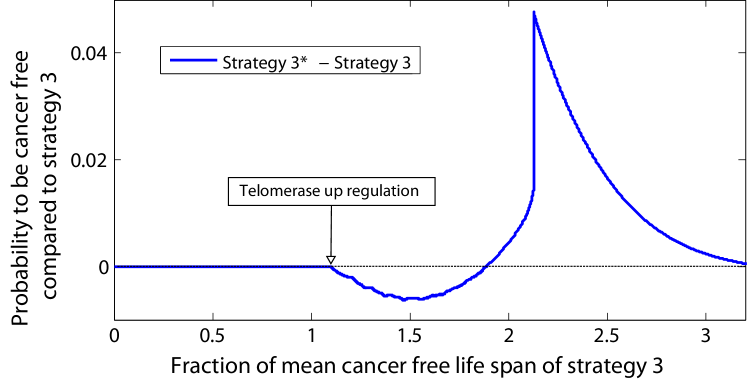
In order to verify that life can be prolonged by adding telomerase later in life, we here present one example of how this could occur. In this example we compare strategy 3 with strategy 3*. Strategy 3* has the same initial conditions as strategy 3, but will, when reaching = 39, double its telomerase production (halving ) for the remaining cancer free life span. With this up-regulation in telomerase production the longevity can be increased. The increased cancer free life span relies solely on the ability to postpone stem cell senescence by stimulating it with telomerase. The steep peak in Fig. (7), which is seen after a time 2.1 longer than the mean cancer free life span, is caused by the stem cells of strategy 3 going senescent so immediately drops to 0.