Supplementary Online Material for
Statistical modelling of summary values
leads to accurate Approximate Bayesian Computations
S1 Univariate equivalence statistics
We abbreviate for convenience and , their sample means , and standard deviations , .
Location equivalence, normal , .
Suppose the and , and , are iid normal with means , and common, unknown variance . Consider the maximum likelihood estimate of . Following Schuirmann (1981), we reject the one-sample version of the two one-sided test statistics (TOST)
when simultaneously and in order to test
Here, is the lower percentile of a Student t-distribution with degrees of freedom. The test is size- (Berger and Hsu, 1996) and centred at when . In this case, the power of the TOST is
with , and approximated by replacing in by (Owen, 1965).
Dispersion equivalence, normal , .
See main text.
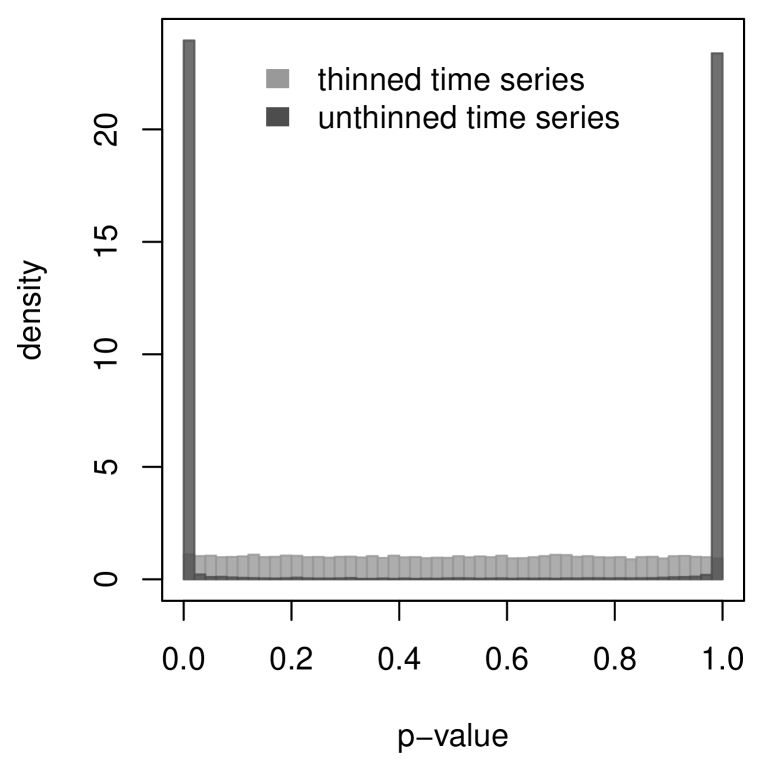
Equivalence in autocorrelations, normal , .
Suppose the pairs , , and are bivariate normal with correlations and for fixed and respectively. Thin to , , and , such that these pairs can be considered independent. Compute the sample Pearson correlation coefficients , and their Z-transformations , , using , which are approximately normal with mean , and variance (Hotelling, 1953). Let , which is a slightly biased estimate of (Hotelling, 1953). We reject the TOSZ
for
when simultaneously and , where is the lower percentile of a standard Normal. Since the one-sided tests are both approximately size-, the TOSZ is also approximately size- (Berger and Hsu, 1996). It is centred at when . Under the normal approximation, the power of the TOSZ is in this case
S2 Calibration procedures
For the simple auxiliary probability models considered here, test statistics can be found such that the power function is continuous in , , and enjoys monotonicity properties such that calibrations are particularly straightforward. First, for each , it is possible to calibrate the tolerances so that the univariate power functions are maximised at the point of equality .
Lemma 1
(Univariate calibration of )
Suppose A2.1-A2.3 hold true. Consider critical regions for tolerance regions with fixed and let . Let and suppose that is small. There are , such that and , and such that can be found with the binary search procedure
Proof of Lemma 1: Let . By A2.1, we have . Using A2.3, decreases as decreases, so there is such that . Since is continuous, there is exactly one solution such that , and this solution can be found with a binary search algorithm. \qed
These calibrations determine as a function of , ; and possibly further statistics of the simulated and observed summary values in case of a composite hypothesis test. Second, we calibrate for given (and if necessary) such that the univariate power functions are not flat around .
Lemma 2
(Univariate calibration of )
Suppose A2.1-A2.3 hold true. Consider rejection regions for equivalence regions such that and denote the maximal power by . Suppose that is small. Then, there are such that and and can be found by the binary search procedure
Proof of Lemma 2: Let . By Lemma 1, the calibrated is also . Since is continuous and level-, we have which is of course smaller than . We next show that is monotonically increasing with . Consider along with two tests , for equivalence regions and . Let be calibrated for . Let . By Lemmas 3.7.1 and 3.4.2(iv) in (Lehmann and Romano, 2005), and for all . Consider now for such that is calibrated for . We have by Lemma 1. Repeating the same argument as above, we obtain for all . This implies in particular . Thus, there is such that . By A2.1, is continuous. Hence, there is such that and this can be found with a binary search procedure. \qed
The ABC approximation is now correctly centred but may still be broader than due to the diluting effect of the tolerances . In this case, we also calibrate the number of simulated data points used for each (given further statistics if a composite hypothesis test is used).
Lemma 3
(Univariate calibration of ) Suppose A2.1-A2.4 hold true. Consider rejection regions for simulated and observed summary values such that and . Denote the signed Kullback-Leibler divergence between the probability densities associated with the summary likelihood and the power function by
where
and and . There is such that and can be found by the binary search procedure
Proof of Lemma 3: Consider the densities
for calibrated , . If , then is found. We now suppose that . We first show that is monotonically increasing with . Since is consistent, we have for fixed , that is larger than for all . This implies by Lemma 2 that the calibrated is inside the calibrated . To compare the power of the calibrated tests and , note that is non-zero, and that , , . Along the lines of Lemma 3.4.2(iv) in (Lehmann and Romano, 2005), it follows that for all . This implies . In particular, there is such that . Since , there is that minimises and this can be found with a binary search algorithm. \qed
S3 Proofs of the two Theorems
Proof of Theorem LABEL:th:accurate: Since the prior densities are assumed flat, we have for all that . By A4-A5, we have and similarly for so that . Since the Kullback-Leibler divergence is invariant under parameter transformations, the claim follows with A1-A3.\qed
Proof of Theorem LABEL:th:map: Following the calibration of all , the univariate power functions have a mode at . By A4, the mode of the multivariate is . By A5, the MLE of the multivariate is also . Since is bijective, the ABC⋆ MLE is also the same as the exact MLE. Next, we have that does not change the location of the modes of and of , so the modes of and are again . Since grows slower than decays around , the mode of is . We suppose that the power of the test is broader than , so that also controls the change of variables. Therefore, the mode of is also . \qed
S4 Further details on the moving average example
S4.1 Prior density
We assume a uniform prior on . To obtain the prior induced on we decompose the joint as follows:
where is a generic density specified by its arguments.
S4.1.1 Calculation of
We define the following link function, , which is monotonically increasing on and whose inverse is . Since is linear on we have:
| (S1) |
S4.1.2 Calculation of
We first compute the and then differentiate it to obtain the . We define the following link function, which is monotonically increasing on and whose inverse is
We can now compute:
and thus:
| (S2) |
S4.1.3 Calculation of
| (S3) |
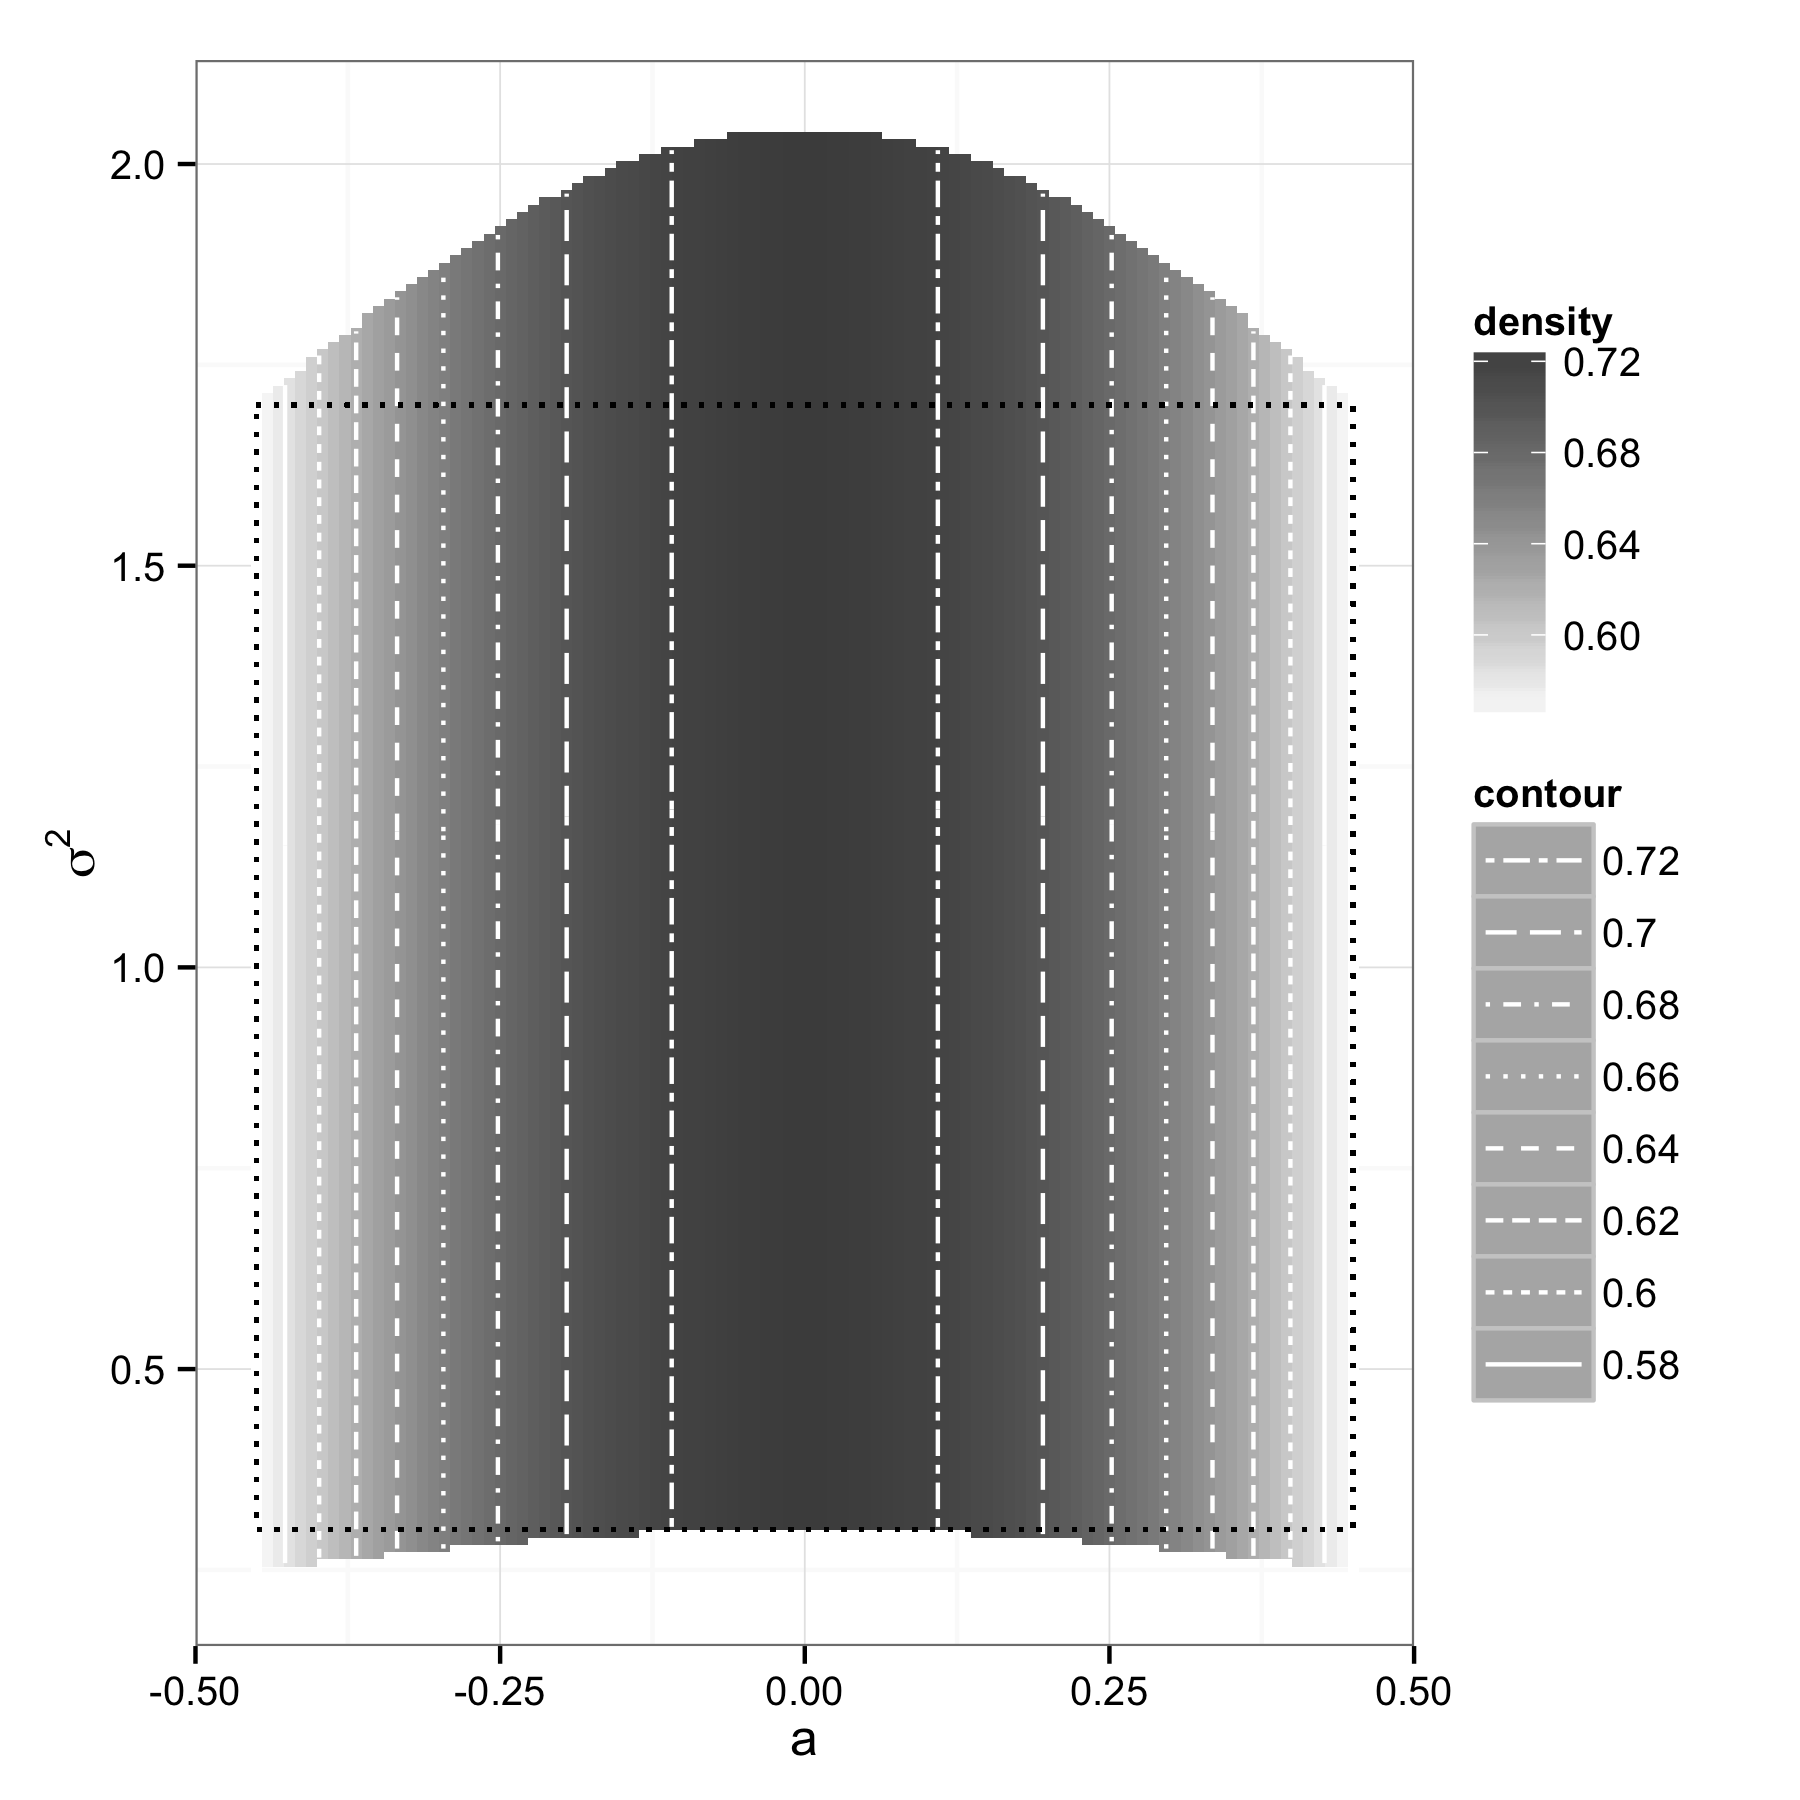
From a practical point of view it is more natural to parametrize the prior on by specifying boundaries for and rather than for and . For given boundaries on we propose to choose the following boundaries for the uniform prior on :
| (S4) |
which ensures that the prior induced on contains the rectangle . With these bounds the expression of becomes:
| (S5) |
An example of prior induced on is shown in Figure S3.
S4.2 Markov Chain Monte Carlo algorithm for estimating
When inferring the parameters of , the past white noise needs also to be inferred. However, since we used simulated data and were interested in the exact posterior of we simply fixed and used the likelihood of conditional on given by Marin and Robert (2007):
| (S6) |
where the are given by the recursive formula:
We implemented a Metropolis-Hasting MCMC algorithm with a bivariate gaussian kernel proposal truncated to the natural support of : and with covariance matrix:
leading to an acceptance rate of . We ran and combined 6 chains for iterations, starting near the true parameter values.
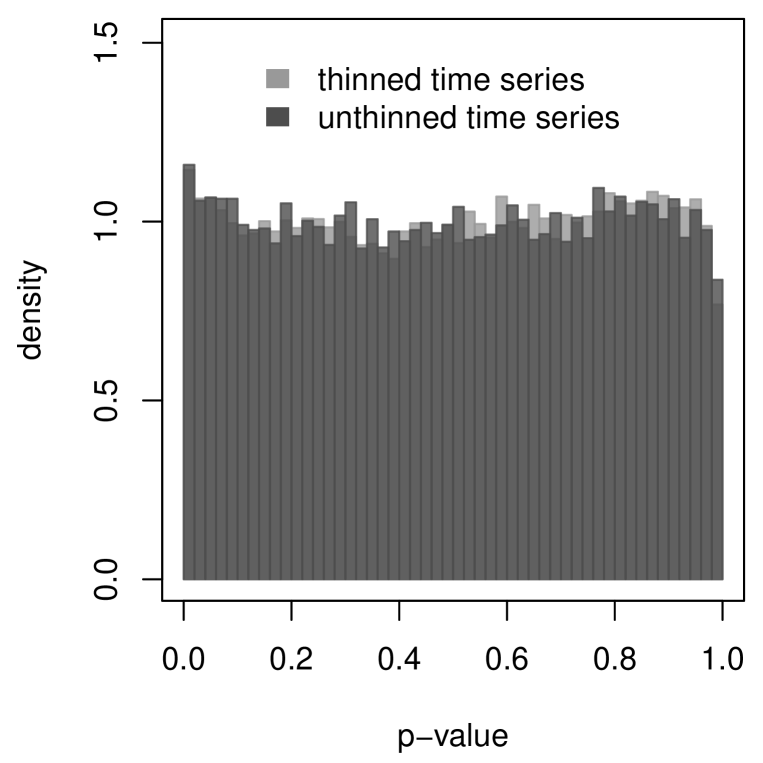
S4.3 ABC⋆ subsetting procedure
We considered the following subsets for given time series data . First, autocorrelations in were ignored, leading to , and , for the variance and correlation test respectively. Second, we thinned to and , for two variance tests, and used and and for three correlation tests.
S4.4 Influence of the link function
The rate of change is non-linear and may compromise the accuracy of point estimates of . This is particularly so when is broad so that has considerable support to act on. To illustrate, we increased the sample size but did not re-calibrate , expecting that is increasingly inaccurate as the power function plateaus at one. We ran ABC⋆ for different pseudo data sets that increase from to . The was indeed increasingly inaccurate when the are not re-calibrated for each (light gray dots in Figure S4D). We repeated inference, now with the re-calibrated so that power peaks at . There was no systematic difference between and the exact MAP estimate (A6 met, dark gray dots in Figure S4D). The amount of data available controlled and the calibrations ensured that the ABC⋆ MAP estimate was very close to (A6 met; Figure S4D-E).
S5 Advanced ABC⋆ algorithms
S5.1 Markov Chain Monte Carlo algorithm (MCMC)
The MCMC algorithm follows from (Marjoram et al., 2003). Set initial values , compute and for all . We suppose that for all .
- ABC⋆-m1
-
If now at , propose according to a proposal density .
- ABC⋆-m2
-
Simulate , extract for all .
- ABC⋆-m3
-
Compute for all .
- ABC⋆-m4
-
Accept with probability
and otherwise stay at . Return to ABC⋆-m1.
Throughout, we used a Gaussian proposal kernel. Annealing procedures were added to the covariance matrix of the Gaussian proposal kernel and the tolerances , during burn-in.
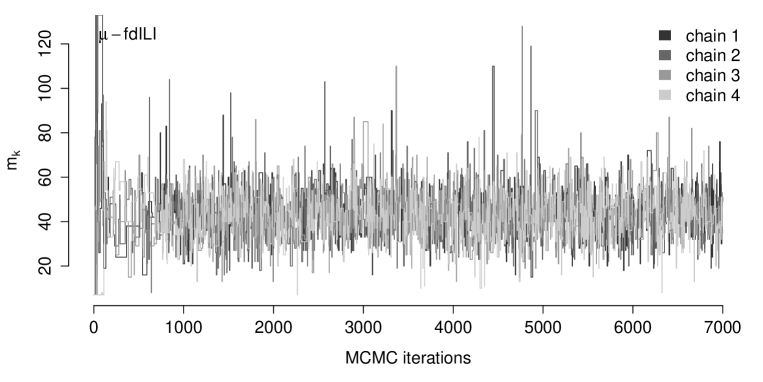
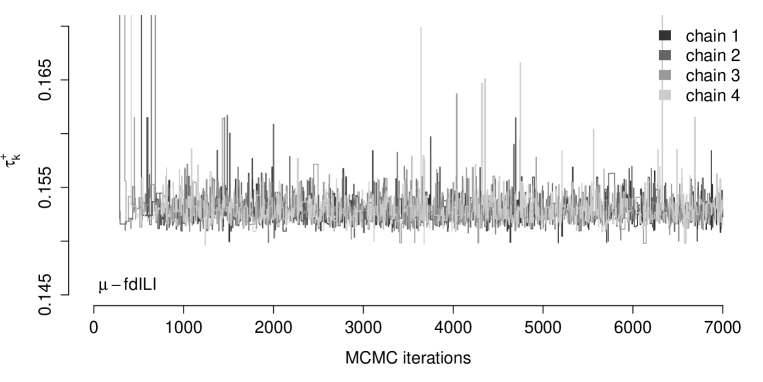
For the influenza time series example, we previously used a standard ABC MCMC algorithm with annealing schemes on the covariance matrix of a Gaussian proposal matrix and the tolerances. The covariance matrix was diagonal. For ABC⋆, the calibrated , were considerably smaller than those used previously in the standard ABC routine, and we were forced to improve the MCMC sampler. We estimated a more suitable covariance matrix for the proposal density from a sequence of pilot runs, and also employed an annealing scheme on the covariance matrix as well as the tolerances , .
S5.2 Sequential Importance sampling algorithm
This algorithm follows in analogy to the above from (Toni et al., 2008).
S6 Supplementary Figures

A

B

C
A
B
C
D

| description | prior density | meanstd. dev., 95% conf. interval of | ||
|---|---|---|---|---|
| standard ABC | ABC⋆ | |||
| posterior density | posterior density | |||
| Basic reproductive | 3.740.39, [3.01, 4.37] | 3.510.02, [3.47, 3.54] | ||
| number | ||||
| Avg incubation | 0.9 § | |||
| period [day] | ||||
| Avg infectiousness | 1.8 § | |||
| period [day] | ||||
| Avg duration | 11.11.58, [8.15, 13.76] | 9.930.07, [9.79, 10.07] | ||
| of immunity [year] | ||||
| Reporting rate | 0.0920.02, | 0.0799, | ||
| [0.058, 0.133] | [0.0791, 0.0808] | |||
| Size of sink | 106 | |||
| population | varies in time† | |||
| Size of source | ∗ | ∗ | ||
| population | 108 | |||
| Birth/death rate of | fixed† | |||
| sink population | ||||
| Birth/death rate of | 1/50 ¶ | |||
| source population, | ||||
| [1/year] | ||||
| Seasonal forcing of | ∗ | ∗ | ||
| Seasonal forcing of | ∗ | ∗ | ||
| Number of travelers | ∗ | ∗ | ||
| visiting the sink | † | |||
| population† | ||||
| Fraction of re- | ∗ | ∗ | ||
| seeding the source | ||||
| population | ||||
| in the analogue of (LABEL:e:classofmodels) for the source population is defined by where is the | ||||
| number of infected individuals at disease equilibrium in the source. †Fixed to demographic data | ||||
| http://statline.cbs.nl. Number of travellers encompass annual records. §Fixed to match influenza | ||||
| A (H3N2)’s estimated generation time ¶Assuming an average lifespan of 60 years, adjusted by | ||||
| net fertility rate in SE Asia ∗For the simulated data set, these parameters were fixed to the | ||||
| values reported in Figure LABEL:f:SEIIRS_datasets. | ||||
A
B
References
- Berger and Hsu (1996) Berger, R. and J. Hsu (1996). Bioequivalence trials, intersection-union tests and equivalence confidence sets. Statistical Science 11(4), 283–319.
- Box et al. (2011) Box, G., G. Jenkins, and G. Reinsel (2011). Time series analysis: forecasting and control. Wiley.
- Hotelling (1953) Hotelling, H. (1953). New light on the correlation coefficient and its transforms. Journal of the Royal Statistical Society. Series B (Methodological) 15(2), 193–232.
- Lehmann and Romano (2005) Lehmann, E. and J. Romano (2005). Testing statistical hypotheses. Springer.
- Marin and Robert (2007) Marin, J.-M. and C. P. Robert (2007). Bayesian core: a practical approach to computational Bayesian statistics. Springer.
- Marjoram et al. (2003) Marjoram, P., J. Molitor, V. Plagnol, and S. Tavaré (2003). Markov Chain Monte Carlo without likelihoods. Proceedings of the National Academy of Sciences USA 100(26), 15324–15328.
- Owen (1965) Owen, D. (1965). A special case of a bivariate non-central t-distribution. Biometrika 52(3/4), 437–446.
- Royston (1993) Royston, P. (1993). A pocket-calculator algorithm for the Shapiro-Francia test for non-normality: An application to medicine. Statistics in Medicine 12(2), 181–184.
- Schuirmann (1981) Schuirmann, D. (1981). On hypothesis testing to determine if the mean of a normal distribution is contained in a known interval. Biometrics 37(617), 137.
- Toni et al. (2008) Toni, T., D. Welch, N. Strelkowa, A. Ipsen, and M. P. H. Stumpf (2008). Approximate Bayesian computation scheme for parameter inference and model selection in dynamical systems. Journal of The Royal Society Interface 6(31), 187–202.