Infrared and Raman spectroscopy measurements of a transition in the crystal structure and a closing of the energy gap of BiTeI under pressure
Abstract
BiTeI is a giant Rashba spin splitting system, in which a non-centro symmetric topological phase has recently been suggested to appear under high pressure. We investigated the optical properties of this compound, reflectivity and transmission, under pressures up to GPa. The gap feature in the optical conductivity vanishes above GPa and does not reappear up to at least GPa. The plasma edge, associated with intrinsically doped charge carriers, is smeared out through a phase transition at GPa. Using high pressure Raman spectroscopy, we follow the vibrational modes of BiTeI, providing additional clear evidence that the transition at 9 GPa involves a change of crystal structure. This change of crystal structure possibly inhibits the high-pressure topological phase from occurring.
pacs:
72.20,-i, 74.62.Fj, 78.20.-eInterest in the non-centrosymmetric semiconductor BiTeI surged when it was found that this compound hosts the largest known Rashba spin splitting in bulk form Ishizaka et al. (2011); Crepaldi et al. (2012); Landolt et al. (2012). While this material is structurally related to the recently discovered bismuth chalcogenide topological insulators Xia et al. (2009); Zhang et al. (2009), it is an insulator of the common variety at ambient pressure. Recent first-principles band structure calculations suggested that BiTeI undergoes a transition to the topological insulating phase under pressure Bahramy et al. (2012), through which BiTeI would become the first example of non-centrosymmetric topological insulator. Moreover, such a band-structure topology change realizes a remarkable example of topological phase transition. While several examples of topological phase transitions occurring upon varying chemical composition have been reported in the literature Xu et al. (2011); Sato et al. (2011); Brahlek et al. (2012), the pressure-induced transition in BiTeI would present the advantage of being controllable and reversible.
Optical conductivity is well suited to probe the band structure of BiTeI under pressure. In this Letter, we determine the high pressure optical properties by measuring transmission and reflectivity of BiTeI up to GPa. We follow the optical gap under pressure and find that it decreases monotonically until GPa. At this pressure the plasma edge associated with the doped carriers is strongly broadened due to a sudden increase of at the plasma frequency. Above this pressure the gap feature in the optical conductivity has disappeared, and it does not reappear to the highest pressure reached. The high pressure phase appears to be metallic. Using Raman spectroscopy, we observe a sudden change in the number and frequency of the vibrational modes at GPa, which shows that a structural transition occurs at this pressure.
Single crystals of BiTeI were grown by the floating zone method, starting from the stoichiometric ratio of metallic bismuth, tellurium and bismuth iodide. The unit cell of BiTeI is composed of triple layers, Te–Bi–I, stacked along the polar c-axis Ishizaka et al. (2011). The triple layers are bound by a weak van der Waals interaction. The structure is described by the non-centrosymmetric space group .
At ambient pressure, the reflectance was measured at a near-normal angle of incidence on a freshly-cleaved surface, from meV to eV using an in situ evaporation technique. The complex dielectric function and the optical conductivity were obtained by Kramers-Kronig transformation of the reflectivity, supported by spectroscopic ellipsometry data from eV to eV. Knowing the optical constants of diamond, we converted the vacuum-sample reflectivity to one at the diamond-sample interface, . Transmission was measured through a flake of BiTeI using an infrared microscope. Optical data at high pressure were acquired up to GPa with a diamond anvil cell (DAC) at the X01DC IR synchrotron beamline of the Swiss Light Source Akrap et al. (2012); Lerch et al. (2012). Reflectivity was determined in the frequency range from meV to eV for a dense set of pressures. The intensity of radiation reflected from the diamond to sample interface was normalized by the intensity from the interface between the diamond and the metallic (Cu-Be alloy) DAC gasket.
The reflectivity ratios measured in the DAC were calibrated against obtained from the absolute reflectivity measured outside the cell. In order to calculate the complex dielectric function the reflectivity data were fitted for all pressures to a Drude-Lorentz expression. A sufficiently large number of oscillators (variational dielectric function Kuzmenko (2005)) was used so as to reproduce all fine details of the reflectivity spectra. Transmission was measured from meV to eV for a fine mesh of pressure points. Raman spectra at high pressure were recorded using the same DAC up to GPa, with daphne oil as pressure medium and a home-made micro Raman spectrometer.
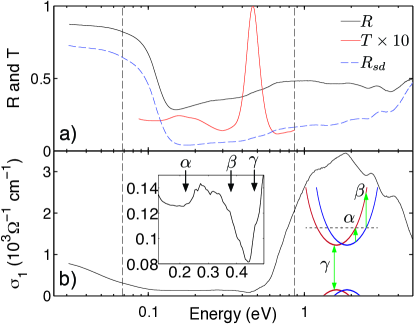
Reflectance and transmission data are shown in Fig. 1a at ambient pressure and room temperature. A sharp plasma edge appears in the reflectance at eV, and near eV a kink is observed. Transmission through a m thick flake of BiTeI in the mid infrared range displays a maximum around eV, which matches the frequency of the kink in the reflectivity. Another small peak in the transmission is observed at eV and concurs with the plasma edge in the reflectance. is the reflectivity expected for the diamond-sample interface, showing similar features as the reflectivity with a plasma edge at the same position.
The real part of the optical conductivity shown in Fig. 1b is gapped below eV, which is just above the energy of the maximum in transmission. Simultaneously, a Drude contribution emerges below 0.1 eV which agrees with the metallic behavior of the resistivity as well as with the previous optical studies Lee et al. (2011); Martin et al. (2012); Demkó et al. (2012). This metallic contribution is very likely due to the impurity doping and a slight off-stoichiometry, particularly of iodine because of its high fugacity. We attribute the fine structures in the optical conductivity to the interband transitions and , and the onset of absorption (gap edge) , as sketched in the insets of Fig. 1b Lee et al. (2011); Martin et al. (2012); Demkó et al. (2012).
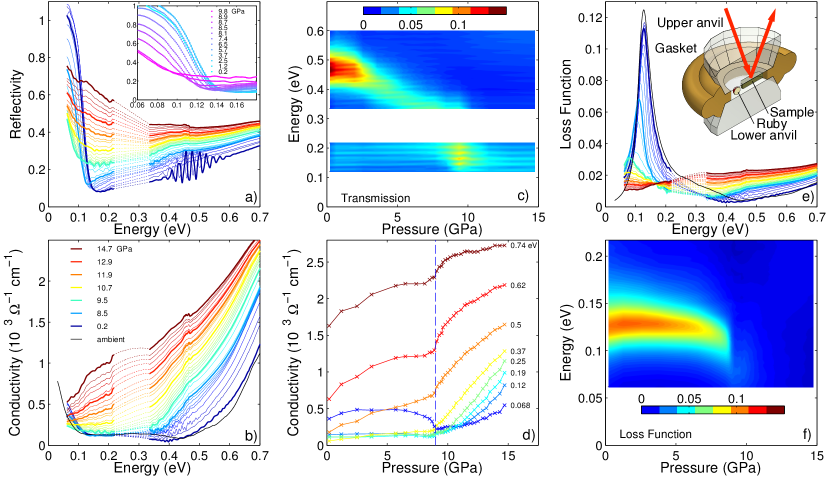
The band structure and the interband transitions are expected to be strongly influenced by pressure Bahramy et al. (2012). Indeed, we observe significant pressure induced changes in the optical properties. Fig. 2a shows the reflectivity as a function of photon energy for various pressures. The reflectivity is measured at a sample-diamond interface, and the levels may be compared to the shown in Fig 1a. The lowest pressure curves contain Fabry-Perot resonances at frequencies just below the gap onset, due to the small sample thickness and the sample transparence. The reflectivity in Fig. 2a has a sharp plasma edge at eV, consistent with Fig. 1a. Very little change is observed up to GPa, and the plasma edge remains at the same energy. There is, however, a gradual increase of the reflectivity level at frequencies above the plasma edge, and a decrease of the level below the plasma edge. Above GPa, the plasma edge suddenly begins to shift towards lower energies, and at GPa it starts to gradually smooth out. Above GPa, the plasma edge disappears, and the reflectivity level now increases across the entire photon energy region. For the highest pressure reached no plasma edge is observed, but the reflectivity has an upturn towards low energies suggesting a metallic state. Overall, the reflectivity experiences a dramatic pressure-induced change in the studied energy range.
The real part of the optical conductivity obtained from the complex dielectric function is shown in Fig. 2b 111The Fabry-Perot oscillations present in the reflectivity in the lower pressure range give artifact oscillations in the dielectric function and the related quantities; these oscillations are therefore filtered out.. Below GPa, the Drude contribution persists almost unchanged, and the high-frequency indicates a gradual shift of the absorption edge towards lower energies. This means that below 0.2 eV there is little change in , whereas above eV increases as the gapped states become filled. As the absorption edge shifts, the dip in at eV gradually disappears with increasing pressure. Above GPa, the Drude contribution disappears from our energy window and becomes rather flat below eV. Around this pressure the slope of changes sign at low energies, from negative to positive. As the pressure increases further, the gap edge shifts more rapidly to lower energies. By GPa, the low energy states (below eV) have been filled and the gap tends toward very low energies. At the highest reached pressures, the gap in appears to be zero or very small. There are two clear limiting cases for the optical gap. At zero pressure, the gap is finite ( eV), and remains above eV up to 9 GPa. At GPa the conductivity is not gapped at room temperature. We cannot attach a precise value to the gap above GPa because it is not accompanied by a clear spectroscopic feature.
The transmission, shown in Fig. 2c 222See also Fig. 4 of the supplemental material, features a sharp peak at eV at low pressure, just below the band gap. It agrees with the ambient pressure transmission shown in Fig. 1a. The position of the transmission maximum redshifts with pressure and diminishes in intensity. This decrease in the maximum intensity is particularly sharp at GPa. The monotonic decrease terminates in an abrupt disappearance of the peak at GPa. The collapse of the transmission peak above GPa suggests that a phase transition is taking place at this pressure. This is in agreement with the reflectivity and the optical conductivity, which indicate that above GPa the gap feature in is gone.
Fig. 2d shows as a function of pressure, for a series of photon energies ranging from eV to eV. Common to all the curves is a sharp kink at GPa. This confirms that at GPa a phase transition takes place which influences the electronic structure. Above GPa, steeply increases in the whole energy range. The optical conductivity at eV shown in Fig. 2d (corresponding to the lower limit of our experimental window of observation), the optical conductivity spectra shown in Fig. 2b and the transmission spectra in Fig. 2c ††footnotemark: , have a gradual variation as a function of pressure between and GPa. In order for our data to be consistent with a quantum phase transition in the range GPa as predicted in Ref. Bahramy et al. (2012) and the signature of which was reported in Ref. Xi et al. (2013), it would be necessary that the full process of closing and reopening of the gap is completed in between the pressure points of Fig. 2, i.e. within a pressure window of about 0.5 GPa.
One of the most striking aspects of the presented data is the abrupt disappearance of the plasma edge for GPa in the reflectivity. The sharp low-pressure plasma edge originates in a well defined Drude peak in , which suggests a coherent charge transport in the low pressure phase ( GPa). To better illustrate the pressure dependence of the plasma frequency, Fig. 2e and 2f show the loss function, . A maximum in the loss function corresponds to the screened plasma frequency. At ambient pressure we observe one such mode at eV and associate it with the intraband plasmon. This plasmon mode widens with pressure and slightly bends towards lower energies above GPa, without appreciable pressure dependence up to GPa. The loss function remaining constant means that the spectral weight of the Drude contribution does not change much. However, at GPa the peak in the loss function suddenly vanishes. The dramatical disappearance of the plasmon peak is not due to the disappearance of the free carriers: there still has to be a Drude contribution at highest pressures, since the reflectivity has clear Hagen-Rubens upturns at low energies. Instead, the conductivity increases above GPa and this sudden increase in the conductivity produces very strong damping. The plasmon thus becomes overdamped by background conductivity and appears washed out. High pressure pushes the interband transitions close to zero energy, and above GPa they become strongly mixed with the tail of the Drude peak.
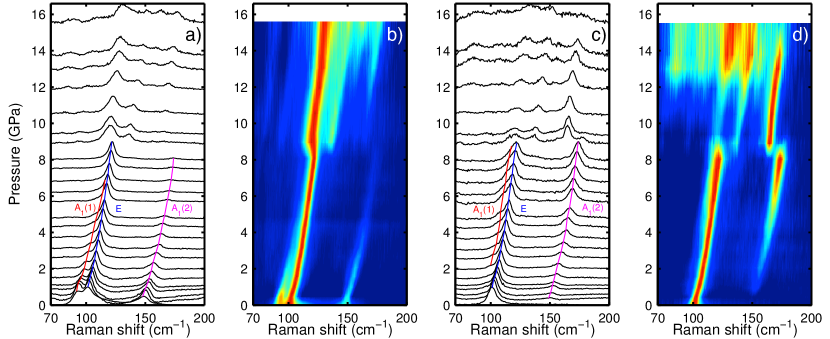
To gain better understanding of the transition at GPa, we measured the pressure effects on the optical phonons using polarized Raman spectroscopy from to GPa, shown in Fig. 3. The symmetry analysis gives four zone-center vibrational modes, with the irreducible vibrational representation . All of them are both Raman and infrared active because of the lack of inversion symmetry. At ambient pressure, parallel polarization shows , and cm-1, while crossed polarization shows cm-1, in agreement with the previous studies Sklyadneva et al. (2012); Gnezdilov et al. . Around 2 GPa both modes diminish in the parallel polarization and at the same time appear in the crossed polarization. While this may be related to a gradual change in the crystal lattice, there is no theoretical argument why a topological phase transition would have this effect on the Raman spectra. Besides the expected blueshift of the Raman modes under pressure, an important effect is observed above GPa: three modes are visible up to GPa, above which the spectrum changes abruptly and several weak peaks appear. The appearance of new vibrational lattice modes points to a change of crystal structure at the pressure where also the change in optical conductivity takes place.
Bahramy et al. predicted that pressure causes reduction of the band gap of the topologically trivial BiTeI Bahramy et al. (2012). As pressure reaches its critical value the gap closes developing a Weyl semimetal phase, and its further increase reopens the gap resulting in a topological insulator phase characterized by a band-inversion feature. The first-principles calculations performed at the DFT-GGA level of theory estimate the critical pressure to be in the range GPa Bahramy et al. (2012). However, it was shown recently that the inclusion of many-body quasiparticle corrections calculated within the GW approximation results in a significant increase of the band gap of BiTeI bringing it in close agreement with the experimental value eV Rusinov et al. (2013). Such an increase of the electronic band gap in the topologically trivial regime would effectively result in a positive shift of Yazyev et al. (2012). Our GW calculations estimate GPa 333See Supplemental Material for the description of DFT and GW first-principles calculations, i.e. the structural phase transition takes place before the predicted topological phase transition and precludes its observation.
The appearance of several additional Raman active modes above the critical pressure is unambiguous evidence for a change of crystal structure, in agreement with the XRD data Xi et al. (2013). Yet the optical conductivity in Fig. 2 progresses gradually through this phase transition as a function of pressure, and has a kink at GPa for all infrared photon energies. Therefore we postulate that the high pressure phase is structurally close to the one at ambient pressure (space group with atoms per unit cell), and differs mainly by the stacking of BiTeI layers. A good candidate is the space group with atoms per unit cell, which is the structure of the chemically-related compound BiTeCl at ambient pressure Shevelkov et al. (1995). Our ab initio calculations imposing the latter crystal structure for pressurized BiTeI ††footnotemark: , show that in this phase the gap also decreases gradually as a function of pressure, and evolves toward a topologically trivial semi-metallic state characterized by a negative gap. This hypothesis about the structure is also consistent with the observation that the main Raman lines are only slightly shifted above GPa and several other weak lines appear. Another candidate which was recently suggested for the higher pressure phase is the space group structure with 4 formula units per unit cell Chen et al. (2013).
To summarize, we have determined the pressure dependence of the optical properties and Raman vibrational modes of BiTeI, under pressures up to GPa. The reflectivity and transmission show dramatic changes under pressure. The band gap monotonically decreases as a function of increasing pressure and the optical conductivity increases. At GPa this process is accelerated. As a result, the interband plasmon becomes overdamped above GPa. The transmission data demonstrate clear evidence of a phase transition at GPa, corroborated by the pressure-dependent Raman spectra indicating a sudden change to a different crystal structure at this pressure. This structural transition possibly prevents the predicted topological high-pressure phase in BiTeI from occurring.
We thank B. Andrei Bernevig for illuminating discussions. We are grateful to Florence Lévy-Bertrand, Riccardo Tediosi and Mehdi Brandt for technical assistance. Research was supported by the Swiss NSF through Grants Nos. 200020-135085 and NCCR MaNEP. A.A. acknowledges funding from “Boursières d’Excellence” of the University of Geneva. First-principles computations have been performed at the Swiss National Supercomputing Centre (CSCS) under project s443. G.A. and O.V.Y. were supported by the Swiss National Science Foundation (grant No. PP00P2_133552) and by the ERC Starting Grant “TopoMat” (grant No. 306504).
References
- Ishizaka et al. (2011) K. Ishizaka, M. S. Bahramy, H. Murakawa, M. Sakano, T. Shimojima, T. Sonobe, K. Koizumi, S. Shin, H. Miyahara, A. Kimura, K. Miyamoto, T. Okuda, H. Namatame, M. Taniguchi, R. Arita, N. Nagaosa, K. Kobayashi, Y. Murakami, R. Kumai, Y. Kaneko, Y. Onose, and Y. Tokura, Nature Materials 10, 521 (2011).
- Crepaldi et al. (2012) A. Crepaldi, L. Moreschini, G. Autès, C. Tournier-Colletta, S. Moser, N. Virk, H. Berger, P. Bugnon, Y. J. Chang, K. Kern, A. Bostwick, E. Rotenberg, O. V. Yazyev, and M. Grioni, Physical Review Letters 109, 096803 (2012).
- Landolt et al. (2012) G. Landolt, S. V. Eremeev, Y. M. Koroteev, B. Slomski, S. Muff, T. Neupert, M. Kobayashi, V. N. Strocov, T. Schmitt, Z. S. Aliev, M. B. Babanly, I. R. Amiraslanov, E. V. Chulkov, J. Osterwalder, and J. H. Dil, Physical Review Letters 109, 116403 (2012).
- Xia et al. (2009) Y. Xia, D. Qian, D. Hsieh, L. Wray, A. Pal, H. Lin, A. Bansil, D. Grauer, Y. S. Hor, R. J. Cava, and M. Z. Hasan, Nature Phys. 5, 398 (2009).
- Zhang et al. (2009) H. Zhang, C.-X. Liu, X.-L. Qi, X. Dai, Z. Fang, and S.-C. Zhang, Nature Phys. 5, 438 (2009).
- Bahramy et al. (2012) M. S. Bahramy, B.-J. Yang, R. Arita, and N. Nagaosa, Nature Communications 3, 679 (2012).
- Xu et al. (2011) S.-Y. Xu, Y. Xia, L. A. Wray, S. Jia, F. Meier, J. H. Dil, J. Osterwalder, B. Slomski, A. Bansil, H. Lin, R. J. Cava, and M. Z. Hasan, Science 332, 560 (2011).
- Sato et al. (2011) T. Sato, K. Segawa, K. Kosaka, S. Souma, K. Nakayama, K. Eto, T. Minami, Y. Ando, and T. Takahashi, Nature Phys. 7, 840 (2011).
- Brahlek et al. (2012) M. Brahlek, N. Bansal, N. Koirala, S.-Y. Xu, M. Neupane, C. Liu, M. Z. Hasan, and S. Oh, Phys. Rev. Lett. 109, 186403 (2012).
- Akrap et al. (2012) A. Akrap, M. Tran, A. Ubaldini, J. Teyssier, E. Giannini, D. van der Marel, P. Lerch, and C. C. Homes, Physical Review B 86, 235207 (2012).
- Lerch et al. (2012) P. Lerch, L. Quaroni, J. Wambach, J. Schneider, D. Armstrong, D. Rossetti, F. Mueller, P. Peier, V. Schlott, L. Carroll, P. Friedli, H. Sigg, S. Stutz, and M. Tran, Journal of Physics: Conference Series 359, 012003 (2012).
- Kuzmenko (2005) A. Kuzmenko, Review of Scientific Instruments 76, 083108 (2005).
- Lee et al. (2011) J. S. Lee, G. A. H. Schober, M. S. Bahramy, H. Murakawa, Y. Onose, R. Arita, N. Nagaosa, and Y. Tokura, Physical Review Letters 107, 117401 (2011).
- Martin et al. (2012) C. Martin, K. H. Miller, S. Buvaev, H. Berger, X. S. Xu, A. F. Hebard, and D. B. Tanner, arXiv:1209.1656 (2012).
- Demkó et al. (2012) L. Demkó, G. A. H. Schober, V. Kocsis, M. S. Bahramy, H. Murakawa, J. S. Lee, I. Kézsmárki, R. Arita, N. Nagaosa, and Y. Tokura, Physical Review Letters 109, 167401 (2012).
- Note (1) The Fabry-Perot oscillations present in the reflectivity in the lower pressure range give artifact oscillations in the dielectric function and the related quantities; these oscillations are therefore filtered out.
- Note (2) See also Fig. 4 of the supplemental material.
- Xi et al. (2013) X. Xi, C. Ma, Z. Liu, Z. Chen, W. Ku, H. Berger, C. Martin, D. B. Tanner, and G. L. Carr, Phys. Rev. Lett. 111, 155701 (2013).
- Sklyadneva et al. (2012) I. Y. Sklyadneva, R. Heid, K. P. Bohnen, V. Chis, V. A. Volodin, K. A. Kokh, O. E. Tereshchenko, P. M. Echenique, and E. V. Chulkov, Physical Review B 86, 094302 (2012).
- (20) V. Gnezdilov, D. Wulferding, P. Lemmens, A. Möller, P. Recher, H. Berger, R. Sankar, and F. C. Chou, arXiv:1303.4333 .
- Rusinov et al. (2013) I. P. Rusinov, I. A. Nechaev, S. V. Eremeev, C. Friedrich, S. Blügel, and E. V. Chulkov, Phys. Rev. B 87, 205103 (2013).
- Yazyev et al. (2012) O. V. Yazyev, E. Kioupakis, J. E. Moore, and S. G. Louie, Phys. Rev. B 85, 161101 (2012).
- Note (3) See Supplemental Material for the description of DFT and GW first-principles calculations.
- Shevelkov et al. (1995) A. Shevelkov, E. Dikarev, R. Shpanchenko, and B. Popovkin, Journal of Solid State Chemistry 114, 379 (1995).
- Chen et al. (2013) Y. Chen, X. Xi, W.-L. Yim, F. Peng, Y. Wang, H. Wang, Y. Ma, G. Liu, C. Sun, C. Ma, Z. Chen, and H. Berger, The Journal of Physical Chemistry C 117, 25677 (2013).