Direct photon production and interferometry in =200 GeV Au+Au and in =2.76 TeV Pb+Pb collisions
Abstract
Direct photon production, in =200 GeV Au+Au and in =2.76 TeV Pb+Pb collisions, are studied in a hydrodynamic model. Ideal hydrodynamic model, initialised to reproduce experimentally charged particle spectra in RHIC and LHC energy, also reproduces the PHENIX and ALICE measurements for the direct photon spectra in Au+Au collisions at RHIC and Pb+Pb collisions at LHC. The model however produces less elliptic flow than in experiment. Discrepancy between experiment and hydrodynamic simulation is comparatively less in Pb+Pb collisions at LHC than in Au+Au collisions at RHIC. We also studied direct photon correlation and determined the HBT radii. In 0-10%-50-60% collisions, HBT radii in Au+Au or in Pb+Pb collisions do not show large centrality dependence. Energy dependence of the HBT radii for direct photons is also not large.
pacs:
PACS numbers(s):25.75.-q,12.38.MhI Introduction
Recent experiments in =200 GeV Au+Au collisions at Relativistic Heavy Ion Collider (RHIC) BRAHMSwhitepaper PHOBOSwhitepaper PHENIXwhitepaper STARwhitepaper and =2.76 TeV Pb+Pb collisions at Large Hadron Collider (LHC) Aamodt:2010pb Collaboration:2010cz Aamodt:2010jd Aamodt:2010pa :2011vk , produced convincing evidences that in Au+Au collisions at RHIC and in Pb+Pb collisions at LHC, a deconfined medium or Quark-Gluon Plasma (QGP) is produced. Strong elliptic flow in non-central collisions is the key evidence to this understanding. Hydrodynamical analysis of experimental charged particles data , also suggests that in Au+Au and in Pb+Pb collisions, a collective medium, with viscosity to entropy ratio close to the AdS/CFT lower bound of viscosity, is produced QGP3 Chaudhuri:2009uk Chaudhuri:2008ed Roy:2011xt Chaudhuri:2011hv .
Direct photons probe the early medium produced in a collision better than the charged hadrons. Hadrons, being strongly interacting, are emitted from the surface of the thermalised matter and carry information about the freeze-out surface only. They are unaware of the condition of the interior of the matter and can provide information about the deep interior only in an indirect way. In a hydrodynamic model, one fixes the initial conditions of the fluid such that the ”experimental” freeze-out surface is correctly reproduced. In contrast to hadrons, photons, being weakly interacting, are emitted from whole volume of the matter. Throughout the evolution of the matter, photons are emitted. Conditions of the produced matter, at its deep interior, are better probed by the photons. Depending on the transverse momentum, direct photons can probe different aspects of heavy ion collisions. A thermalised medium of quarks and gluons, or of hadrons, can produce significant number of thermal photons. They are low photons ( GeV/c). Low photons can test whether or not, QGP is produced in the collisions. Hard photons ( 6 GeV/c) are of pQCD origin and test the pQCD models. Fast partons from ’jet’ can interact with thermal partons of QGP and produce photons. At intermediate range, ( 6 GeV/c), interaction jets with QGP could be an important source of direct photons Fries:2002kt Gale:2005zd .
Recently, ALICE collaboration measured direct photon production in 2.76 TeV Pb+Pb collision at LHC. Lohner:2012ct . spectra as well as elliptic flow in 0-40% collision was measured. Inverse slope parameter of an exponential fit to the low part of the spectra give a temperature MeV. Previously, PHENIX collaboration measured direct photon spectra and elliptic flow in =200 GeV Au+Au collisions Afanasiev:2012dg Adare:2011zr Miki:2008zz Adler:2005ig . In 0-20% Au+Au collisions, inverse slope parameter is only MeV, considerably lower than the slope parameter at LHC energy. In ideal hydrodynamic models, photon production in Au+Au collisions at RHIC energy has been studied extensively Fries:2002kt Alam:2007dv Chatterjee:2005de Gale:2008wf Liu:2009kta Liu:2009kq Liu:2010rd Helenius:2013bya vanHees:2011vb Holopainen:2011pd . Recently, it was shown that direct photon production in =2.76 TeV Pb+Pb collisions is also reproduced in a hydrodynamic model Nayak:2012dj . In the present paper, in ideal hydrodynamic model, we have analysed the direct photon spectra and elliptic flow in Pb+Pb collisions at LHC as well as in Au+Au collisions at RHIC. In some earlier publications Chaudhuri:2009uk Chaudhuri:2008ed Roy:2011xt Chaudhuri:2011hv , in hydrodynamical model, we have analysed the charged particles spectra and elliptic flow in =200 GeV Au+Au and in =2.76 TeV Pb+Pb collisions. To analyse the direct photon spectra in Au+Au and in Pb+Pb collisions, we initialise the fluid with similar initial conditions. It may be mentioned here that, though ideal hydrodynamic model explains a large part of the experimental data on charged particles, the best description to the data is obtained in dissipative hydrodynamics, with viscosity over entropy ratio close to the AdS/CFT conjectured value Policastro:2001yc Kovtun:2003wp , .
In the following, results of our simulations for direct photons in ideal hydrodynamic model will be discussed in details. Briefly, both in =200 GeV Au+Au collisions and in =2.76 TeV Pb+Pb collisions, ideal hydrodynamical model simulations for direct photons, well reproduces the experimentally measured spectra. The elliptic flow data are however, underpredicted, more in Au+Au collisions than in Pb+Pb collisions. We have also simulated HBT correlation for two photons and extracted HBT radii, as a function of centrality. Even though, from RHIC to LHC, collision energy increases by a factor of 14, HBT radii for direct photons do not show large energy dependence. HBT radii for direct photons also do not show large centrality dependence.
II Hydrodynamical model for direct photon production
In a hydrodynamical model, the invariant distribution of direct photons is obtained by convoluting the photon production rate with space-time evolution of the fluid. Invariant distribution of direct photons can be obtained as,
| (1) |
where is the direct photon production rate and is the elementary fluid volume.
Several authors have studied photon emission rate hot hadronic gas Kapusta:1991qp Nadeau:1992cn Turbide:2003si . In the following we use the parametrised form given in Turbide:2003si . Following processes are included,
(a) , (b) , (c) , (d) , (e) , (f) , (g) ,
Direct photon emission rate from QGP is also well studied Kapusta:1991qp Aurenche:1998nw Aurenche:1999tq Aurenche:2000gf Arnold:2001ms . In Arnold:2001ms , photon emission rates from QGP are calculated in the leding order. We use the parametrised form given there.
As it was mentioned earlier, invariant photon yield is obtained by convoluting the elementary production rates over space-time evolution. Assuming that in Au+Au collisions at RHIC or in Pb+Pb collisions at LHC, a baryon free QGP fluid is produced, the space-time evolution of the fluid is obtained by solving the energy-momentum conservation equation,
| (2) | |||||
| (3) |
, and in Eq.3 are the energy density, pressure and fluid velocity respectively. Assuming boost-invariance, Eqs.2 are solved in coordinates, with the code ”‘AZHYDRO-KOLKATA”’, developed at the Cyclotron Centre, Kolkata. Details of the code can be found in Chaudhuri:2008sj .
| System | () | T(MeV) | |
|---|---|---|---|
| Au+Au | 200 | 30.0 | 370 |
| Pb+Pb | 2760 | 125 | 530 |
Hydrodynamic equations (Eqs.2) are closed with an equation of state . Currently, there is consensus that the confinement-deconfinement transition is a cross over. The cross over or the pseudo critical temperature for the quark-hadron transition is 170 MeV Aoki:2006we ; Aoki:2009sc ; Borsanyi:2010cj ; Fodor:2010zz . In the present study, we use an equation of state where the Wuppertal-Budapest Aoki:2006we ; Borsanyi:2010cj lattice simulations for the deconfined phase is smoothly joined at MeV, with hadronic resonance gas EoS comprising of all the resonances below mass =2.5 GeV. Details of the EoS can be found in Roy:2011xt .
Solution of partial differential equations (Eqs.2,3) requires initial conditions, e.g. transverse profile of the energy density (), fluid velocity () at the initial time . A freeze-out temperature is also needed. Charged particles production in =200 GeV Au+Au and in 2.76 TeV Pb+Pb collisions have been analysed in hydrodynamic models Chaudhuri:2009uk Chaudhuri:2008ed Roy:2011xt Chaudhuri:2011hv . Transverse energy density profile can be obtained in a Glauber model. At impact parameter , the initial energy density is distributed as,
| (4) |
and in Eq.5 are the transverse profile of the average number of participants and average number of binary collisions respectively. They are calculated in the Glauber model. is the hard scattering fraction. We assume that in =2.76 TeV Pb+Pb collisions are dominated by hard scattering and Roy:2011xt Chaudhuri:2011hv . In =200 GeV Au+Au collisions, hard scattering fraction is assumed to be 25% Chaudhuri:2009uk Chaudhuri:2008ed .
With the central energy density and temperature of the fluid, listed in table.1, several experimental data, e.g. centrality dependence of charged particles multiplicity, spectra, elliptic flow etc. in Au+Au collisions at RHIC and Pb+Pb collisions at LHC are reasonably well explained. For simulating photon production, we then use the parameters listed in table.1. Initial transverse fluid velocity is assumed zero. The freeze-out temperature is assumed to be =110 MeV.
III Direct photons in =200 GeV Au+Au and =2.76 TeV Pb+Pb collisions
III.1 Transverse momentum spectra
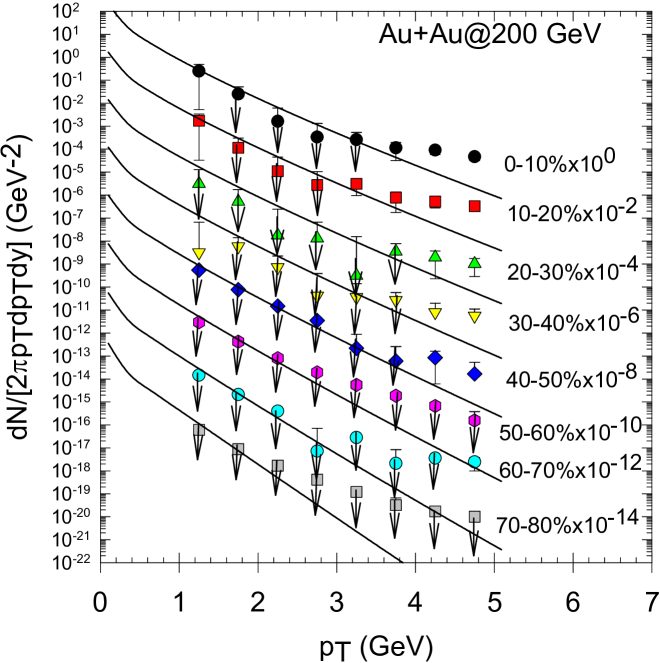
PHENIX collaboration studied direct photon production in =200 GeV Au+Au collisions Afanasiev:2012dg . PHENIX measurements for the transverse momentum distribution of direct photons in 0-10%-70-80% collision centralities are shown in Fig.1. The solid lines in Fig.1 are hydrodynamical model simulations. Ideal hydrodynamic model reproduces the spectra reasonably well. In central and mid-central collisions (0-10%-40-50%), experimental data upto 3 GeV are reproduced. Data are however underpredicted at larger . It is understood. As it was discussed earlier, at larger photons, apart from the thermal photons, there are other sources, e.g. pQCD photons, jet photon etc. In more peripheral collisions, ideal hydrodynamic simulation reproduces experimental data in much more limited range. The result is not unexpected. In peripheral collisions, experimental data possibly demand dissipative effects like shear viscosity, and ideal hydrodynamic model fails to reproduce experimental charged particles spectra. Also, in peripheral collisions non-thermal photon production becomes more important and spectra with only thermal production then deviate from the data.
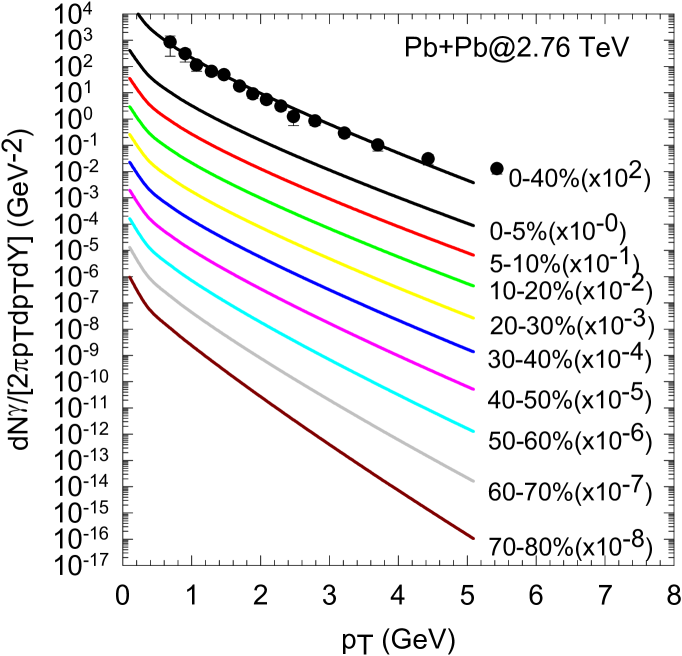
Recently ALICE collaboration published their measurements of direct photon Lohner:2012ct . Transverse a momentum spectrum of direct photons in 0-40% Pb+Pb collisions is shown in Fig.2. 0-40% collisions approximately corresponds to impact parameter b=8.9 fm Pb+Pb collisions. The solid line in Fig.2 is the hydrodynamic simulation for photon spectra in b=6.9 fm Pb+Pb collisions. Direct photon yield upto =4 GeV are correctly reproduced. Good description of direct photon production in =200 GeV Au+Au and =2.76 TeV Pb+Pb collisions gave us confidence to predict for the photon yield as a function of collision centrality. In Fig.2, hydrodynamic predictions for direct photons in 0-10%-70-80% in =2.76 TeV Pb+Pb collisions are shown. Considering that in peripheral Au+Au collisions, hydrodynamic predictions underestimate photon production at large , the predictions given here may also underestimate photon production at 3 GeV. As expected, in more peripheral collisions, inverse slope of the spectra decreases, indicating less fluid temperature. In several experiments, slope of the direct photon spectra is used to estimate the fluid temperature. In table.2, the inverse slope of the simulated spectra in the range 1-2 GeV, in =200 GeV Au+Au and in =2.76 TeV Pb+Pb collisions, are listed as a function of collision centralities. Compared to 200 GeV Au+Au collisions, inverse slope is always greater in 2.76 TeV Pb+Pb collisions. For comparison, in table.2, I have listed the initial central fluid temperature . Central fluid temperature is much larger than the inverse slope parameter. It is expected also, temperature obtained from spectra are in a sense averaged over evolution period and is smaller than the initial central temperature. Thus fluid can be produced at much higher temperature than estimated from the photon spectra.
| Au+Au@200GeV | Pb+Pb@2.76TeV | |||
| centrality | Inv.slope | Inv.slope | ||
| (MeV) | (MeV) | (MeV) | (MeV) | |
| 0-10 | 219 | 368 | 260 | 523 |
| 10-20 | 217 | 354 | 258 | 505 |
| 20-30 | 214 | 338 | 254 | 484 |
| 30-40 | 210 | 320 | 249 | 458 |
| 40-50 | 206 | 296 | 240 | 424 |
| 50-60 | 198 | 267 | 228 | 383 |
| 60-70 | 191 | 236 | 215 | 333 |
| 70-80 | 185 | 203 | 202 | 281 |
III.2 Elliptic flow
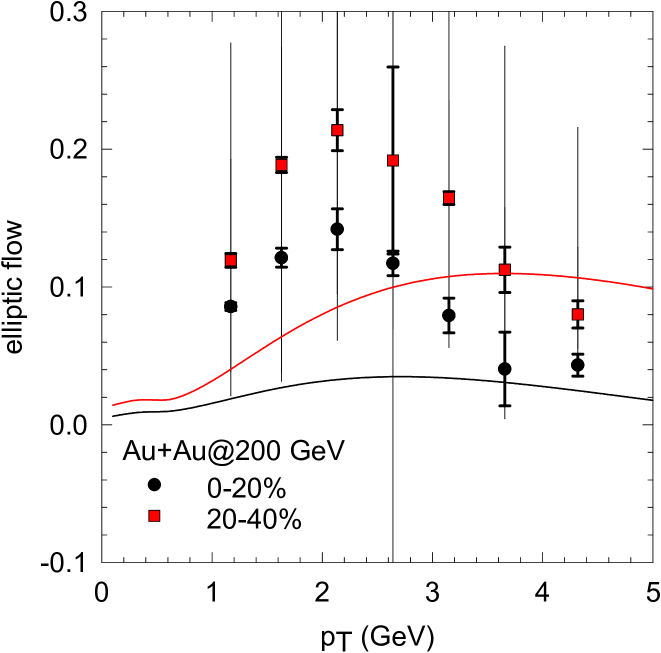
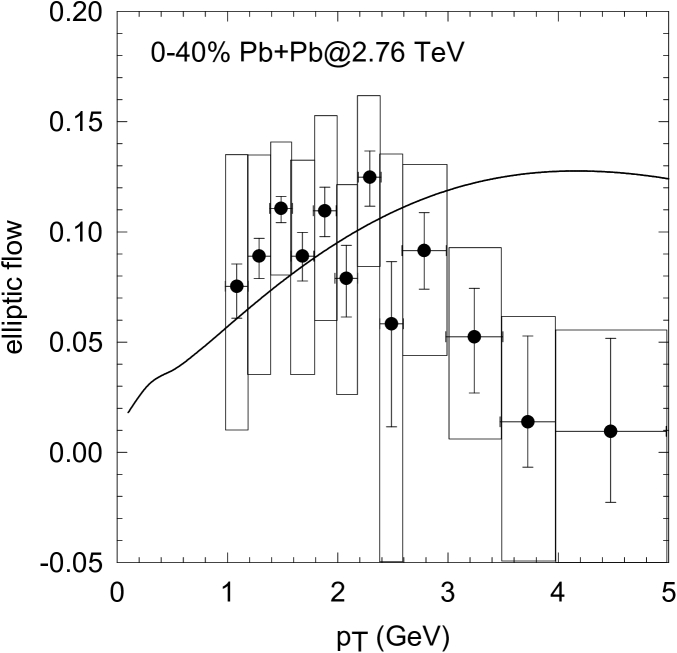
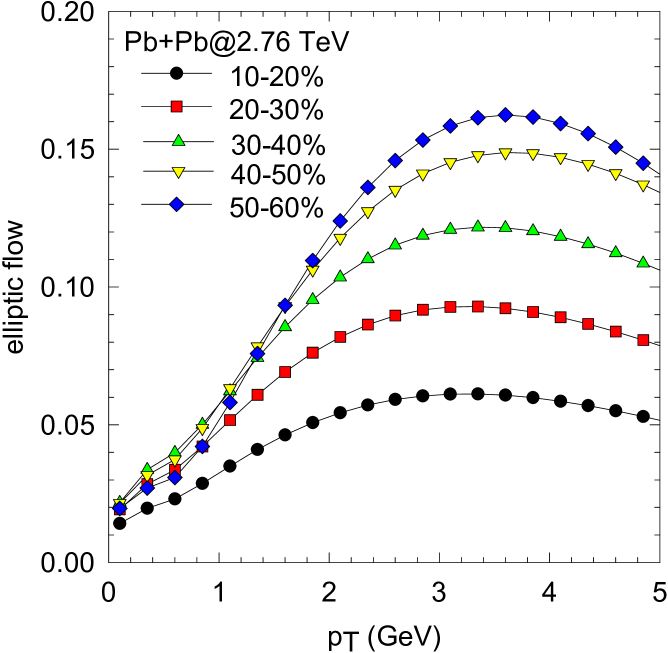
Elliptic flow is one of the most important observables in RHIC and LHC energy collisions. Since photons are continuously emitted from the fireball, elliptic flows of photon are more powerful than that of hadrons, which are emitted only from the freeze-out surface. PHENIX measurements Adare:2011zr for elliptic flow in 0-20% and 20-40% Au+Au collisions are shown in Fig.3. At low , increases, reaching a maxima around , decreases thereafter. The solid lines in Fig.3 are the hydrodynamic model simulations. In Au+Au collisions, hydrodynamic model largely underpredict the data. The results are not unexpected. In an earlier simulation Chatterjee:2005de , direct photon elliptic flow was simulated in Au+Au collisions. It was shown that even in very peripheral collision, hydrodynamical evolution generate very little flow. Recently, ALICE collaboration Aamodt:2010pa published direct photon elliptic flow in 0-40% Pb+Pb collisions at =2.76 TeV. The measurements are shown in Fig.4. Experimental data has large error bars, still, qualitative behavior of direct photon elliptic flow in Pb+Pb collisions at LHC is similar to that in Au+Au collisions at RHIC. At low increase, reaching a maxima around and then decreases at higher . In Fig.4, hydrodynamic model simulation for is shown as the solid line. At low , hydrodynamic simulation marginally underestimate the experimental flow. Discrepancy between hydrodynamic model simulations and experimental elliptic flow is considerably less than that in Au+Au collisions at RHIC. At high however, model predict more flow than in experiment. In Fig.5, hydrodynamic model simulations for direct photon flow in 10-20%, 20-30%, 30-40%, 40-50% and 50-60% Pb+Pb collisions at LHC are shown. They are shown here as a reference only. We expect that at low , 2 GeV, experimentally measured flows will be close to the simulated flows.
IV Photon interfereometry
Hanbury-Brown-Twiss (HBT) interferometry is widely used in the analysis of heavy ion collision data to estimate the size of the particle emitting source. Spin averaged intensity correlation between two photons of momenta and , from a chaotic source can be expressed as Wiedemann:1999qn Frodermann:2009nx Srivastava:1993pt Alam:2003gx ,
| (5) | |||||
where is the relative momentum and is the average momentum. The emission function is the probability of emitting a photon from the source point with momentum . It is generally approximated by the rate of production of photon. The last equation is obtained with the ’smoothing approximation’ that the emission function varies slowly over the momentum range where the correlator deviates from unity, .
The correlation function is generally decomposed in terms of the outward, sideward, and longitudinal momentum differences; , and respectively. One can write the four-momentum of the i-th photon in-terms of transverse momentum , rapidity y, and azimuthal angle as,
| (6) |
The three momentum differences are,
| (7) | |||||
| (8) | |||||
| (9) | |||||
The main characteristic of the correlation function is the q-range over which it decays to 1. The corresponding half-widths of the correlator are called HBT radius parameters or HBT radii. In the absence of final state interactions, HBT radii are generally extracted by approximating the correlation function by a Gaussian source,
where, , and are respectively called, outward radius, sideward radius and longitudinal radius. We would like to note here that the HBT radii , or , do not give directly the size of the emission region, rather they corresponds to the homogeneous region from which it is most likely that photon pair with momentum is emitted Wiedemann:1999qn . It is generally a small fraction of the total fireball size. Furthermore, HBT radii only measure certain combination of spatial and temporal width. Within some model approximations, and measure the emission size and duration of particle emission, measures the transverse size Wiedemann:1999qn . The ratio then indicate the duration of the particle emission.
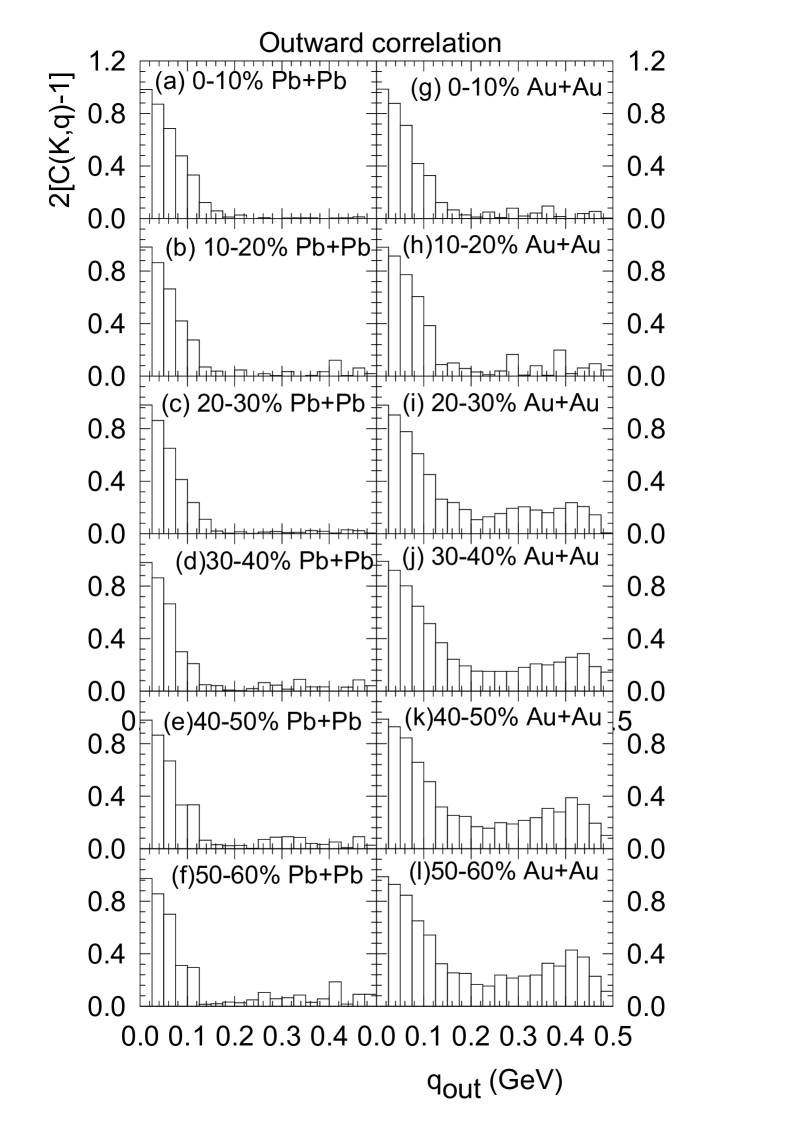
We have solved hydrodynamic equations with the assumption of boost-invariance. In a model with boost-invariance, one can not comment on the longitudinal correlation. In the following, we concentrate on the outward and sideward correlations only. We use a Monte-Carlo sampling programme to obtain the outward, and sideward correlation functions from Eq.5, for the direct photons in the transverse momentum range GeV. In the left panels (a)-(f) of Fig.6, hydrodynamic simulation for the outward correlation, for direct photons in 0-10%, 10-20%, 20-30%, 30-40%, 40-50% and 50-60% =2.76 TeV Pb+Pb collisions are shown. The same in =200 GeV Au+Au collisions are shown in the right panels (g)-(l). The outward correlation functions were obtained for, ,, and imposing the condition , with , such that . In =2.76 TeV Pb+Pb collisions, the correlation functions approximately corresponds to Gaussian shape. Only in peripheral collisions and at large momentum transfer , the correlation function depart from the Gaussian shape, even then, the departure is small. In Au+Au collisions however, even in central and mid-central collisions, the correlation function deviate from the Gaussian shape. Width of the outward correlation function in =200 GeV Au+Au collisions is also more than that in =2.76 TeV Pb+Pb collisions.
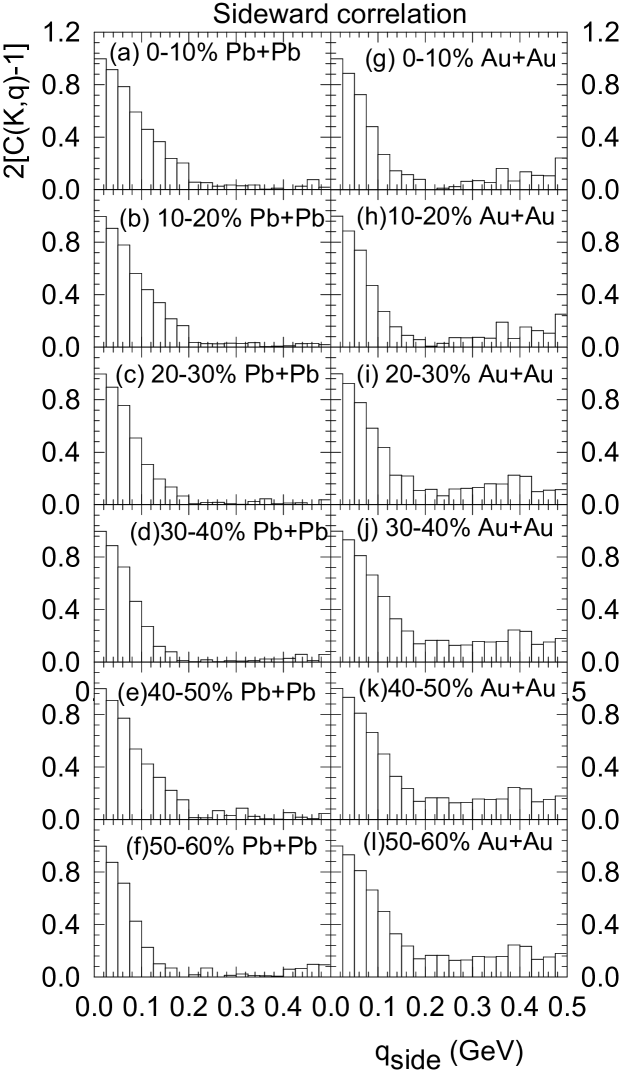
In Fig.7, simulation results obtained for the sideward correlation functions are shown. Sideward correlation is obtained for, , and imposing the condition that , , such that is identically zero. As it was for outward correlation, sideward correlation functions also depart more from the Gaussian shape in =200 GeV Au+Au collisions than in =2.76 TeV Pb+Pb collisions.
From the correlation functions, we have also calculated the HBT radii, and . Noting that the correlation functions depart from the Gaussian shape, we have defined the half width of the correlation function as the HBT radii, , , where is determined from the condition, and similarly for . Centrality dependence of HBT radii for direct photon emission is shown in Fig.8. The top panel shows the outward radius in 0-10%-50-60% Au+Au and Pb+Pb collisions. Outward radius , both in Pb+Pb collisions at LHC and in Au+Au collisions at RHIC, do not show significant centrality dependence. The behavior is unlike that observed for the charged particles. HBT radii for the charged particles has been measured in =200 GeV Au+Au collisions Adams:2004yc Adler:2004rq . for the charged particles shows significant centrality dependence, decreasing rapidly in peripheral collisions. for photons however do show some energy dependence. With the exception of very central 0-10% collisions is increased by 30-50% from RHIC to LHC energy. The result is not unexpected. measures emission size and duration of emission time. Emission time and duration supposed to be increased in LHC energy collision. However, we do note that while from RHIC to LHC, energy is increased by a factor of 14, in 10-20%-50-60% collisions is increased by 30-50% only. Energy dependence is not large.
Centrality dependence of HBT sideward radius in =2.76 TeV Pb+Pb collisions and in =200 GeV Au+Au collisions are shown in the middle panel of Fig.8. In 0-10% -50-60% collision, also do not show significant centrality dependence. Here again, the behavior is unlike that observed for the charged particles, where rapidly decreases in peripheral collisions. is a measure of transverse size of the emission zone, and is expected to be more in Pb+Pb collisions at LHC than in Au+Au collisions at RHIC (transverse expansion is more in Pb+Pb collisions than in Au+Au collisions). However, in the simulations, in 0-10% and 10-20% collisions is more in Au+Au collisions than in Pb+Pb collisions. In more peripheral collisions however, as expected, is more in Pb+Pb collisions. Why in central 0-10% and 10-20% collisions, direct photons are emitted from reduced sized fireball is not understood.
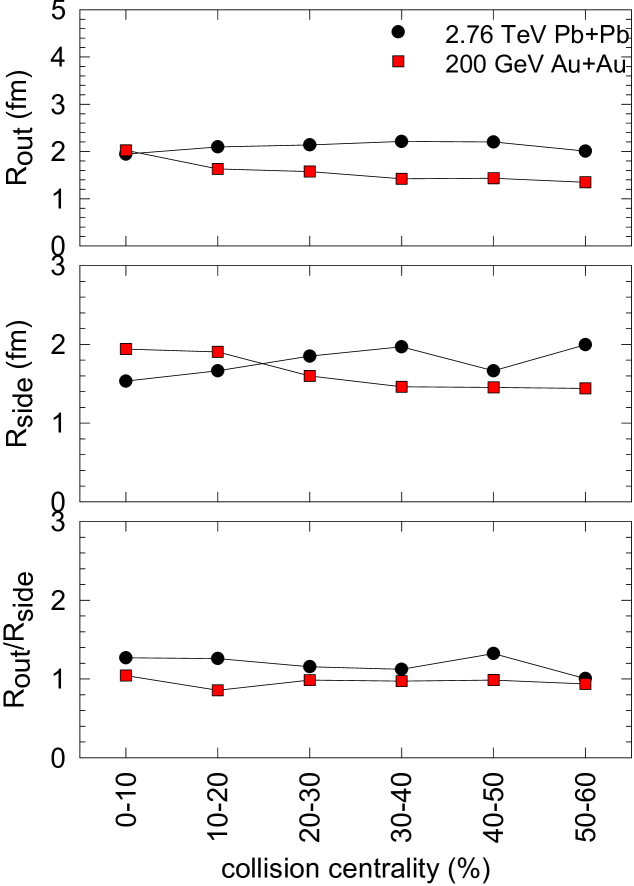
It is mentioned earlier that within some model assumptions, the ratio is a measure of the particle emission duration. The centrality dependence of the ratio in Pb+Pb collisions at LHC and in Au+Au collisions at RHIC is shown in the bottom panel of Fig.8. The ratio is increased in Pb+Pb collisions at LHC. It appears that emission time for direct photons is increased in Pb+Pb collisions at LHC from that in Au+Au collisions at RHIC. However, the increase is not large, less than 50%. One also notes that the while in Pb+Pb collisions, the ratio is marginally larger than unity, in Au+Au collisions, it is close to unity.
a
The above HBT calculations are limited to photon momentum . Direct photon correlation and HBT radii do depend on the photon momentum. The dependence is studied in Fig.LABEL:F9, where simulation results for direct photon correlations, for =0.5, 1.0, 1.5 and 2.0 GeV in 0-10% Au+Au collisions at RHIC are shown. Both outside correlation show strong dependence on , and side correlations, for =0.5, 1.0, 1.5 and 2.0 GeV are stuid
V Summary
To summarise, in ideal hydrodynamic model, we have simulated direct photon production in =200 GeV Au+Au and in =2.76 TeV Pb+Pb collisions. Ideal hydrodynamic model simulations for direct photons reasonably well explain the PHENIX data on experimental photon spectra in 0-10%-40-50% Au+Au collisions, upto 3 GeV. At higher model produces less photons than in experiment. In more peripheral collisions, experimental data are explained only upto =2 GeV. Ideal hydrodynamic model however produces less elliptic flow in Au+Au collisions than in experiment. Ideal hydrodynamic model simulations also explain the ALICE measurements for the direct photon spectra in 0-40% =2.76 TeV Pb+Pb collisions. In Pb+Pb collisions also the ideal hydrodynamic simulations produces less flow than in experiment at low , GeV. However, the discrepancy between model simulations and experiment is much less than that in Au+Au collisions at RHIC. In higher , model produces more flow than in experiment.
We have also simulated for HBT correlations for direct photons, in Au+Au collisions at RHIC and Pb+Pb collisions at LHC. The correlation function was computed only for photons in the range 0-1 GeV. Outward and sideward radii, and was also extracted. Both in Au+Au and in Pb+Pb collision, in 0-10% - 50-60% collisions, and , for direct photons, do not show appreciable centrality dependence. The result is at variance with the centrality dependence of HBT radii for charged particles, where HBT radii decrease rapidly in peripheral collisions. Outward and sideward radius and for direct photons shows marginal energy dependence. From RHIC to LHC, while the collision energy is increased by a factor of 14, , depending on the collision centrality, increases by 30-50%. In central 0-10% and 10-20% collisions, decreases by 10-20% as the collision energy is increased, and in peripheral 20-30%-50-60% collisions, is increased by 30-40%. The ratio , which is considered as a measure of the emission time is increased by 10-45% from RHIC to LHC. Photons are emitted for longer duration in Pb+Pb collisions.
In the present simulations, dissipative effects like shear viscosity are neglected. However, from string theory motivated calculation Policastro:2001yc Kovtun:2003wp , one understands that shear viscosity over entropy ratio has a lower bound, . Charged particle production in Au+Au collisions at RHIC and in Pb+Pb collisions at LHC is consistent with small viscous fluid evolution. Viscous effect on photons production was studied in Dusling:2009bc Chaudhuri:2011up Dion:2011pp . As it is for the charged particles, viscosity enhances production and decrease the elliptic flow. As it is shown here, even in ideal hydrodynamic evolution, elliptic flow for photons is less than that in experiments. Agreement between experiment and simulations will further deteriorate if viscous effects are included. Indeed, it is mystery that for direct photons, ideal hydrodynamic simulations produced much less elliptic flow than in experiments. Evidently, further investigations are required to understand photon production in relativistic heavy ion collisions.
References
- (1) BRAHMS Collaboration, I. Arsene et al., Nucl. Phys. A 757, 1 (2005).
- (2) PHOBOS Collaboration, B. B. Back et al., Nucl. Phys. A 757, 28 (2005).
- (3) PHENIX Collaboration, K. Adcox et al., Nucl. Phys. A 757 184 (2005).
- (4) STAR Collaboration, J. Adams et al., Nucl. Phys. A 757 102 (2005).
- (5) K. Aamodt et al. [The ALICE Collaboration], Phys. Rev. Lett. 105, 252301 (2010)
- (6) A. Collaboration, Phys. Rev. Lett. 106, 032301 (2011)
- (7) K. Aamodt et al. [ALICE Collaboration], Phys. Lett. B 696, 30 (2011)
- (8) K. Aamodt et al. [The ALICE Collaboration], Phys. Rev. Lett. 105, 252302 (2010)
- (9) [ ALICE Collaboration ], Phys. Rev. Lett. 107, 032301 (2011).
- (10) P. F. Kolb and U. Heinz, in Quark-Gluon Plasma 3, edited by R. C. Hwa and X.-N. Wang (World Scientific, Singapore, 2004), p. 634.
- (11) A. K. Chaudhuri, Phys. Lett. B 681, 418 (2009) [arXiv:0909.0391 [nucl-th]].
- (12) A. K. Chaudhuri, J. Phys. G 35, 104015 (2008) [arXiv:0804.3458 [hep-th]].
- (13) V. Roy and A. K. Chaudhuri, Phys. Lett. B 703, 313 (2011)
- (14) A. K. Chaudhuri and V. Roy, Phys. Rev. C 84, 027902 (2011) [arXiv:1102.4936 [nucl-th]].
- (15) G. Policastro, D. T. Son and A. O. Starinets, Phys. Rev. Lett. 87, 081601 (2001).
- (16) P. Kovtun, D. T. Son and A. O. Starinets, JHEP 0310, 064 (2003).
- (17) R. J. Fries, B. Muller and D. K. Srivastava, Phys. Rev. Lett. 90, 132301 (2003) [arXiv:nucl-th/0208001].
- (18) C. Gale, Nucl. Phys. A 774, 335 (2006).
- (19) D. Lohner [ALICE Collaboration], arXiv:1212.3995 [hep-ex].
- (20) S. Afanasiev et al. [PHENIX Collaboration], Phys. Rev. Lett. 109, 152302 (2012) [arXiv:1205.5759 [nucl-ex]].
- (21) A. Adare et al. [PHENIX Collaboration], Phys. Rev. Lett. 109, 122302 (2012) [arXiv:1105.4126 [nucl-ex]].
- (22) K. Miki [PHENIX Collaboration], J. Phys. G 35, 104122 (2008).
- (23) S. S. Adler et al. [PHENIX Collaboration], Phys. Rev. Lett. 94, 232301 (2005).
- (24) J. e. Alam, J. Phys. G 34, S865 (2007) [arXiv:nucl-th/0703056].
- (25) R. Chatterjee, E. S. Frodermann, U. W. Heinz and D. K. Srivastava, Phys. Rev. Lett. 96, 202302 (2006) [arXiv:nucl-th/0511079].
- (26) C. Gale, S. Turbide, E. Frodermann and U. Heinz, J. Phys. G 35, 104119 (2008) [arXiv:0806.0610 [hep-ph]].
- (27) F. -M. Liu, T. Hirano, K. Werner and Y. Zhu, Phys. Rev. C 80, 034905 (2009) [arXiv:0902.1303 [hep-ph]].
- (28) F. -M. Liu, T. Hirano, K. Werner and Y. Zhu, Nucl. Phys. A 830, 587C (2009) [arXiv:0906.3566 [hep-ph]].
- (29) F. -M. Liu, Nucl. Phys. A 855, 355 (2011) [arXiv:1012.0086 [nucl-th]].
- (30) I. Helenius, K. J. Eskola and H. Paukkunen, JHEP 1305, 030 (2013) [arXiv:1302.5580 [hep-ph]].
- (31) H. van Hees, C. Gale and R. Rapp, Phys. Rev. C 84, 054906 (2011) [arXiv:1108.2131 [hep-ph]].
- (32) H. Holopainen, S. Rasanen and K. J. Eskola, Phys. Rev. C 84, 064903 (2011) [arXiv:1104.5371 [hep-ph]].
- (33) J. K. Nayak and B. Sinha, Phys. Lett. B 719, 110 (2013) [arXiv:1210.3993 [nucl-th]].
- (34) J. I. Kapusta, P. Lichard and D. Seibert, Phys. Rev. D 44, 2774 (1991) [Erratum-ibid. D 47, 4171 (1993)].
- (35) H. Nadeau, J. I. Kapusta and P. Lichard, Phys. Rev. C 45, 3034 (1992).
- (36) S. Turbide, R. Rapp and C. Gale, Phys. Rev. C 69, 014903 (2004) [hep-ph/0308085].
- (37) P. Aurenche, F. Gelis, R. Kobes and H. Zaraket, Phys. Rev. D 58, 085003 (1998) [arXiv:hep-ph/9804224].
- (38) P. Aurenche, F. Gelis and H. Zaraket, Phys. Rev. D 61, 116001 (2000) [arXiv:hep-ph/9911367].
- (39) P. Aurenche, F. Gelis and H. Zaraket, Phys. Rev. D 62, 096012 (2000) [arXiv:hep-ph/0003326].
- (40) P. B. Arnold, G. D. Moore and L. G. Yaffe, JHEP 0112, 009 (2001) [hep-ph/0111107].
- (41) A. K. Chaudhuri, arXiv:0801.3180 [nucl-th].
- (42) Y. Aoki, G. Endrodi, Z. Fodor, S. D. Katz and K. K. Szabo, Nature 443, 675 (2006)
- (43) Y. Aoki, S. Borsanyi, S. Durr, Z. Fodor, S. D. Katz, S. Krieg and K. K. Szabo, JHEP 0906, 088 (2009)
- (44) S. Borsanyi et al., JHEP 1011, 077 (2010) [arXiv:1007.2580 [hep-lat]].
- (45) Z. Fodor, J. Phys. Conf. Ser. 230 (2010) 012013.
- (46) U. A. Wiedemann and U. W. Heinz, Phys. Rept. 319, 145 (1999) [nucl-th/9901094].
- (47) E. Frodermann and U. Heinz, Phys. Rev. C 80, 044903 (2009) [arXiv:0907.1292 [nucl-th]].
- (48) D. K. Srivastava and J. I. Kapusta, Phys. Rev. C 48, 1335 (1993).
- (49) J. -eAlam, B. Mohanty, P. Roy, S. Sarkar and B. Sinha, Phys. Rev. C 67, 054902 (2003) [nucl-th/0302054].
- (50) J. Adams et al. [STAR Collaboration], Phys. Rev. C 71, 044906 (2005) [nucl-ex/0411036].
- (51) S. S. Adler et al. [PHENIX Collaboration], Phys. Rev. Lett. 93, 152302 (2004) [nucl-ex/0401003].
- (52) K. Dusling, Nucl. Phys. A 839, 70 (2010) [arXiv:0903.1764 [nucl-th]].
- (53) A. K. Chaudhuri and B. Sinha, Phys. Rev. C 83, 034905 (2011) [arXiv:1101.3823 [nucl-th]].
- (54) M. Dion, J. -F. Paquet, B. Schenke, C. Young, S. Jeon and C. Gale, Phys. Rev. C 84, 064901 (2011) [arXiv:1109.4405 [hep-ph]].