Measurement of the proton-proton total, elastic, inelastic and diffractive cross sections at = 2, 7, 8 and 57 TeV
Abstract
The measurement of the total cross section and its various sub-components (elastic, inelastic and diffractive) is a very powerful tool to understand the proton macro structure and fundamental QCD dynamics. In this contribution I first provide a theoretical introduction to the topic, then a summary of the experimental techniques and finally I review the new results from AUGER and LHC experiments.
I Setting the stage
Figure 1 shows the cross section values for many important processes as a function of center-of-mass energy .
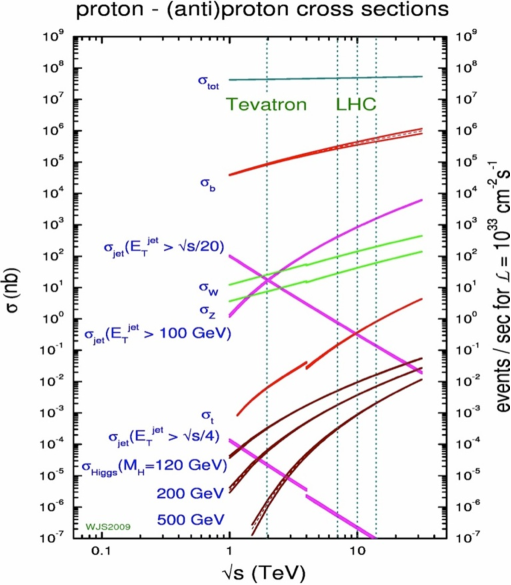
It is clear from the figure that the value of the total cross section () is orders of magnitude larger than very abundant QCD processes such as the production of b-quarks. The reason for this fact is that the total cross section is dominated by soft QCD physic processes. The typical value of the total cross section is
which is equivalent to the scattering of two hard balls with a radius of one Fermi () each. The geometrical interpretation is really not that useful in particle physics, as the scattering amplitude is often governed by resonance effects which greatly enhance the probability of a process. Consider for example the boron cross section to capture a neutron: it reaches 1200 barns, while the boron geometrical size is about 0.1 barn. The intuitive picture of scattering is further complicated when we consider that the proton is actually a composed objects, made of valence quarks, , plus sea quarks and gluons. The valence quarks are what identify a proton as a proton, while the sea-quarks and the gluons can be considered symmetric and therefore identical in protons and anti-protons (this last statement is not entirely true, but the non symmetric part does not have an impact on the measurement of the total cross section).
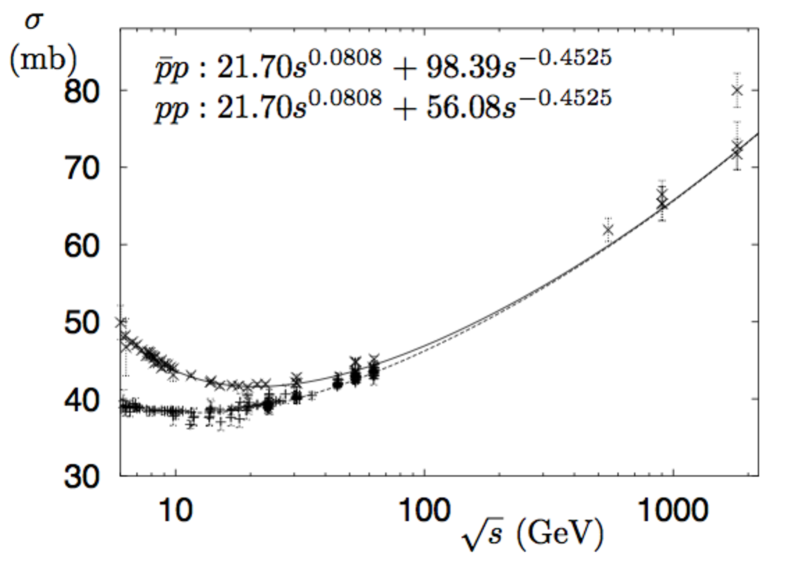
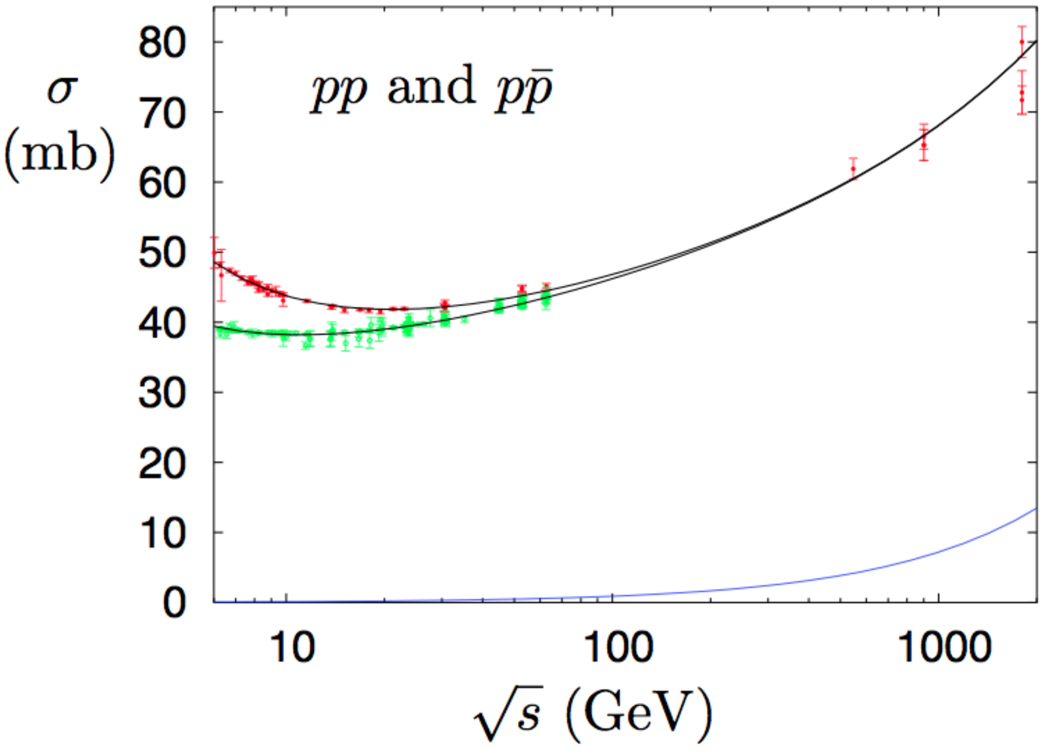
Figure 2 shows the value of the and total cross section as a function of , up to 2 TeV. From this figure we can already understand a very important fact: at low energy, 200 GeV, the values of and are different and therefore the valence quarks must play an important role, whilst at higher energy the values of and are the same, indicating that the scattering is dominated by the -symmetric component.
II Theoretical framework
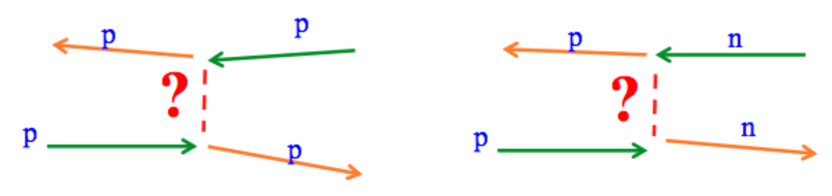
A large part of the total cross section is due to soft processes such as the elastic channel, Figure 3 (left pane) or charge-exchange reactions, Figure 3 (right pane). It is therefore important to understand what is the mechanism underlying these processes and what theoretical models can be used to quantify them.
Regge theory Regge:first is the framework that is used to study many soft QCD processes such as diffraction and the total cross section and it describes high-energy scattering at small in terms of the exchanges of mesons and possibly glueballs. For a detailed discussion about pomeron physics and QCD see for example Pom . The first main feature of Regge theory is based on the observation that group of particles order themselves in straight lines (trajectories) when plotted in the complex angular moment - plane, where is the 4-momentum transfer squared.
The particles are such that, whenever (where is the mass of a particle in the trajectory), then correspond to the spin of the particle, Figure 4.
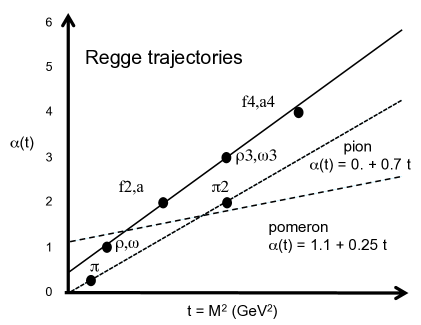
Regge theory explains that these trajectories can be understood as group of particles that are exchanged together, i.e., referring to Figure 4, in the scattering process not just the particle is exchanged, but all particles on the trajectory. Mathematically, each particle is a pole in the analytic expression of the scattering amplitude of processes mediated by its own trajectory. The second main feature of the Regge pole model is the relationship between exchanged trajectories and high-energy behaviour: a given trajectory contributes to according to:
where is the imaginary part of the scattering amplitude computed at GeV and is the intercept of the exchanged trajectory. The equation of the trajectory indicates a very important feature: if the intercept is lower than one, the contribution of a trajectory to decreases as a function of increasing .
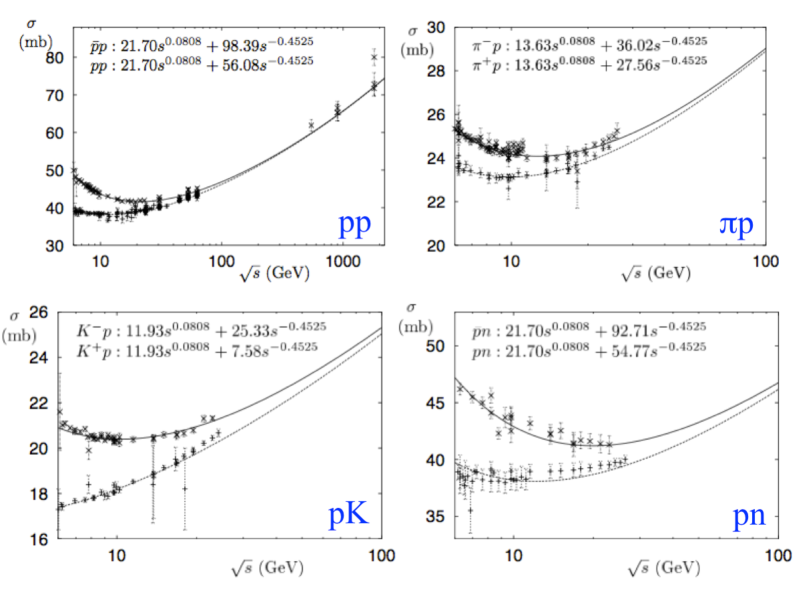
An interesting fact happens: each known trajectory has the intercept lower than one and therefore provides a decreasing contribution to . This prediction is, however, not supported by the experimental points: following an initial decrease of the cross section with that follows the behaviour predicted by the exchange of reggeon trajectories (), the value of the cross section rises with the trend . This general feature is displayed in Figure 5 where the value of versus is plotted for several different scattering processes ().
This contradiction is eliminated by introducing a new trajectory with an intercept slightly larger than one: the pomeron trajectory, also shown on Figure 4. This special trajectory does not have any on-shell particle on it, and therefore it could not have been measured using the known particles. The pomeron trajectory is probably related to the exchange of glueballs, however the experimental measurements of glueball states up to now do not support or deny this idea. The intercept of the pomeron trajectory is traditionally written as:
with, according to Figure 5, .
For a given scattering process, the exchanged particles (poles) on the reggeon and pion trajectories offer guidance on how to write the scattering amplitude , however this is not the case for the pomeron trajectory, as it has no particles on it: the analytical form of for pomeron exchange is less constrained and it depends on the type of diagram considered. The possible contributions of the pomeron trajectory to the total cross section can contain different terms:
| (1) | |||
| (2) | |||
| (3) |
where Equation 1 is for a simple poles type of exchange, while Equation 2 and Equation 3 are for more complicate processes.
The three most common parametrizations of the cross section are:
| (4) | |||
| (5) | |||
| (6) |
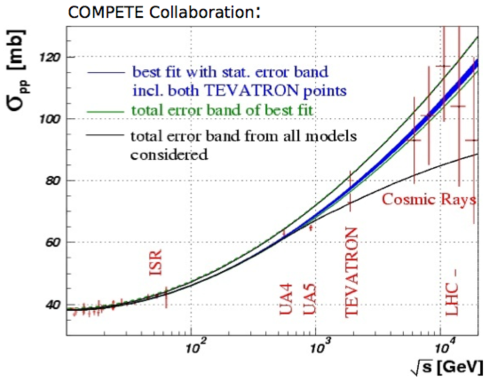
The various diagrams have been analyzed by the COMPETE Nicolescu:2001um Cudell:2001ma collaboration, which has produced a prediction for the evolution of the value of the total cross section as a function of , Figure 6. These studies find that the analytic form that fits the low energy data points better is Equation 5.
Their best pre-LHC predictions are:
| (7) | |||
| (8) | |||
| (9) |
II.1 The rise of the gluon distribution
Following the experimental discovery at HERA of the steep rise of the gluon distribution as a function of , the predictions for the value of the total cross section at LHC energy were updated. In particular, Equation 4 was modified introducing a second simple pole, the so called hard pomeron Landshoff:2007uk Cudell:2009bx :
| (10) |
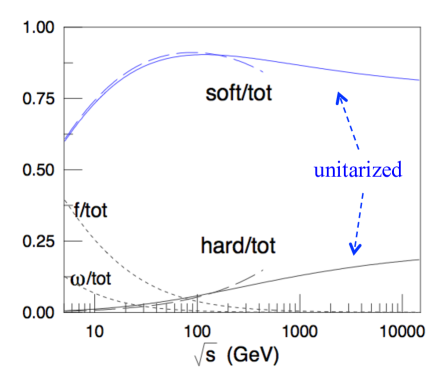
The combined fit using the soft and hard pomerons lowers the soft pomeron intercept from to while the hard pomeron intercept value of is perfectly compatible with HERA results. Figure 7 shows the various contributions to the cross section as a function of .
II.2 Paradoxes, bounds and unitarization effects
The Regge formalism outlined above leads to predictions that cannot be accurate at very high energies. For example, it is clear that the cross section cannot rise indefinitely as .
Using s-channel unitarity and S-matrix analyticity constraints it is possible to derive the so called Froissart-Martin bound:
with GeV and = 30 mb. Even though this bound has no effect at LHC energies as it requires barn and barn, it puts a limit on the possible growth of .
Likewise, the Regge formalism predicts that the elastic cross section grows with energy faster than the total cross section
creating the paradox that at a certain energy the elastic cross section would be larger than the total cross section. This condition, however, does not happen as it can be shown that the elastic cross section should always be less than half of the total cross section: , the so called Pumplin bound.
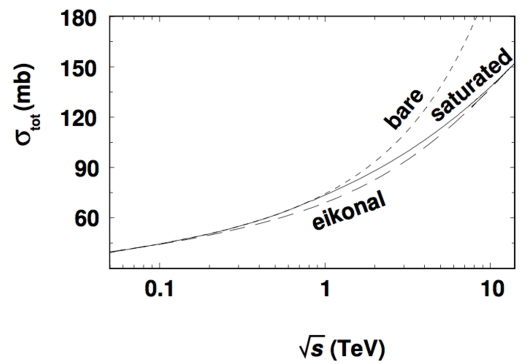
The inclusion of these bounds and the effects of multiple exchanges in the calculation of the value of the total cross section is called unitarization. The overall effect of unitarization is to reduce the value of the total cross section: Figure 8 shows the predictions of the two-pomeron model without (bare) and with (eikonal, saturated) unitarization effects. It’s interesting to note that the prediction from a given model is the outcome of the interplay of its functional expression and the unitarization scheme used.
III Proton - proton elastic scattering
Elastic scattering, , is a very important process to probe the macro structure of the proton, and it represents roughly one forth of the total cross section. A sketch of the proton macro structure, following Islam , is shown in Figure 9: the outer corona (1) is composed by condensates, the middle part is a shell of baryonic charge density (2), while the valence quarks are confined at the center (3).
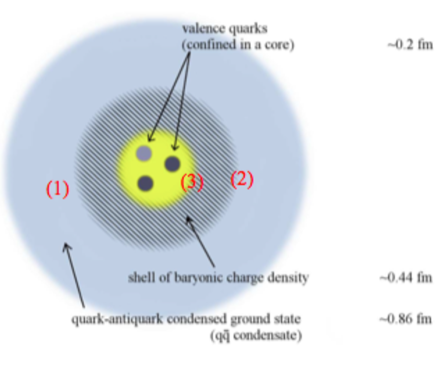
Elastic scattering probes the proton at a distance given by . At low values, the cross section is well approximated by an exponential form:
and is largely dominated by the outer corona (1), Figure 10.
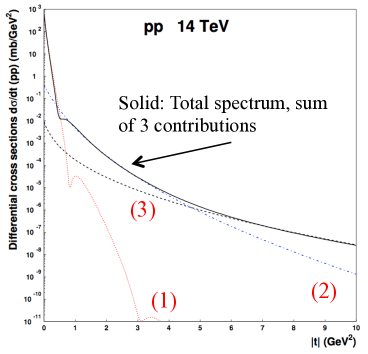
At higher values of , the cross section has a more complex form, reflecting the additional contributions from inner layers. At values of above 4 GeV2 the cross section is dominated by quark-quark elastic scattering (the so called deep elastic scattering).
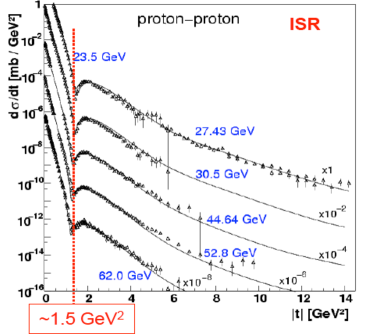
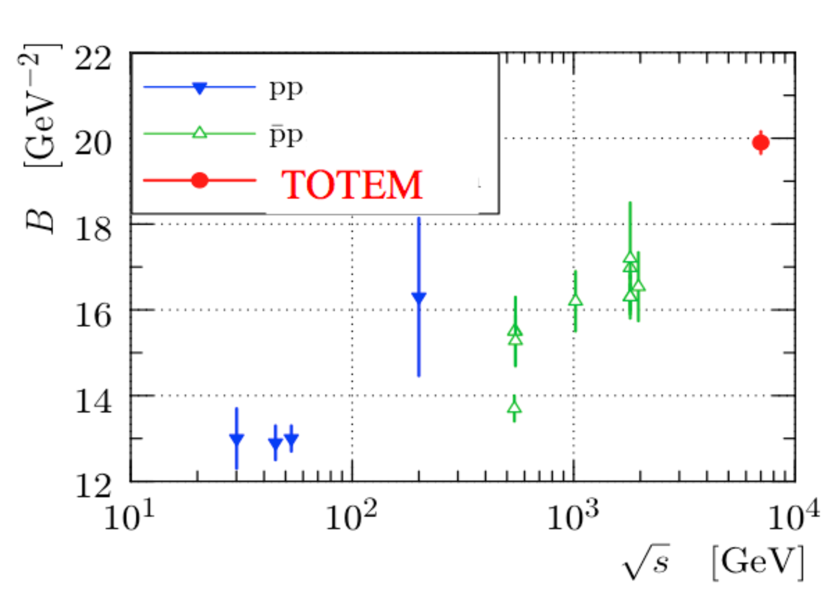
As grows, not only the proton becomes blacker (the cross section increases) but also grows in size: the value of the slope parameter increases (the so called “shrinkage of the forward peak”), indicating an average lower values of and therefore a longer interaction range. The relative importance of the various components described in Figure 10 changes with energy as shown by the experimental data from ISR, Figure 11, where the values of the position and depth of the dip decrease with increasing .
IV Montecarlo models
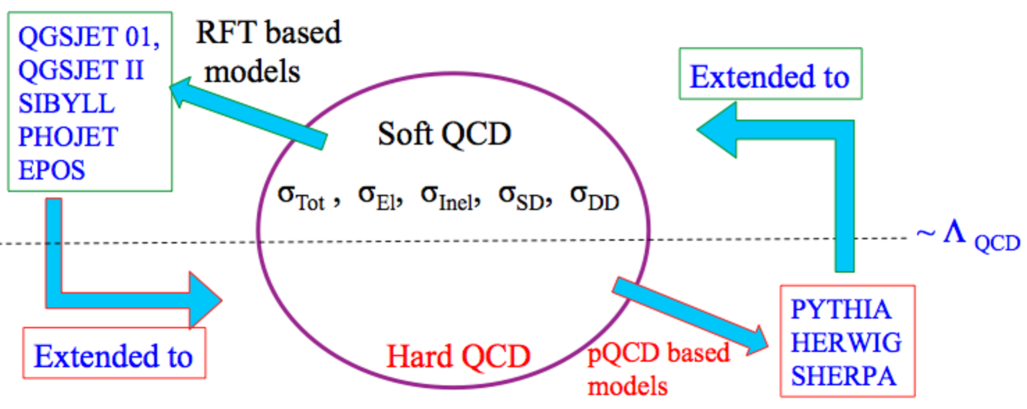
The Montecarlo (MC) models commonly used in high-energy and cosmic-rays physics can be approximately divided into two large families. The MC models in the first group (QGSJET, SIBYLL, PHOJET, EPOS) are based on Regge Field Theory (RFT), and they differ among themselves for the implementation of various aspects of the model parameters. For their focus on soft and forward physics they have been intensively used in cosmic-rays physics and they are a very important tool in the study of the total cross section. These MC models have been extended to also provide predictions for hard QCD processes.
The second group of MC models is based on the calculation of perturbative QCD matrix elements (PYTHIA, HERWIG, SHERPA) and the relative importance and absolute values of soft processes (total and inelastic cross section, fraction of non-diffractive and diffractive events) just reflects the chosen internal parametrization.
Both families can be used when studying soft QCD, but these differences, outlined in Figure 12, need to be considered when interpreting the results.
V Topologies of events in
Three main components contribute to the value of .
-
(i)
Elastic scattering : 20-25% of .
This is a very difficult process to measure and requires dedicated hardware, often installed and operated by dedicated experiments. -
(ii)
Diffractive scattering : 25 - 35 % of .
This group includes all processes that are mediated by the exchange of a pomeron, . These events are recognizable by the presence of a large gap in the rapidity distributions of final state particles. For Reggeon or Pomeron exchange the probability to have a rapidity gap depends on the value of the intercept of the exchanged trajectoryKopeliovich:1996iw :Let’s then consider different possibilities:
-
–
:
-
–
:
-
–
:
Therefore, even though are colourless exchanges, only exchange produces rapidity gaps that are not suppressed as the gap width increases. It is therefore possible to operationally define diffraction ref:bj by the presence of a rapidity gap: diffractive events are those which lead to a large rapidity gap in final state phase space and are not exponentially suppressed as a function of the gap width.
This process includes single, double and central diffraction. Low mass diffraction is experimentally difficult to measure as the hadronic activity produced in the interaction is very small.
-
–
-
(iii)
Non-diffractive scattering (everything else): 50-60%.
This is the easiest part to measure, as normally the events have a large number of particles and can be easily detected.
The distinction between elastic and non-elastic scattering is quite obvious, therefore often the results are presented in terms of three components: and . On the other hand, the distinction between diffractive and non-diffractive events is much less straightforward and it requires MC models to asses the efficiency of detecting rapidity gaps in the distribution of final state particles. The values of the single, , and double, , diffraction cross sections are therefore more difficult to evaluate, and they are often quoted inside certain limits, either in mass or rapidity.
VI Measurement of , and using elastic scattering.
The TOTEM experiment at the LHC has the capability to detect elastic scattering and to measure the differential cross-section for elastic scattering as a function of the four-momentum transfer squared Antchev:2013gaa . The differential distribution is shown in Figure 13.
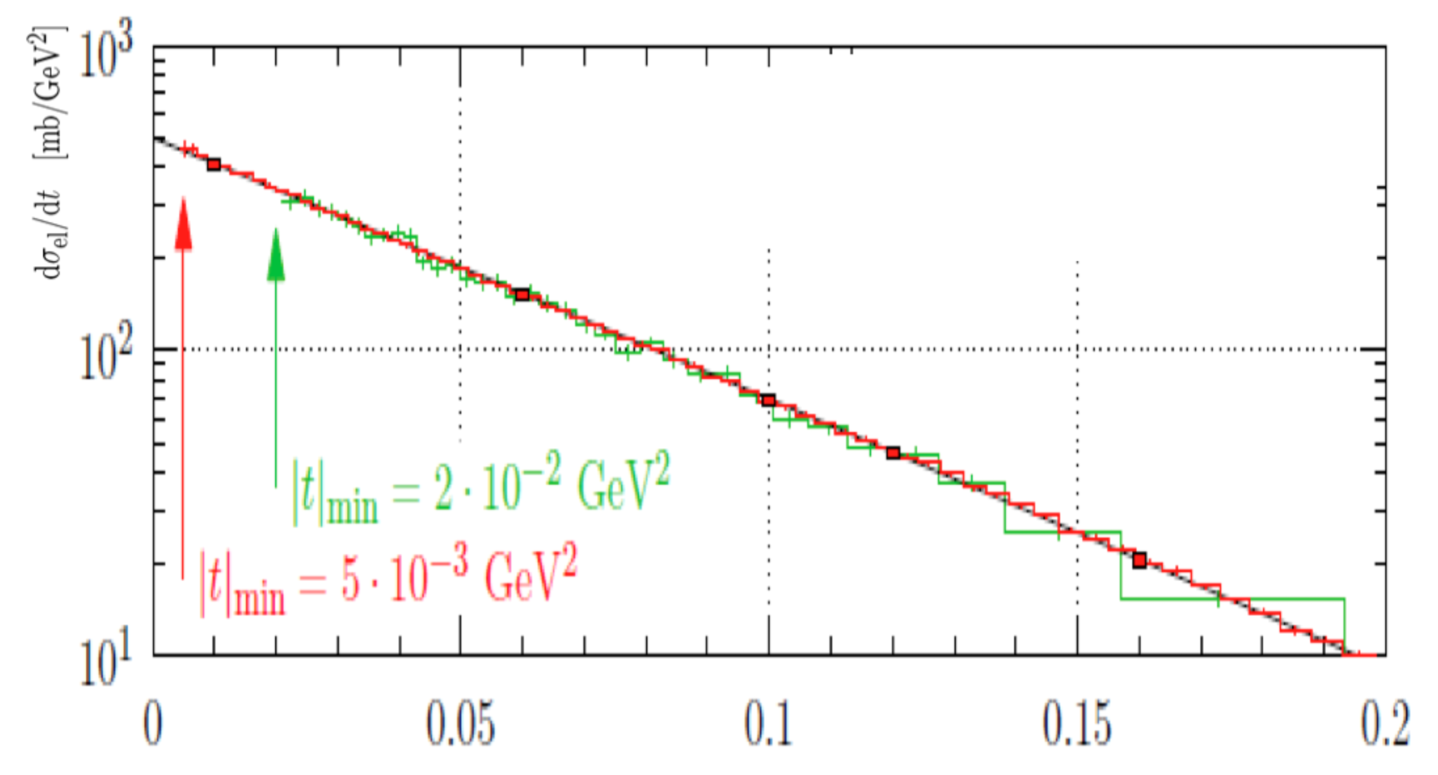
The elastic data were integrated up to GeV2, where the effect of the larger -contributions is small compared to the other uncertainties. The optical theorem can be used to calculate the total cross-sections from the value of the distribution extrapolated to GeV2:
| (11) |
where the is the ratio of the real to the imaginary part of the forward scattering amplitude. The value of has both been predicted by the COMPETE collaboration () Cudell:2002xe and measured by TOTEM () Antchev:2013iaa . In order to derive the elastic and total cross-sections, the extrapolation to the optical point GeV2 was performed.
The minimum value that can be reached using the TOTEM roman pots depends on the LHC optics: as the angular beam spread is inversely correlated with the accelerator parameter , , it is necessary to have large values to achieve a small beam angular spread and therefore be able to measure low values of . In 2012 the largest value of achieved by the LHC has been m, allowing to detect scattered protons with GeV2.
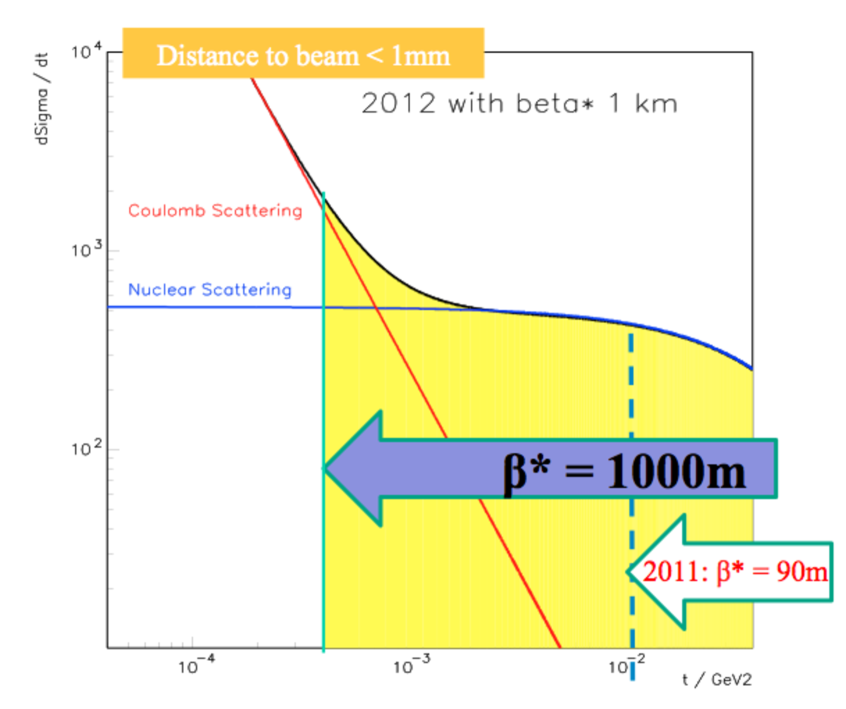
Figure 14 schematically shows the reachable part of the distribution for two values, assuming a distance of the detectors from the beam of about one millimetre.
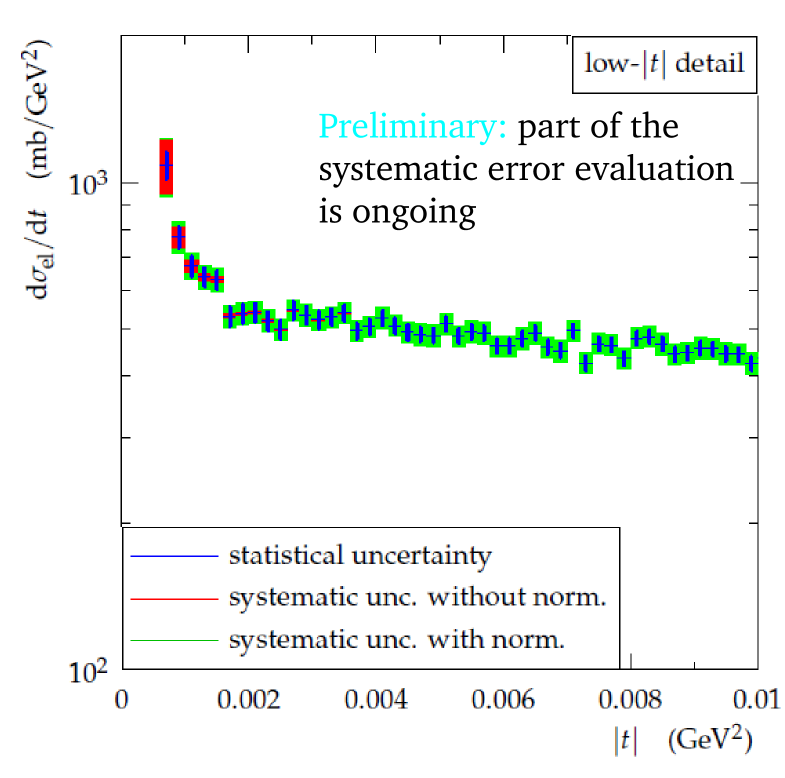
Such a high value allowed the TOTEM collaboration to measure the -distribution in the Coulomb region DIS2013:totem , as shown in Figure 15. This measurement will allow to determined the parameter, validating the model of the interference between the hadronic and Coulomb amplitudes and reducing the error on the determination of the cross section.
In the low range ( GeV2), the TOTEM collaboration fitted the distribution using a simple exponential:
and obtained a value of the slope parameter given by
This value confirms that the shrinkage of the forward peak continues at LHC energy.
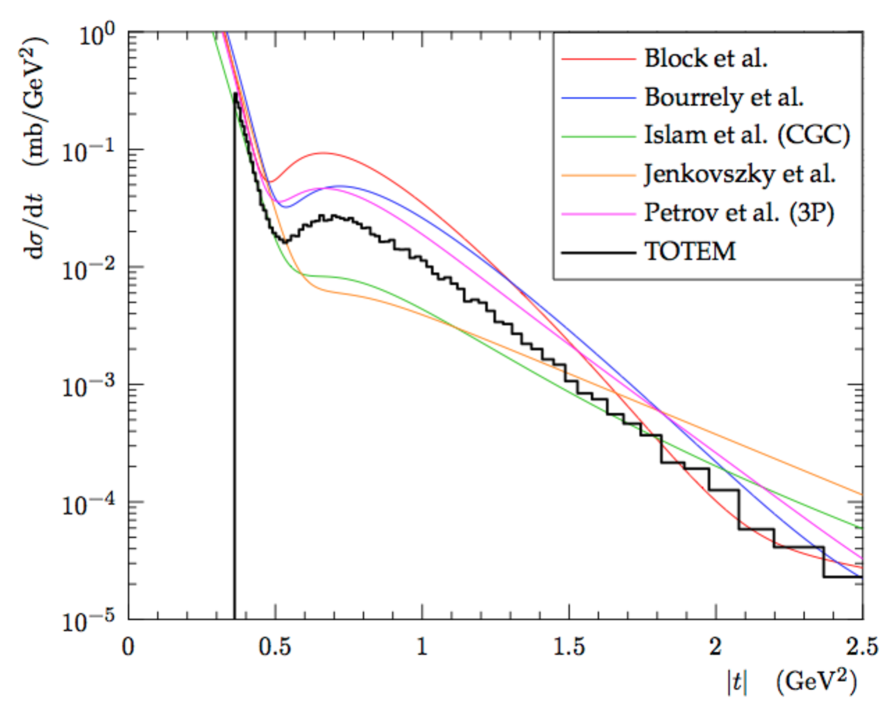
The TOTEM collaboration has also measured the differential distribution in an extended range.
As outlined in Section III, this measurement is a unique tool to identify the proton macro regions.
Figure 17 shows this result together with the prediction of several proton models which do not quite reproduce the data well.
In the TOTEM analysis, the value of is obtained using Equation 11 while the value of the inelastic cross section is obtained by subtraction:
Using data collected both at 7 and 8 TeV, the TOTEM collaboration has produced a complete set of measurements, shown in Table 1.
| Measurement | |||
|---|---|---|---|
| TeV | 98.6 2.8 mb | 25.4 1.1 mb | 73.1 1.3 mb |
| TeV | 101.7 2.9 mb | 27.1 1.4 mb | 74.7 1.7 mb |
VII Measurements of parts of and extrapolation to its total value.
As outlined above, the complete measurement of all processes that compose is very difficult and currently no experiment is able to do it. Both cosmic-rays and collider experiments can directly measure only parts of and therefore need to use MCs or analytical models to provide an estimate of the full values of .
The energy range of collider and cosmic-ray experiments is largely overlapping, however the highest energy is reached only by the AUGER and HiRes experiments. The cosmic-rays EAS-TOP experiment overlaps in energy with the Tevatron and LHC low energy runs (1-2 TeV) while the cosmic-rays experiments AGASA and Fly’s Eye overlap with the high energy runs of LHC (7-14 TeV). The cosmic-rays experiment HiRes and AUGER measures in the energy range 50-100 TeV, well above current collider experiments, Figure 21.
VIII Cosmic-rays experiments
Cosmic-rays experiments measure the interaction of the primary particle with a nucleus in the atmosphere via the detection of secondary particles, generated in the hadronic shower, that reach ground level. This method is bound to carry significant uncertainties as the measured quantities are only indirectly related to the primary scattering event: the cosmic-rays flux composition, the atmospheric molecular mixture, the modelling of the hadronic shower, and the limited detector acceptance concur to the measurement uncertainties.
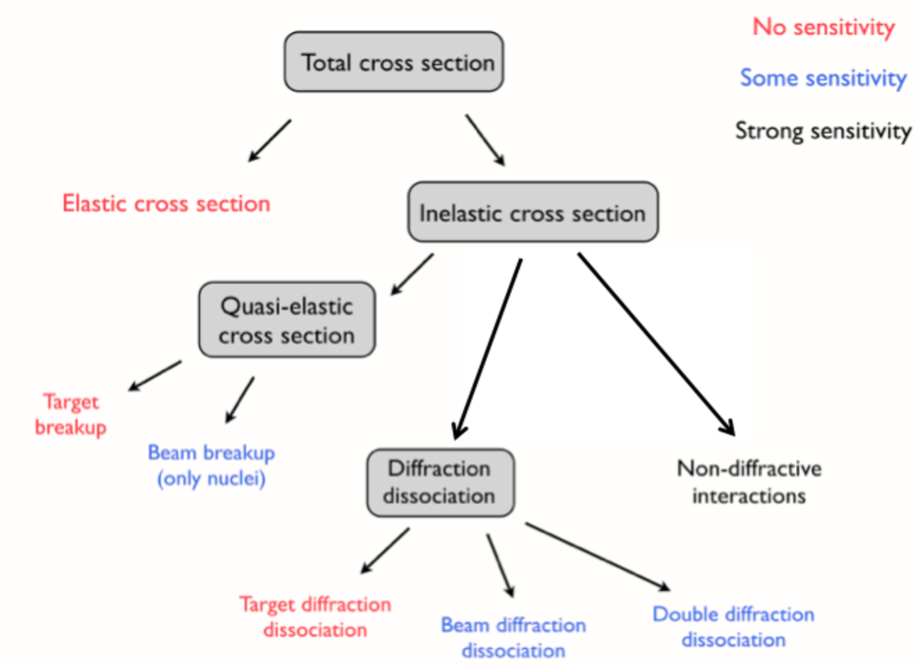
The measurement is sensitive mostly to the non-diffractive part of the inelastic cross section, it has moderate sensitivity to diffractive dissociative processes of the incoming primary particle and no sensitivity to other processes, Figure 18.
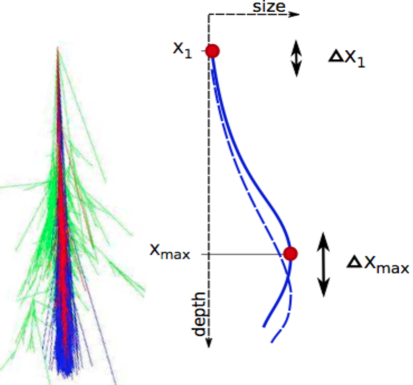
The value of directly influence the distance that the primary particle travels in air before interacting, Figure 19 : lower values of the cross section move the point of interaction deeper into the atmosphere. There are two main methods to reconstruct the position.
-
(i)
: the ratio of the number of electrons to the number of muons is related to the shower length. By measuring this ratio together with the shower direction, the position of can be determined. This method relies on MC models to simulate the shower development and to correctly predict the ratio as a function of shower depth.
-
(ii)
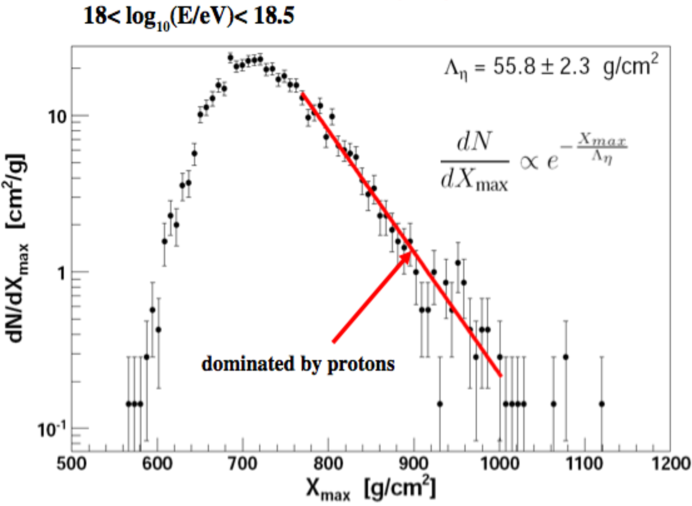
-tail: for fixed energy of the primary particle, the probability of having a shower maximum deeper and deeper in the atmosphere decreases exponentially and therefore fitting the distribution of the position of shower maximum as a function of the depth allows to reconstruct , Figure 20. To select a sample of primary particles rich in protons, the deeper tail of the distribution is used in the fit as heavier primary particles interact earlier on.
The AUGER collaboration Collaboration:2012wt , using this second method, has recently published a new result for the proton-air inelastic cross section at 57 TeV:
Figure 21 shows a compilation of the results of total inelastic cross section (adapted from Ulrich:2009zq ).
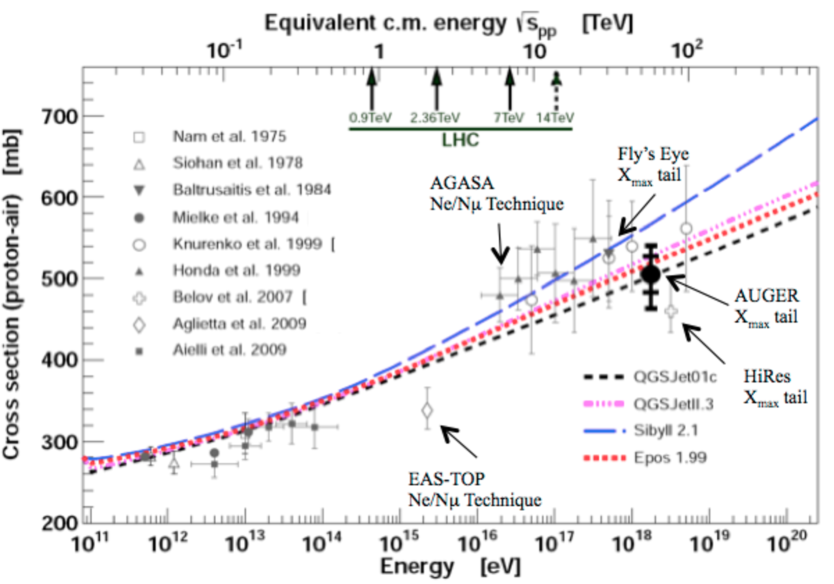
The range of values used in the fit is chosen so that the remaining helium and heavy nuclei contribute less than the statistical uncertainty. The first step of the measurement is the evaluation of which, using MC models, is linked to the value of . The determination of has a systematic uncertainties of mb, while the remaining part of the systematic uncertainty is due to the process of extracting .
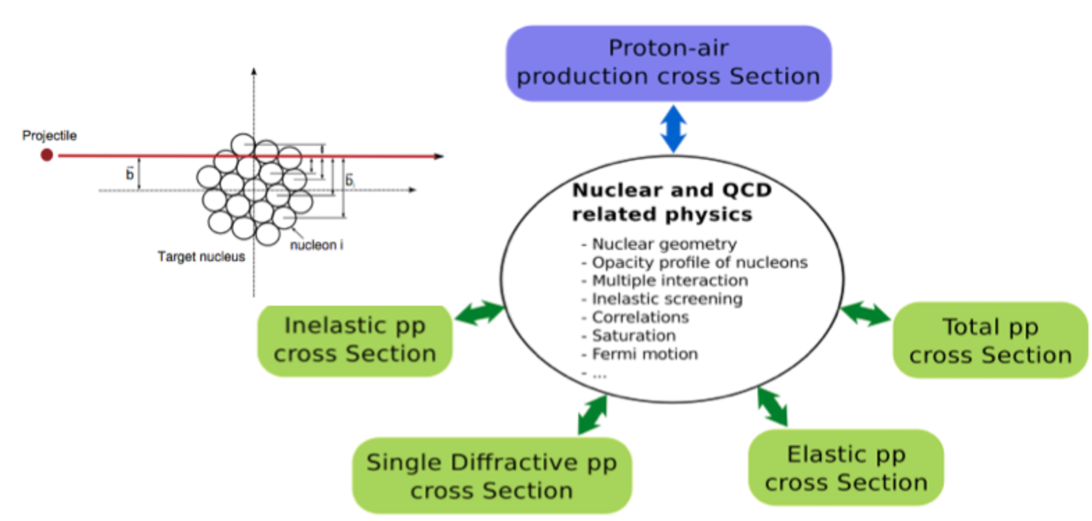
From , the values of the proton-proton inelastic and total cross-sections can be obtained using the Glauber model (for an introduction see Shukla:2001mb ) that describes the proton-nucleus (and also nucleus-nucleus) scattering as a sum of elementary nucleon-nucleon interactions. The Glauber model takes into account various nuclear and QCD effects such as nuclear geometry, opacity of nucleons, multiple interactions, diffraction, saturation, Fermi motion, the total, inelastic and elastic cross sections at lower energies and the value of at 57 TeV to provide an estimate of the proton-proton total and inelastic cross sections, Figure 22.
The AUGER collaboration finds that in the Glauber framework the inelastic cross-section is less dependent on model assumptions than the total cross-section. The result for the inelastic and total proton-proton cross-sections are
and
IX Collider experiments
Collider experiments such as ALICE, ATLAS and CMS are able to directly measure the fraction of composed by those events that leave enough energy in the detector, typically in a rapidity interval , where the definition of enough is experiment and technique dependent. The results published so far rely on two different methods: (i) Pile-up counting (ii) Forward energy deposition.
IX.1 Pile-up method to determine
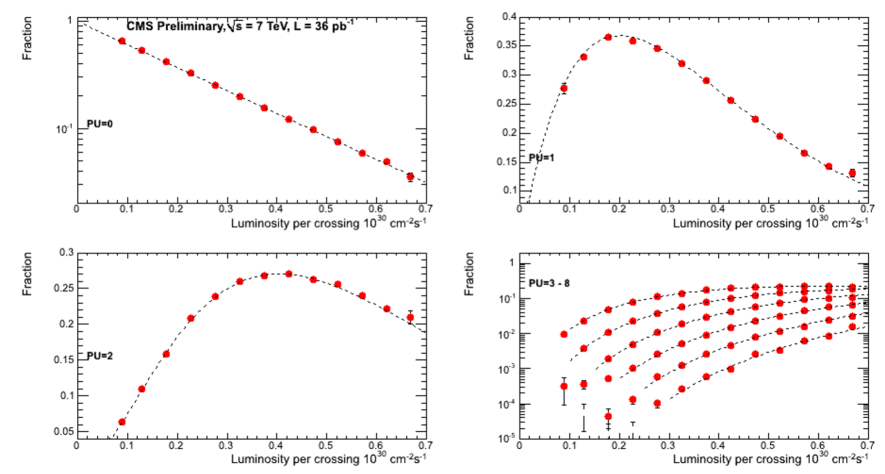
This method, used for the first time by the CMS collaboration Chatrchyan:2012nj , assumes that the number of inelastic interactions in a given bunch crossing follows the Poisson probability distribution:
| (12) |
where is calculated from the product of the instantaneous luminosity for a bunch crossing and the total inelastic cross section: . This technique counts the number of vertices in different luminosity intervals, and performs a fit using equation 12. By construction, this method is sensitive only to those events that produce a detectable vertex. To collect an unbiased sample of interactions, the event selection is performed using a high- muon trigger, which is completely insensitive to the presence of pile-up. Note that the event containing the triggering muon is not counted towards the total number of vertices for a given crossing.
The probability of having inelastic interactions ( between 0 and 8), each producing a vertex with at least two charged particles with 200 MeV/c within = 2.4, is measured at different luminosities to evaluate from a fit of Equation 12 to the data, Figure 23. For each , the values of the Poisson distribution given by Equation 12 are fitted as a function of to the data, providing an estimates of .
IX.2 Forward energy method to determine
The basic idea of this method is to count the number of events that, in a given interval of integrated luminosity, deposit at least a minimum amount of energy in either of the forward parts of the detector; the number of events is then converted into a value of cross section by accounting for detector and pile-up effects. ATLAS and CMS require at least GeV in the rapidity interval which is equivalent to, according to MC studies, a minimum hadronic mass of at least 16 GeV/c2 ( ).
The TOTEM collaboration, using their T1 and T2 forward detectors ( 3.1 6.5), measured for events with at least one final-state particle Antchev:2013bb . This measurement includes all events with GeV, aside for a small component of central diffractive events of which maximally 0.25 mb is estimated to escape the detection of the telescopes.
The two techniques outlined above are complementary: the pile-up technique measures more central events, while the forward energy technique is geared towards more forward topologies. Their combination covers almost completely all type of events with a minimum particle production in the pseudorapidity interval . The comparison of these results with various MCs provides interesting information to model builders, as they test complementary parts of particle production.
IX.3 Results on
Table 2 lists the results from the ALICE Abelev:2012sea ATLAS Aad:2011eu , CMS Chatrchyan:2012nj and TOTEM Antchev:2013bb Collaborations for several selection criteria. The ALICE, ATLAS and TOTEM collaborations have extrapolated the measured values to provide also an estimate of . As the TOTEM collaboration has the most forward pseudorapidity reach, their value has the smallest systematic error. Figure 24 shows a compilation of the results for different selection criteria, and a comparison with several MCs predictions.
| Exp | Measurement | Result | Stat | Syst | Lum |
|---|---|---|---|---|---|
| ALICE | 62.1 | mb | |||
| ATLAS | 60.3 | mb | |||
| CMS | 60.2 | mb | |||
| TOTEM | 70.5 | mb | |||
| ALICE | 73.2 | mb | |||
| ATLAS | 69.4 | mb | |||
| TOTEM | 73.7 | mb | |||
| CMS | 58.7 | mb | |||
| CMS | 57.2 | mb | |||
| CMS | 55.4 | mb |
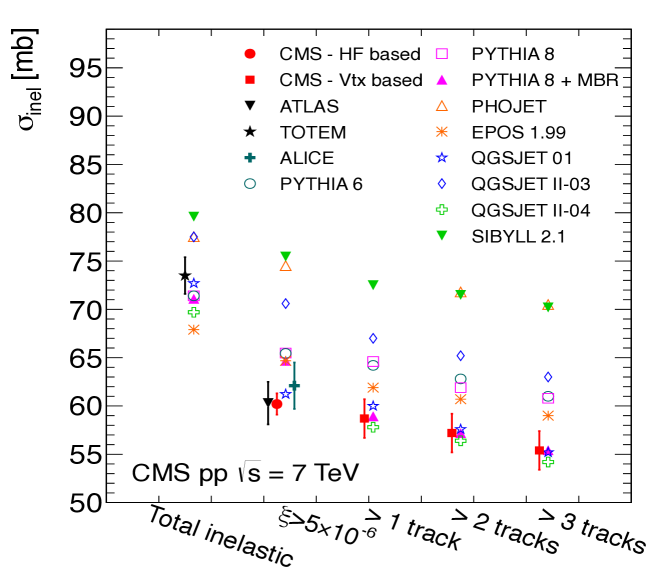
The data points are compared to a large set of predictions from many MC models, used both in cosmic-rays physics and collider experiments. Although several Monte Carlo models such as EPOS, QGSJET 01, QGSJET II-4, PYTHIA 6, and PYTHIA 8 reproduce correctly the value of , only QGSJET 01, QGSJET II-04, and PYTHIA 8-MBR (but less so) are able to simultaneously reproduce the less inclusive measurements. This observation suggests that most of the Monte Carlo models overestimate the contribution from high-mass events to the total inelastic cross section, and underestimate the component at low mass.
X Measurement of the diffractive component of
The most used technique to select diffractive events is the request of a gap in the rapidity distribution of final state particles. This method, however, has several drawbacks: rapidity gaps can also appear in non-diffractive events, albeit less frequently and high mass diffractive events often have a rapidity gap that is too small to be used as a signature and therefore they cannot be selected using this method.
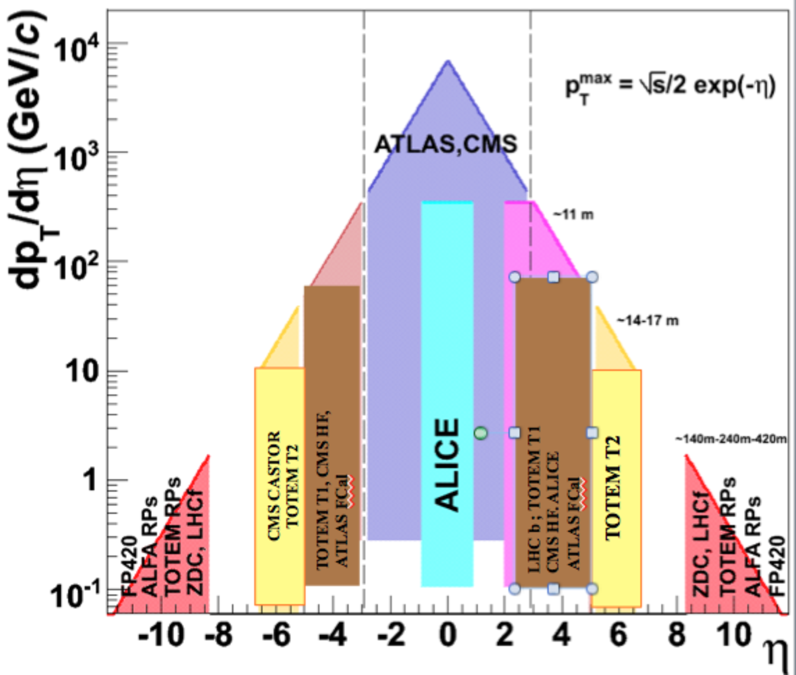
At LHC, the rapidity interval is roughly 20 units, while the experimental coverage of the various experiments is much less, Figure 25: ATLAS and CMS cover roughly 10 units of rapidity, centrally from -5 to 5, TOTEM covers only forward rapidities, 3.1 while ALICE has an asymmetric coverage, .
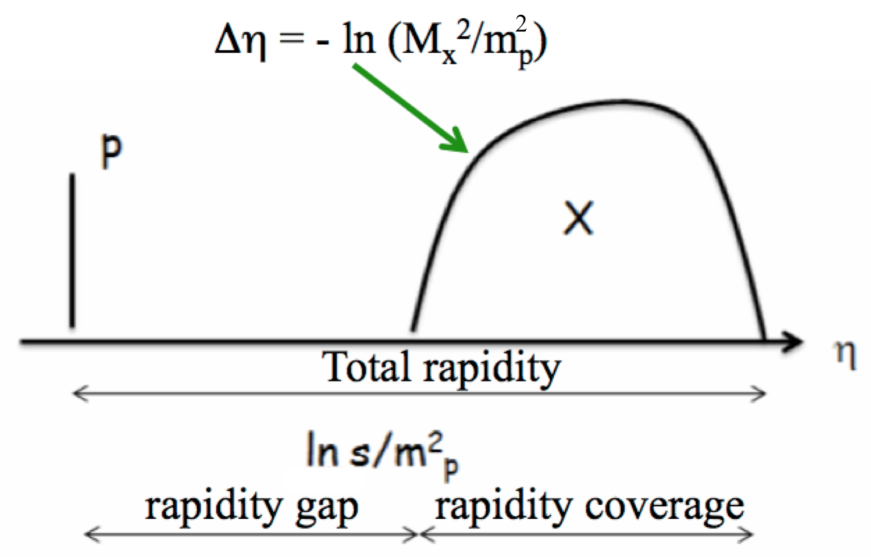
The rapidity span of an event with mass is given by while the rapidity gap of the event is given by , with the proton mass and , Figure 26. For this reason small mass events are very difficult to measure as they are boosted forward and don’t leave in the detector any signature: an event with 5 GeV covers only 3 unit of rapidity and therefore escapes detection. The experimental limit of detection for both ATLAS and CMS is , which correspond to a mass GeV at 7 TeV while TOTEM reaches down to GeV.
The selection of diffractive events is defined by each experiment differently, relying on the strengths of its own detector: ATLAS requires 4 units of rapidity gap for single diffractive events and 3 units for double diffractive events within the detector acceptance, TOTEM uses separately the information on T1 and T2 to select low and high mass events while CMS requires no activity with either or . Several experiments have measured the cross section values of for different intervals of the hadronic mass, Table 3. ATLAS has reported the fraction of events with a rapidity gap in the interval to be = 10% Aad:2011eu .
| Experiment | Energy | Mass | |
|---|---|---|---|
| [TeV] | [GeV] | [mb] | |
| TOTEM | 7 | 3.4 - 1100 | 6.5 1.3 |
| (preliminary) | |||
| CMS | 7 | 12 - 394 | 4.27 0.04 (sta) (sys) |
| ALICE | 2.76 | 0 - 200 | 12.2 |
| ALICE | 7 | 0 - 200 | 14.9 |
XI Discussion of the results
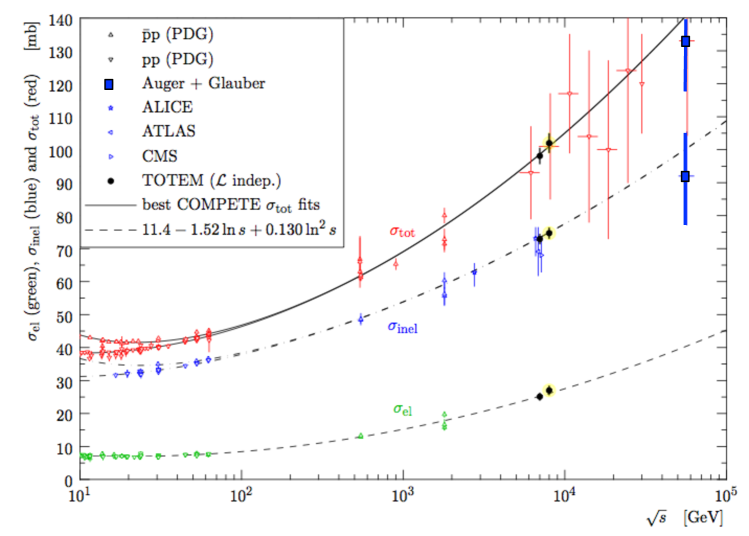
Figure 27 shows a compilation of the values of and as a function of . The plot includes the results obtained by the TOTEM collaboration, together with the results from LHC, lower energy experiments and the best fit from the COMPETE collaboration based on a behaviour of the cross section.
Several groups, for example GLM Gotsman:2010nw Gotsman:2012rq (E. Gotsman, E. Levin and U. Maor), Durham Ryskin:2011qe Martin:2011gi (M. G. Ryskin, A. D. Martin and V. A. Khoze), Ostapchenko Ostapchenko:2010vb , KP Kaidalov:2009aw (A. B. Kaidalov and M. G. Poghosyan) and DL Donnachie:2011aa )(A. Donnachie and P. V. Landshof), that have proposed in the past models for soft interactions based on Pomeron exchanges have now included in their analyses the LHC results. Some of them, such as Ostapchenko and DL, propose to use a soft and a hard pomeron, while other groups (GLM, Durham, KP) are using a single pomeron. A summary of the results is shown in Tab 4 (based on Gotsman:lishep ).
| DL | Ost. | GLM | Durham | KP | |
|---|---|---|---|---|---|
| 0.09 | 0.14 | ||||
| 0.25 | 0.14 | ||||
| 0.36 | 0.31 | ||||
| 0.1 | 0.85 | ||||
| 0.23 | 0.14 | 0.12 | |||
| 0.028 | 0.1 | 0.22 |
Bloch and Halzen Block:2012ym , updating their analyses to include the LHC results, have proposed a parametrization in the form of equation 6 for both the total and inelastic cross section:
| (13) | |||
| (14) |
It’s worth stressing that the results of LHC had a strong impact on all models, showing that is quite difficult to extrapolate from lower to higher energy.
According to Cudell:2009bx , a value = 120 - 160 mb is a clear sign of the two-pomeron model while a value around 110 mb is an indication of the behaviour.
XI.1 Diffractive cross section,
Figure 28 shows the experimental values and the predictions from some theoretical models of as a function of .
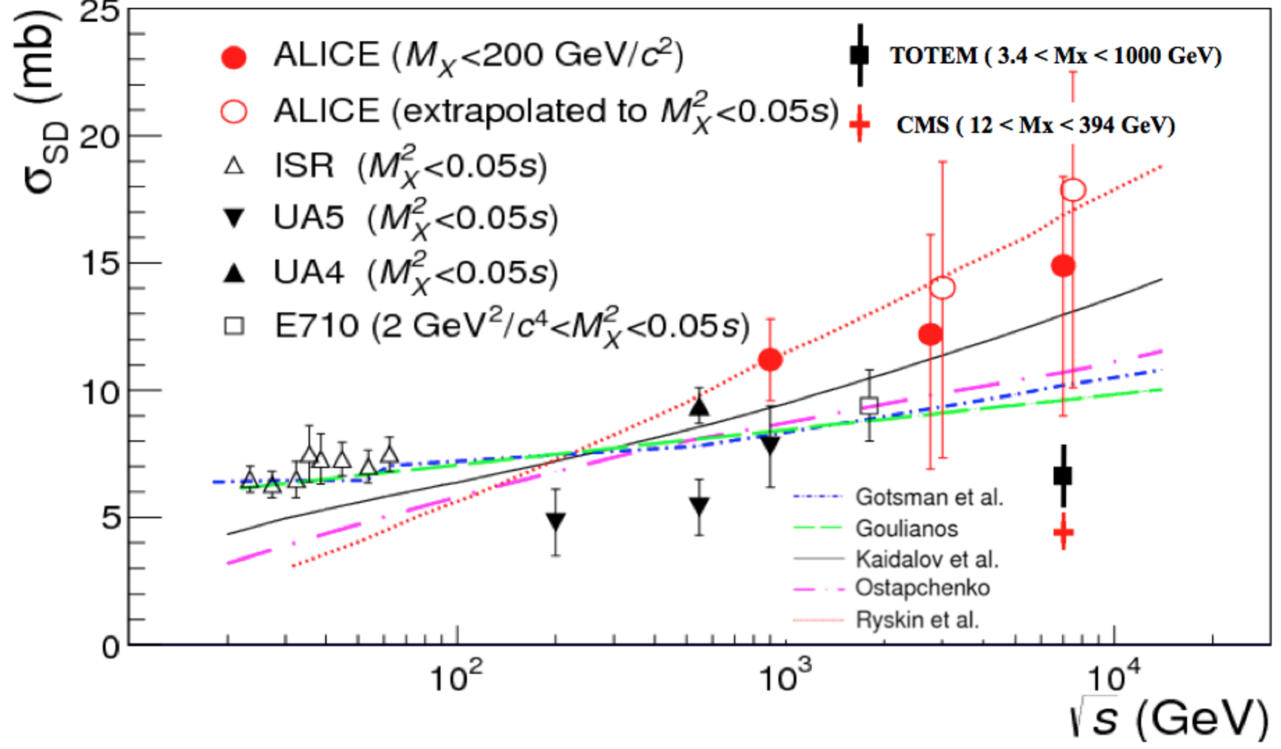
The experimental values of are listed in Table 3. The results from TOTEM and CMS have not been extrapolated outside the measured range and therefore have smaller errors than the values reported by ALICE. An extrapolation of the CMS and TOTEM results to the range ( GeV) yields a value of 9-11 mb, compatible with several of the proposed models. It’s interesting to note that even though the ALICE results seem to favour a higher value of , given the large experimental errors, all experimental points are compatible.
Table 5 lists the predictions of several groups for the single and double diffractive cross section values at TeV.
| GLM1 | GLM2 | Durham (07) | Durham (11) | Ost | |
|---|---|---|---|---|---|
| 10.8 | 13.7 | 13.3 | 17.6-18.8 | 11 | |
| 6.5 | 8.8 | 13.4 | 13.5 | 4.8 |
XII Comments on at 1.8 TeV: CDF, E710 and E811
Three experiments, E710 Amos:1989at , E811 Avila:1998ej and CDF Abe:1993xy , have measured the value of at 1.8 TeV obtaining the following results:
| (15) | |||
| (16) | |||
| (17) |
In pre-LHC, pre-HERA era, the value of the cross section measured by E811 was considered the most reliable. This can be seen for example in Figure 5 (top left pane) where the fit in the form of equation 4 goes through the experimental point of E811 while passing well underneath of the CDF measurement.
The introduction of the two-pomeron parametrization to accommodate the HERA data, shown in equation 10, produced a higher fit, closer to the value measured by CDF, Figure 29.
The most recent fits of the COMPETE collaboration, see Figure 27, are also closer to the CDF value, indicating a growing consensus of considering this point more accurate.
XIII Conclusions
The concurrent efforts of several cosmic-rays and collider experiments have provided in the last couple of years a large quantity of measurements of the values of the total, elastic and inelastic cross sections as well as the values of cross sections for particular final state. The total value of the cross section is well reproduced by the prediction of the COMPETE collaboration showing that a dependence of provide a good tool for extrapolating to higher energies. Several groups, using single or double pomeron models, have updated their analyses using the new LHC data and also obtain good fits to the data.
Common MC models used in collider experiments fail to concurrently reproduce the new measurements, pointing to an underestimation of the amount of low mass events.
References
- (1) T Regge, Il Nuovo Cimento, 14 (1959) 951; G F Chew and S C Frautschi, Physical Review Letters 8 (1962) 41.
- (2) S. Donnachie et al, “Pomeron Physics and QCD”, Cambridge Monographs on Particle Physics, Nuclear Physics and Cosmology (No. 19), July 2005.
- (3) B. Nicolescu et al. [COMPETE Collaboration], “Analytic parametrizations of the nonperturbative pomeron and QCD inspired models,” hep-ph/0110170.
- (4) J. R. Cudell et al. [COMPETE Collaboration], “New measures of the quality of fits applied to forward hadronic data at t = 0,” hep-ph/0111025.
- (5) P. V. Landshoff, “The Total cross-section at the LHC,” Acta Phys. Polon. B 39, 2063 (2008)
- (6) J. R. Cudell, “The Total Cross Section at the LHC: Models and Experimental Consequences,” arXiv:0911.3508 [hep-ph].
-
(7)
M. M. Islam et al, “Proton structure from high energy proton-proton and antiproton-proton elastic scattering”,
www.slac.stanford.edu/econf/C111215/papers/islam.pdf - (8) B. Kopeliovich, B. Povh and I. Potashnikova, “Deep inelastic electroproduction of neutrons in the proton fragmentation region,” Z. Phys. C 73 (1996) 125
- (9) J. D. Bjorken, Phys. Rev D47 (1992) 101.
- (10) G. Antchev et al. [TOTEM Collaboration], “Measurement of proton-proton elastic scattering and total cross-section at = 7 TeV,” Europhys. Lett. 101, 21002 (2013).
- (11) J. R. Cudell et al. [COMPETE Collaboration], “Benchmarks for the forward observables at RHIC, the Tevatron Run II and the LHC,” Phys. Rev. Lett. 89, 201801 (2002)
- (12) G. Antchev et al. [The TOTEM Collaboration], “Luminosity-independent measurements of total, elastic and inelastic cross-sections at = 7 TeV,” Europhys. Lett. 101, 21004 (2013).
- (13) P. Abreu et al. [Pierre Auger Collaboration], “Measurement of the proton-air cross-section at TeV” Phys. Rev. Lett. 109, 062002 (2012)
- (14) R. Ulrich, J. Blumer, R. Engel, F. Schussler and M. Unger, On the measurement of the proton-air cross section using air shower data, New J. Phys. 11 (2009) 065018
- (15) Mirki Berretti, “Cross sections and forward multiplicities measurements with TOTEM”, DIS2013 Conference, http://dis2013.in2p3.fr/
- (16) P. Shukla, “Glauber model for heavy ion collisions,” nucl-th/0112039.
- (17) S. Chatrchyan et al. [CMS Collaboration], “Measurement of the inelastic proton-proton cross section at TeV,” Phys. Lett. B 722 (2013) 5
- (18) Jan Fiete Grosse-Oetringhaus, ISVHECRI 2012, Berlin, 2012.
- (19) N. A. Amos et al. [E710 Collaboration], “Measurement of the Total Cross-Section at = 1.8-TeV,” Phys. Rev. Lett. 68 (1992) 2433.
- (20) C. Avila et al. [E811 Collaboration], ‘A Measurement of the proton-antiproton total cross-section at = 1.8-TeV,” Phys. Lett. B 537, 41 (2002).
- (21) F. Abe et al. [CDF Collaboration], “Measurement of the total cross-section at GeV and 1800-GeV,” Phys. Rev. D 50, 5550 (1994).
- (22) DIS2013 Conference, http://dis2013.in2p3.fr/
- (23) G. Antchev et al. [The TOTEM Collaboration], “Measurement of proton-proton inelastic scattering cross-section at = 7-TeV,” Europhys. Lett. 101, 21003 (2013).
- (24) B. Abelev et al. [ALICE Collaboration], “Measurement of inelastic, single- and double-diffraction cross sections in proton–proton collisions at the LHC with ALICE,” Submitted to: Eur. Phys. J. C [arXiv:1208.4968 [hep-ex]].
- (25) G. Aad et al. [ATLAS Collaboration], “Measurement of the Inelastic Proton-Proton Cross-Section at TeV with the ATLAS Detector,” Nature Commun. 2, 463 (2011)
- (26) E. Gotsman, E. Levin and U. Maor, “N=4 SYM and QCD motivated approach to soft interactions at high energies,” Eur. Phys. J. C 71 (2011) 1553
- (27) E. Gotsman, E. Levin and U. Maor, “Soft interaction model and the LHC data,” Phys. Rev. D 85 (2012) 094007
- (28) M. G. Ryskin, A. D. Martin and V. A. Khoze, “High-energy strong interactions: from ‘hard’ to ‘soft’,” Eur. Phys. J. C 71, 1617 (2011)
- (29) A. D. Martin, M. G. Ryskin and V. A. Khoze, “From hard to soft high-energy pp interactions,” arXiv:1110.1973 [hep-ph].
- (30) S. Ostapchenko, “Monte Carlo treatment of hadronic interactions in enhanced Pomeron scheme: I. QGSJET-II model,” Phys. Rev. D 83 (2011) 014018
- (31) A. B. Kaidalov and M. G. Poghosyan, “Description of soft diffraction in the framework of reggeon calculus: Predictions for LHC,” arXiv:0909.5156 [hep-ph].
- (32) A. Donnachie and P. V. Landshoff, “Elastic Scattering at the LHC,” arXiv:1112.2485 [hep-ph].
- (33) E. Gotsman, “Amplitudes and Cross Sections at the LHC,” contribution to LISHEP 2013.
- (34) M. M. Block and F. Halzen, “Forward hadronic scattering at 8 TeV: predictions for the LHC,” Phys. Rev. D 86 (2012) 014006