UPDATED LIMITS ON DIFFUSE FLUXES OF
COSMIC NEUTRINOS WITH 2008-2011 ANTARES DATA
The ANTARES neutrino telescope detects the Cherenkov radiation emitted along the path of charged particles produced in neutrino interactions. ANTARES is sensitive to all flavors even though it is optimized for muon neutrinos. Several algorithms estimating the deposited energy in the active volume of the detector have been developed and applied to the reconstruction of the primary neutrino energy – this allows to improve the search for a diffuse flux of astrophysical neutrinos. The search for a diffuse flux of cosmic neutrinos at very high energies (E TeV) is updated using 4 years of data with the full detector.
1 ANTARES and Diffuse Cosmic Neutrinos
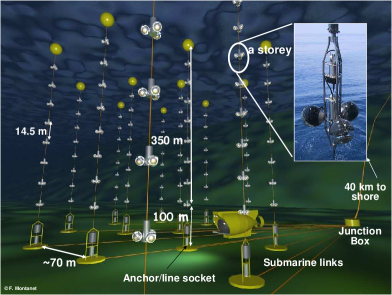
The ANTARES neutrino telescope is taking data in its final configuration since 2008, see Fig. 1 (left). The main physics subject is the search for cosmic sources of neutrinos, even though several results have been obtained in other topics, e.g. neutrino oscillations, searches for dark matter and exotics (monopoles, nuclearites), oceanography and marine biology .
An update of the analysis on the search for a diffuse flux of cosmic neutrinos with two years of data is presented. Two years more of data are added to the measurement. In the meanwhile, our knowledge of the detector has improved and better Monte Carlo (MC) simulations have been made available, allowing to use a larger data fraction for analyses, with less requirements on the data quality. The equivalent live-time is 885 days now, about a factor three larger than for previous analysis.
An isotropic diffuse flux of neutrinos generated by extragalactic sources in the Universe is expected. Atmospheric neutrinos with an energy spectrum represent an irreducible background in the search for a diffuse flux of cosmic and the signal might be seen as an excess in the high energy region of the spectrum. A harder spectrum, proportional to E-2, is expected for of astrophysical origin; above an unknown value of the critical energy E (which depends on the absolute normalization of the cosmic flux) astrophysical neutrinos should exceed those of atmospheric origin. The discrimination can be done on the basis of the visible energy of muons generated by neutrinos. In the following we refer to and as “muon neutrinos”, because the sign of the charged muon is indistinguishable.
IceCube results on the search for diffuse neutrinos using IC59 data show no significant excess with respect to the background expectations, hence an upper limit at 90% confidence level was derived:
| (1) |
The IC59 sensitivity to diffuse fluxes is a factor two lower than the limit. Even if this result is statistically compatible with zero at 1.8 , there is a soft indication of the presence of high energy astrophysical neutrinos.
A test signal with a flux proportional to E-2 and normalized at
| (2) |
is used in this analysis. The normalization is arbitrary and does not affect the result of the following cut optimization. The entire procedure and the optimization of all the cuts was done using only the 10% of available data (blind analysis) and the full MC set, in order to avoid any bias.
Down-going atmospheric muons reconstructed as up-going can mimic high-energy neutrino induced muons. In fact, atmospheric muons reach the detector in “bundles” of particles with a large multiplicity. The main effect is the production of a large amount of hits on the PhotoMultiplier Tubes (PMTs) – the signature of high energy events. A cut on the quality of reconstructed tracks is defined to keep under control the atmospheric muon background.
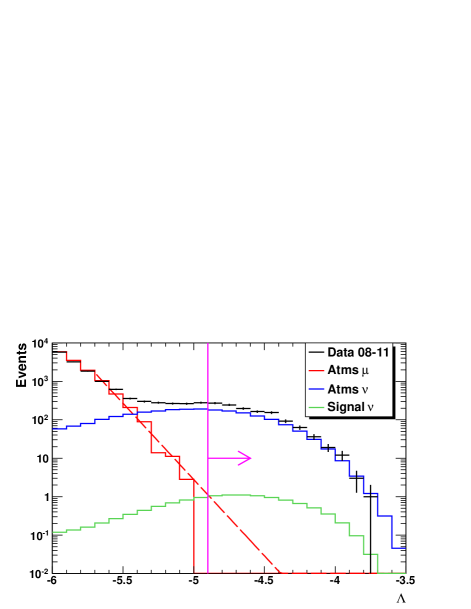
The algorithm that reconstructs the muon direction uses as input the time and position information of hits produced by the photons recorded by the PMTs, and gives as output the direction of the muon (zenith and azimuth), a quality parameter (), the estimation of the angular resolution (), and the number of hits correlated with the track (). An a priori cut on the reconstructed zenith angle is applied (). A combined cut on the three parameters given by the reconstruction algorithm (, , ) has been optimized to reduce the muon background maximizing the total number of signal events.
First level cuts are defined as the combination of:
| (3) |
Due to the reduced statistics in the muon MC sample (one third of the equivalent live-time in data) the cut on is adjusted according to the fit shown in Fig. 1 (right). The first level cuts allow to reduce the muon background at the level of 1.3 event (885 days).
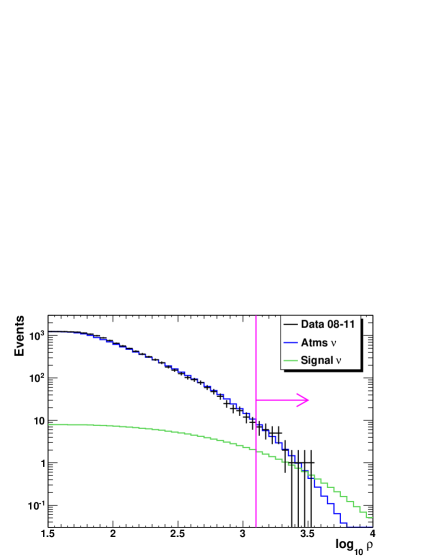
After the cuts of eq. 3 the prevailing background for cosmic neutrinos is due to atmospheric neutrinos, which are expected to dominate below the critical energy E. The neutrino energy cannot be directly measured and the neutrino induced muons are observed in a limited interval of their range, due to the limited size of ANTARES. An estimate of the muon energy can be done through the measurement of some observables related with the muon energy loss in water. In fact, at energies higher than GeV, the energy loss is proportional to the energy of the muon. An energy estimator , , is defined through an approximation of the total muon energy deposited in the detector along its path, , and it is a function of the total number of photoelectrons recorded by PMTs (), the reconstructed muon direction (), the geometrical track length within the sensitive volume (), and the detector efficiency ().
The atmospheric neutrinos are simulated according to the conventional “Bartol” flux , while the signal is taken assuming the flux of eq. 2. The inverse cumulative distributions of expected neutrinos as a function of is shown in Fig. 2 (left). The energy estimator is used in the Model Rejection Factor (MRF) procedure to define the cut which gives the best sensitivity. The MRF as a function of was computed through pseudo-experiments using the Feldman&Cousins statistics at 90% confidence level. The minimum occurs selecting events with and corresponds to a sensitivity:
| (4) |
2 Results
Applying the first level cuts to the data sample, the conventional atmospheric neutrinos from MC simulations show a 27% deficit with respect to the observed data events. This is well within the systematic uncertainties on the theoretical expectation at these energies; the background is then normalized to the data. After normalization, 7.9 atmospheric events are expected for , and 1.8 signal events from the test flux (eq. 2).
After unblinding the high energy region, 7 neutrino events are found in the full data sample. Fig. 2 (left) shows the inverse cumulative distribution as a function of the energy estimator for data and MC. The pink line at shows the cut value which minimizes the MRF.
The effects of systematics is considered in the calculation of the upper limit. The evaluation of the systematic errors on the background is taken from the normalization factor applied to Monte Carlo, giving a effect on the predicted 7.9 events. This factor includes the systematics about the knowledge of the detector plus theoretical uncertainties on the conventional neutrino flux. Concerning the signal, an assumption is done on the flux shape and the absolute normalization does not influence the resulting upper limit. The variation in the number of expected signal events depends on the detector efficiencies only. Some critical parameters were changed in the MC simulations to evaluate the signal expectations: absorption length of light in water (), PMT quantum efficiency (), PMT angular acceptance. The effect of the systematic uncertainties is to change the expected 1.8 signal events by .
Using the method described in Conrad et al. , the upper limit at 90% confidence level is:
| (5) |
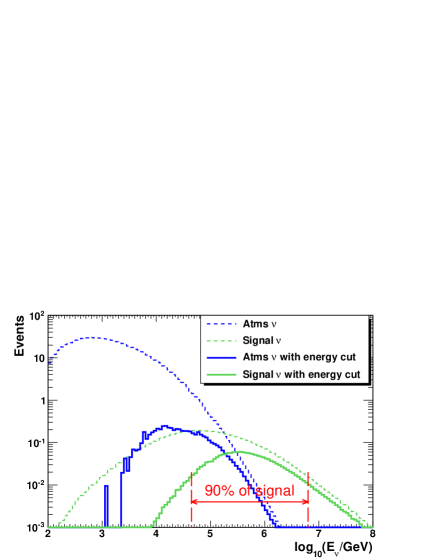
The central 90% of the signal is found in the neutrino energy range from 45 TeV to 6.3 PeV – see Fig. 2 (right). The interval is the region containing 90% of the signal from MC simulations.

3 Conclusions
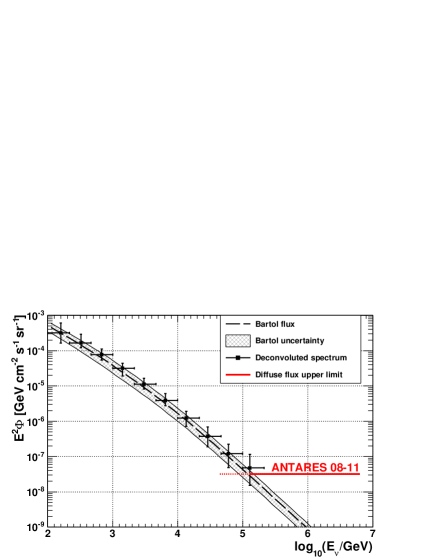
ANTARES data taken in the years 2008-2011 were analyzed to search for a diffuse cosmic neutrino signal. The whole period corresponds to 855 days of equivalent live-time. Using an estimator of the muon energy loss in sea water, no excess of events is found with respect to the atmospheric neutrino flux hence an upper limit at 90% c.l. is obtained. This result is compared with other experiments and theoretical expectations in Fig. 3 (left) – see for references. The same data set was analyzed to unfold the atmospheric neutrino energy spectrum ; Fig. 3 (right) shows the combination of both results together with the conventional Bartol flux.
References
References
- [1] M. Ageron et al., Nucl. Instrum. Methods A 656, 11-38 (2011).
- [2] S. Mangano, these proceedings.
- [3] J.A. Aguilar et al., Phys. Lett. B 696, 16-22 (2011).
- [4] G. Sullivan, arXiv: 1210.4195 [astro-ph.HE].
- [5] S. Adrián-Martínez et al., Astrophys. J. 760, 53 (2012).
- [6] F. Schüssler, Proceedings for the 2013 ICRC, ID 421 (2013).
- [7] V. Agrawal et al., Phys. Rev. D 53, 1314-1323 (1996).
- [8] G.C. Hill and K. Rawlins, Astropart. Phys. 19, 393-402 (2003).
- [9] G.J. Feldman and R.D. Cousins, Phys. Rev. D 57, 3873-3889 (1998).
- [10] J. Conrad et al., Phys. Rev. D 67, 012002 (2003).
- [11] L.A. Fusco, Proceedings for the 2013 ICRC, ID 636 (2013).