Supernova Ejecta in the Youngest Galactic Supernova Remnant G1.9+0.3
Abstract
G1.9+0.3 is the youngest known Galactic supernova remnant (SNR), with an estimated supernova (SN) explosion date of , and most likely located near the Galactic Center. Only the outermost ejecta layers with free-expansion velocities km s-1 have been shocked so far in this dynamically young, likely Type Ia SNR. A long (980 ks) Chandra observation in 2011 allowed spatially-resolved spectroscopy of heavy-element ejecta. We denoised Chandra data with the spatio-spectral method of Krishnamurthy et al., and used a wavelet-based technique to spatially localize thermal emission produced by intermediate-mass elements (IMEs: Si and S) and iron. The spatial distribution of both IMEs and Fe is extremely asymmetric, with the strongest ejecta emission in the northern rim. Fe K emission is particularly prominent there, and fits with thermal models indicate strongly oversolar Fe abundances. In a localized, outlying region in the northern rim, IMEs are less abundant than Fe, indicating that undiluted Fe-group elements (including 56Ni) with velocities km s-1 were ejected by this SN. But in the inner west rim, we find Si- and S-rich ejecta without any traces of Fe, so high-velocity products of O-burning were also ejected. G1.9+0.3 appears similar to energetic Type Ia SNe such as SN 2010jn where iron-group elements at such high free-expansion velocities have been recently detected. The pronounced asymmetry in the ejecta distribution and abundance inhomogeneities are best explained by a strongly asymmetric SN explosion, similar to those produced in some recent 3D delayed-detonation Type Ia models.
Subject headings:
ISM: individual objects (G1.9+0.3) — ISM: supernova remnants — nuclear reactions, nucleosynthesis, abundances — X-rays: ISM1. Introduction
G1.9+0.3 (catalog ) is the youngest known Galactic supernova remnant (SNR) (Reynolds et al., 2008, Paper I; Green et al., 2008, Paper II), with an estimated supernova (SN) explosion date of , most likely located near the Galactic center at a distance of 8.5 kpc. Its spectrum is dominated by nonthermal continuum well described by synchrotron emission from a power-law electron distribution with an exponential cutoff (Paper I; Reynolds et al., 2009, Paper III). Our 237-ks Chandra observation in July 2009 showed conclusively thermal emission from ejecta from the north rim (near the radio, but not the X-ray, maximum), with strong line emission from intermediate-mass elements (IMEs) such as Si and S, as well as from Fe (Borkowski et al., 2010, Paper IV). In addition, we found evidence for emission from 44Sc, produced by the radioactive decay of 44Ti.
Only the outermost ejecta layers with free-expansion velocities in excess of 18,000 km s-1 have been shocked so far in this very dynamically-young SNR (Carlton et al., 2011, Paper V). The presence of Fe at such high velocities is surprising, since few SNe show such high-velocity Fe (or 56Ni). The spatial distribution, abundances, and physical properties of ejecta are key for understanding the explosion mechanism in this likely Type Ia SNR. Chandra observed G1.9+0.3 (catalog ) for nearly 1 Ms in 2011, which clarified the 44Sc detection (spectrum of the interior is shown in Borkowski et al., 2013) and provided detailed images and spectra. Here we report spatially-resolved spectroscopy of SN ejecta, and interpret the results in the framework of an energetic and asymmetric Type Ia explosion.
2. Observations
Chandra observed G1.9+0.3 (catalog ) in 2011 May and July (see Table 1). The ACIS S3 chip was used in Very Faint mode. Data reduction and spectral extraction were done with CIAO v4.5 and CALDBv4.5.1. No significant particle flares were found. The total duration was 977 ks.
| Date | Observation ID | Roll Angle | Effective exposure time |
|---|---|---|---|
| (deg) | (ks) | ||
| 09–11 May | 12691 | 79 | 184 |
| 12–14 May | 12692 | 79 | 162 |
| 16–17 May | 12690 | 79 | 48 |
| 18–19 May | 12693 | 79 | 127 |
| 20–22 May | 12694 | 79 | 158 |
| 23 May | 12695 | 79 | 39 |
| 14–16 July | 12689 | 277 | 156 |
| 18 July | 13407 | 277 | 48 |
| 22–23 July | 13509 | 277 | 55 |
In order to examine spatial structures in spectral lines and continua, data cubes, in size, were extracted from merged event files. The spatial scale is one ACIS pixel (), while spectral channels from 84 to 595 were binned by a factor of 2 (these correspond to the energy range of 1.2–8.7 keV, including almost all source photons). At the ACIS S3 spectral resolution, the binning introduces negligible spectral degradation above 1.2 keV.
X-ray spectra from various locations within the remnant were then extracted from each dataset listed in Table 1, and then summed. The spectral responses were averaged using effective exposure times as weights. The background was modeled rather than subtracted, by fitting the spatially-integrated spectrum of G1.9+0.3 (catalog ) together with a background spectrum. The X-ray analysis was performed with XSPEC v12.7.1 (Arnaud, 1996), using C-statistics (unless mentioned otherwise) and APEC NEI v2.0 atomic data augmented with inner-shell processes (Badenes et al., 2006). We also updated inner-shell atomic data for all ions of Si, S, Ar, and Ca with more than 3 electrons present. Relevant collisional excitation cross sections and inner-shell ionization cross sections by electrons were calculated with the Los Alamos Atomic Physics Codes111Access to these codes is provided at aphysics2.lanl.gov/tempweb/lanl/ (Mann, 1983; Clark et al., 1991). Line energies and branching ratios for radiative transitions are from Palmeri et al. (2008). Only strong resonance lines have been included.
3. Line Emission
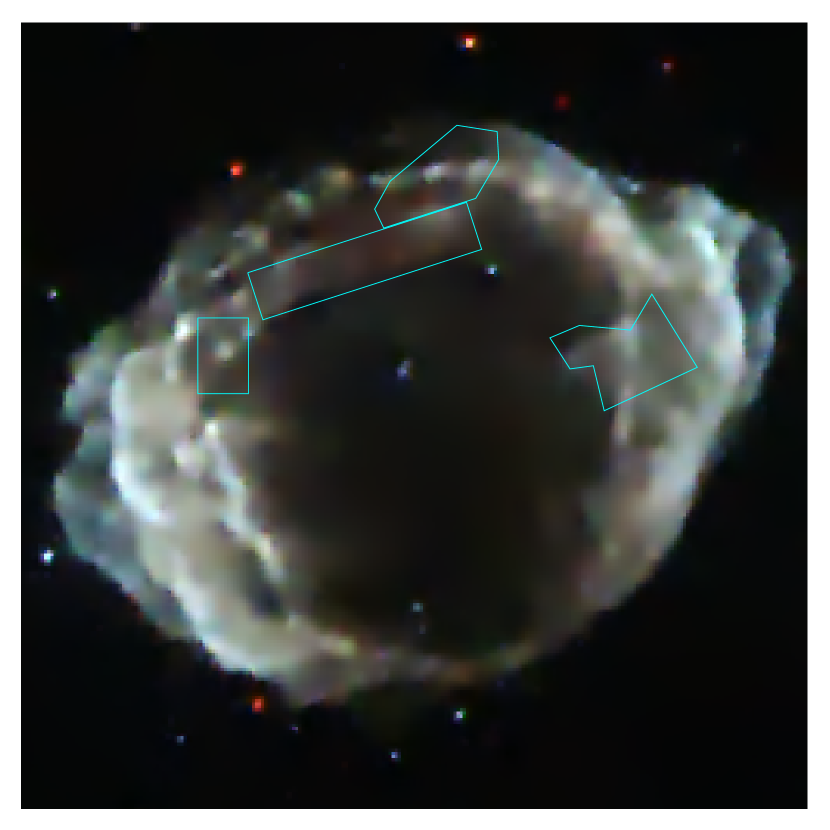
Previous Chandra observations of G1.9+0.3 (catalog ) revealed thermal emission lines from ejecta in the radio-bright northern rim (Paper IV), but poor photon statistics precluded a search for spatial variations in composition. We searched for variations in the line emission within the 2011 May Chandra data cube. First, this cube was denoised using the spectro-spatial method of Krishnamurthy et al. (2010). Smoothed images at low, medium, and high energies were extracted from a more heavily denoised data cube containing all 2011 observations, and combined into a color image (Figure 1). Spectral variations are apparent, with the bright E and W lobes noticeably harder than the much fainter S and N rims, confirming azimuthal variations in the synchrotron spectra (Paper III).
In our search for spectral lines within this cube, we used a continuous wavelet transform method to spatially localize ejecta emission. We use the package MassSpecWavelet developed by Du et al. (2006) for mass-spectrometry data. We concentrated on Si, S, and Fe, the most abundant ejecta elements whose lines are prominent in young Type Ia SNRs, and which are also present in the large radio-bright N region of Paper IV. (We do not confirm the presence of Ca and Sc there, and a very weak Ar line is not statistically significant.) For the Fe K line, we considered all possible emission line candidates identified by MassSpecWavelet in a relatively broad (6.12–6.76 keV) energy range near 6.4 keV in order to allow for potentially large Doppler shifts. For Si and S K lines, our chosen energy ranges were 1.65–1.97 keV and 2.15–2.53 keV, respectively. In order to reduce the effects of noise, maps of estimated line strengths were examined for spatially contiguous regions of potential line emission. (In synchrotron-dominated SNRs where thermal and nonthermal emission is poorly correlated, this procedure could result in regions not obviously corresponding to spatial structures visible in broad-band images.) For these regions, we then extracted and combined X-ray spectra from all 2011 observations. Here we discuss only selected regions with unambiguous line emission present, likely having highest density and shocked ejecta mass.
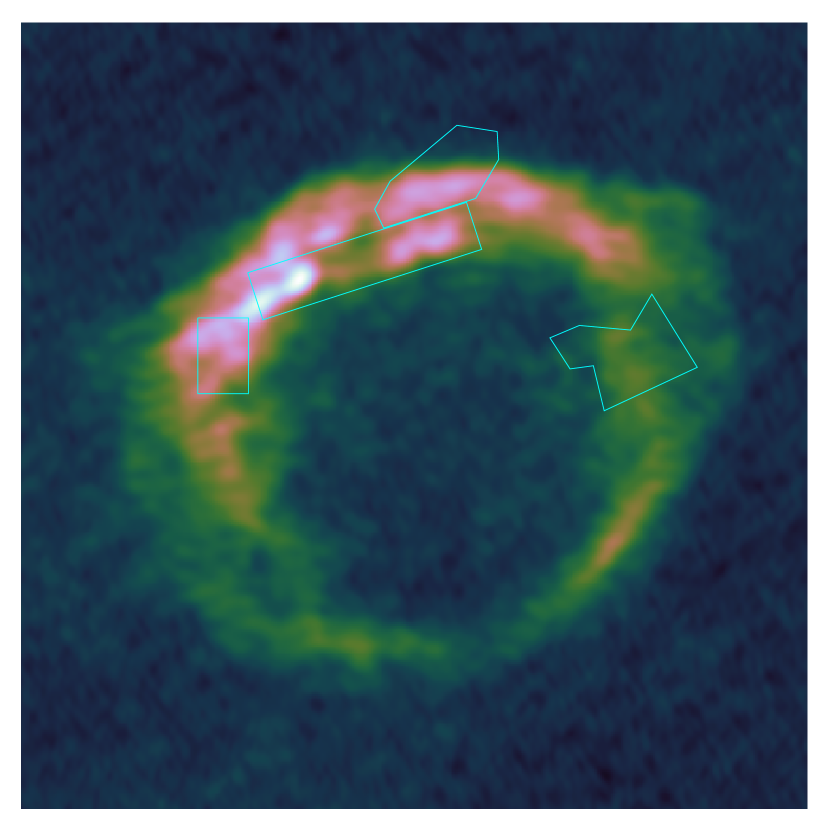
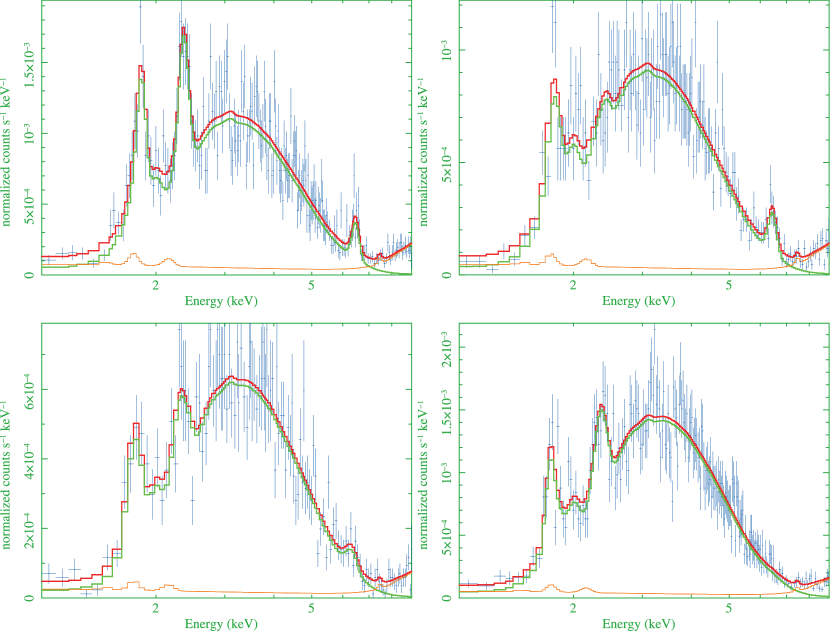
We identified 4 regions where either strong Fe K line and/or both Si and S K lines are present (see Figures 1 and 2). Three regions mostly overlap with the northern rim prominent in radio: inner and outer northern rims, and a smaller northeastern region. This confirms that most ejecta emission is associated with the radio-bright N rim. The fourth region in the west overlaps with the innermost X-ray and radio emission in this part of the remnant, demonstrating that ejecta emission is present elsewhere than just the northern rim. X-ray spectra are shown in Figure 3, with simple fits consisting of absorbed power-law continua and Gaussian lines (see Table 2 for fitted parameter values). All lines are broad (FWHM km s-1; we assumed the same Doppler width for the IMEs and Fe). Variations in X-ray spectra are apparent: Fe K is prominent in the northern rim regions, but not in the western rim where only Si and S lines are present. The outer northern rim exhibits strong Fe emission, but Si is weak and S is missing. Both Fe and the IMEs (Si + S) are present in the two remaining regions in the north, and are particularly strong in the inner northern rim.
| Region | aaPower-law photon index | bbAbsorbed continuum flux in the 1–9 keV energy range | FWHM | Silicon | Sulfur | Iron | |
|---|---|---|---|---|---|---|---|
| ( cm-2) | ( ergs cm-2 s-1) | ( km s-1) | Line energies (keV) and strengths ( ph cm-2 s-1) | ||||
| Outer north rim | 8.1 | 2.95 | 5.20 | 1.5 | 1.756 | 6.452 | |
| (7.2, 9.0) | (2.64, 3.27) | (4.88, 5.54) | (0.75, 2.5) | (1.711, 1.792) | (6.389, 6.518) | ||
| 0.72 | 4.4 | ||||||
| (0.32, 1.17) | (2.8, 6.3) | ||||||
| Inner north rim | 8.3 | 2.94 | 6.28 | 1.2 | 1.822 | 2.349 | 6.475 |
| (7.4, 9.2) | (2.66, 3.25) | (5.92, 6.65) | (0.81, 1.8) | (1.796, 1.849) | (2.327, 2.369) | (6.429, 6.523) | |
| 1.7 | 3.8 | 5.5 | |||||
| (1.1, 2.3) | (2.8, 4.9) | (3.9, 7.3) | |||||
| Inner NE rim | 9.0 | 2.96 | 3.79 | 2.1 | 1.72 | 2.27 | 6.33 |
| (7.7, 14) | (2.55, 4.27) | (3.14, 4.11) | (0.57, 6.2) | (1.56, 1.78) | (2.06, 2.34) | (5.98, 6.50) | |
| 0.65 | 1.1 | 1.6 | |||||
| (0.23, 1.7) | (0.38, 3.0) | (0.55, 4.9) | |||||
| Inner west rim | 8.5 | 2.68 | 9.55 | 1.6 | 1.738 | 2.331 | |
| (7.8, 9.4) | (2.46, 2.91) | (9.15, 9.98) | (0.56, 2.7) | (1.711, 1.762) | (2.294, 2.369) | ||
| 1.4 | 2.8 | ||||||
| (0.84, 1.9) | (1.7, 4.0) | ||||||
Note. — Line energies (strengths) are in rows 1, 5, 9, and 13 (3, 7, 11, and 15), with 90% confidence limits listed in adjacent rows.
Based on line identifications from the Gaussian fits, we fit vpshock models with variable abundances as given in Table 2. Here we focus on the inner northern rim which has the richest line emission. An absorbed vpshock fit to its spectrum gives, with 90% confidence intervals, a hydrogen column density cm-2, plasma temperature of keV, ionization age cm-3 s, and the following abundances relative to solar values of Grevesse & Sauval (1998): for Si, for S, and for Fe. Lines are Doppler-broadened (FWHM km s-1) and blueshifted with a velocity of km s-1. Ejecta are blueshifted at a high confidence level of 98.0%. In this fit, we used Markov chain Monte Carlo (MCMC) methods (with uniform priors) instead of relying on C-statistics. Unlike the latter, estimated parameter values and their errors obtained with MCMC methods do not suffer systematic biases, and are more reliable. In particular, comparison with the FWHM value of 12,000 (8100, 18,000) km s-1 for the inner N rim from Table 2 suggests that some (or all) line widths listed there slightly underestimate true line widths.
The NE rim spectrum is similar to the inner N rim spectrum, with best-fit values of cm-2, keV, cm-3 s, Si = S , Fe . Lines might be redshifted by km s-1 and broad (FWHM km s-1). While the fitted temperatures and ionization ages for the N and NE rims are similar, the relative velocity inferred from the fits is 6900 km -1, and such high velocity is supported by the large line broadenings required for both regions. We can thereby infer that the systematic line shifts for various regions seen in Table 2 are mostly caused by bulk motions, though ionization effects may still play a role.
In the vpshock fit to the inner N rim spectrum, the X-ray continuum is produced by free-free emission on protons and particles, and we set the abundances of Ar and Ca equal to S. Strongly oversolar abundances of Si, S, and Fe confirm that emission lines are produced by SN ejecta. Mass emission measures (EMs) are cm-3 for the IMEs, and cm-3 for Fe. The total mass EM is equal to 0.22 cm-3 , and with cm-3, the inferred shocked mass is 0.14 , several times larger than the spatially-integrated shocked ejecta mass of 0.033 (derived from the overall remnant’s dynamics, and assuming a standard Type Ia explosion; Paper V, see also Section 4). This discrepancy suggests that the assumption that the continuum is thermal is incorrect; given a nonthermal continuum, it is likely that pure heavy-element ejecta, without any H or He, produce the lines seen in Figure 3. This makes Si, S, and Fe EMs somewhat uncertain, particularly for Fe if plasma temperatures are significantly higher than 3.2 keV. As an example, a fit to the inner N rim with a power-law model and a plane shock model with an assumed temperature of 10 keV and without any H or He gives EMs of cm-3 for the IMEs, and cm-3 for Fe. A similar fit to the outer N rim spectrum gives cm-3 for Si and cm-3 for Fe. In the W rim, cm-3 , with cm-3 s and velocity of km s-1. Since the upper bound of cm-3 s on is less than our best estimate of ionization age in the inner N rim, ejecta densities likely decrease from N to W, and then continue decreasing South where ejecta emission becomes much fainter.
4. High-velocity Fe-rich Ejecta
The presence of shocked heavy-element ejecta in G1.9+0.3 (catalog ) is surprising, since all ejecta that have been shocked so far were expelled by the SN with velocities exceeding km s-1 (Paper V). In particular, Fe (or 56Ni) is not commonly found at such high velocities in SN spectra, except for unusually energetic Type Ia SNe and rare core-collapse (CC) hypernovae. In G1.9+0.3 (catalog ), Fe is prominent only in the northern rim, not in the western rim where only Si and S lines have been detected, implying a strongly asymmetric SN explosion. There is no evidence for any jet-like features expected in jet-triggered energetic CC SNe, and other considerations (Paper I) also favor a Type Ia origin, so in the following discussion we focus on Type Ia explosions.
Studies of high-velocity Fe-group elements in Type Ia SN spectra are rare since they require frequent acquisition of optical and UV spectra soon after the SN explosion. The most detailed study so far is of a normal albeit bright Type Ia SN, SN 2010jn (Hachinger et al., 2013), with a broad light curve indicating substantial amounts of 56Ni. In their preferred SN model, Hachinger et al. (2013) found good agreement with observations only when they empirically adjusted abundances in the delayed detonation model WS15DD3 of Iwamoto et al. (1999). Fe-group elements are present even at velocities exceeding 30,000 km s-1; at 20,000 km s-1, the mass fraction of 56Ni and decay products is %, with an additional % of directly synthesized Fe present. No published Type Ia model has enough high-velocity Fe-group elements to account for their presence in SN 2010jn.
We can use the results of Hachinger et al. (2013) to estimate the mass and EM of shocked ejecta in G1.9+0.3 (catalog ). The density structure in the WS15DD3 model can be approximated well by an exponential ejecta model of Dwarkadas & Chevalier (1998) with the explosion energy (in units of ergs) of and the ejecta mass equal to the Chandrasekhar mass. The ejecta mass for free-expansion velocities larger than is equal to , where is the total ejecta mass and is the exponential velocity scale (). With and , km s-1 instead of km s-1 (for assumed ) in Paper V. By repeating their analysis for this more energetic SN model, we arrive at , km s-1, and amu cm-3 for ejecta entering the reverse shock in G1.9+0.3 (catalog ) at the present time. The total shocked ejecta mass is equal to 0.064 , nearly twice as large as 0.033 in the model of Paper V with . We estimated EMs at cm-3 , cm-3 , and cm-3 , using abundances of 15%, 3%, and 7% (by mass; Hachinger et al., 2013), respectively. These spatially-integrated EMs are comparable to the EMs we find in the inner northern rim (for a temperature of 10 keV), perhaps suggesting that ejecta there are several times denser than in the WS15DD3 model.
5. Discussion
Most Type Ia SN models lack the high-velocity Fe-group elements seen in SN 2010jn and G1.9+0.3 (catalog ). Meakin et al. (2009) report the presence of substantial (% by mass) amounts of 56Ni up to velocities of 18,500 km s-1 in their gravitationally confined detonation models. High-velocity (up to 18,000 km s-1) 56Ni is present in only one of a dozen 3D delayed-detonation models of Seitenzahl et al. (2013). In this model (N3), deflagrations were initiated in only 3 central locations within the white dwarf (WD), producing a strongly asymmetric and energetic explosion that synthesized nearly of 56Ni. All explosions with a small number of ignition kernels resulted in energetic explosions, but fast-moving ( km s-1) 56Ni is present only in models N3 and N5. In both models, part of a deflagration plume had already risen to the surface of the WD when the first delayed detonation occurred. The outermost deflagration ashes present within this plume were then accelerated to high velocities by the SN shock wave. G1.9+0.3 (catalog ) might have been produced by such an explosion. The strongly asymmetric distribution of Fe in G1.9+0.3 (catalog ) supports this hypothesis, since it is in qualitative agreement with the asymmetric distribution of 56Ni in the N3 model. (The absence of strong azimuthal variations in expansion rate (Paper V) disfavors an external density gradient as an alternative explanation.)
The ejecta emission in G1.9+0.3 (catalog ) appears stronger than expected in the heuristic SN 2010jn model of Hachinger et al. (2013). One weakness of that model is the assumption of spherical symmetry. The SN explosion could have been strongly asymmetric, as in the N3 model or in the gravitationally-confined detonation models of Meakin et al. (2009) where the density profiles are much steeper in the direction of the off-center detonation site than on the other side of the WD, leading to an order of magnitude variation in density of high-velocity ejecta. This could explain the lack of perfect agreement between predictions based on the heuristic model of Hachinger et al. (2013) for SN 2010jn and Chandra observations of G1.9+0.3 (catalog ). The heavy-element ejecta in the northern and western rims of G1.9+0.3 (catalog ) were probably several times denser than in the spherically-symmetric WS15DD3 model, perhaps because of their location opposite to the off-center detonation site.
The coincidence of the radio maximum with a region of substantial Fe suggests the possibility of a contribution to the radio flux from positrons from the decay of 56Co injected into the shock-acceleration process with initial energies of 1 MeV. 20% of 56Co decays produce a positron (Bé et al., 2006); the of initial 56Ni we infer from the inner N rim will eventually produce a total of positrons. However, those injected at early times will lose energy in the dense ejecta due to ionization losses; once thermalized, they will rapidly annihilate. Martin et al. (2010) estimate the slowing-down time for positrons emitted at time as yr, with in . Then positrons emitted earlier than given by will annihilate. For and , yr. Given the 111 d mean life of 56Co, an insignificant fraction of positrons is expected to survive to late times, unless they are accelerated first. The observed radio flux from the inner N rim is about 150 mJy at 1.4 GHz; assuming a spectral index of 0.62 (Paper III) and a power-law distribution of electrons down to a minimum Lorentz factor of 10, standard synchrotron formulae give
where nonlinear shock amplification would be required to reach magnetic field strengths of order 100 G. For this value, all positrons emitted after about 300 days would need to survive and be accelerated. This seems exceptionally unlikely. We conclude that decay positrons cannot account for the radio maximum in the N rim; further radio observations under way may cast light on this issue.
G1.9+0.3 (catalog ) offers us a unique view of the outermost, strongly asymmetric Fe-rich ejecta of a likely Type Ia SNR. Their spatial distribution should allow for distinguishing among various Type Ia explosion models. Energetic delayed-detonation models are promising candidates as they may account for both the observed asymmetry and the presence of high-velocity Fe. The delayed-detonation N3 model of Seitenzahl et al. (2013) produces asymmetric ejecta rich in Fe-group elements, although not at high enough free-expansion velocities. High-velocity radioactive 56Ni affects early-time Type Ia SN light curves (Piro, 2012; Piro & Nakar, 2013, 2012). Its highly asymmetric spatial distribution, as observed in G1.9+0.3 (catalog ) and obtained in recent 3D Type Ia simulations such as the N3 model, should be taken into account when interpreting light curves and spectra of Type Ia SNe. Future 3D hydrodynamical simulations of asymmetric Type Ia explosions, including additional delayed-detonation models, followed by modeling of their collision with the ambient ISM, would be most helpful for understanding the most recent known SN explosion in our Galaxy. Such strongly asymmetric explosions are expected to produce azimuthal variations in expansion rate that can be measured with future Chandra and VLA observations. In a broader context, studies of this and other young Type Ia SNRs that show large-scale asymmetries in their Fe-rich ejecta distribution (e.g., SN 1006 and Kepler’s SNR, Yamaguchi et al., 2008; Uchida et al., 2013; Burkey et al., 2013) are invaluable for understanding Type Ia explosions and their mysterious progenitors.
References
- Arnaud (1996) Arnaud, K. A. 1996, in Astronomical Data Analysis and Systems V, eds. G.Jacoby & J.Barnes, ASP Conf. Series, v.101, 17
- Badenes et al. (2006) Badenes, C., Borkowski, K. J., Hughes, J. P., et al. 2006, ApJ, 645, 1373
- Bé et al. (2006) Bé, M.-M., Chisté, V., Dulieu, C., et al. 2006, Table of Radionuclides, Monographie BIMP-5, Vol. 3 (Sèvres: Bureau International des Poids et Mesures), 11
- Borkowski et al. (2010, Paper IV) Borkowski, K. J., Reynolds, S. P., Green, D. A., et al. 2010, ApJ, 724, 161 (Paper IV)
- Borkowski et al. (2013) Borkowski, K. J., Reynolds, S. P., Green, D. A., et al. 2013, Proc. of the 13th HEAD meeting of the AAS
- Burkey et al. (2013) Burkey, M. T., Reynolds, S. P., Borkowski, K. J., et al. 2013, ApJ, 764. 63
- Carlton et al. (2011, Paper V) Carlton, A. K., Borkowski, K. J., Reynolds, S. P., et al. 2011, ApJ, 2011, 737, 22 (Paper V)
- Clark et al. (1991) Clark, R. E. H., Abdallah, J., Jr., & Mann, J. B. 1991, ApJ, 381, 597
- Du et al. (2006) Du, P., Kibbe, W. A., & Lin, S. M. 2006, Bioinformatics, 22, 2059
- Dwarkadas & Chevalier (1998) Dwarkadas, V. V., & Chevalier, R. A. 1998, ApJ, 497, 807
- Green et al. (2008, Paper II) Green, D. A., Reynolds, S. P., Borkowski, K. J., et al. 2008, MNRAS, 387, L54 (Paper II)
- Grevesse & Sauval (1998) Grevesse, N., & Sauval, A. J. 1998, Space Sci. Rev., 85, 161
- Hachinger et al. (2013) Hachinger, S., Mazzali, P. A., Sullivan, M., et al. 2013, MNRAS, 429, 2228
- Iwamoto et al. (1999) Iwamoto, K., Brachwitz, F., Nomoto, K., et al. 1999, ApJS, 125, 439
- Krishnamurthy et al. (2010) Krishnamurthy, K., Raginsky, M., & Willett, R. 2010, SIAM J. Imaging Sci., 3, 619
- Mann (1983) Mann, J. B. 1983, At. Dat. Nuc. Data Tables, 29, 407
- Martin et al. (2010) Martin, P., Vink, J., Jiraskova, S., et al. 2010, A&A, 519:A100
- Meakin et al. (2009) Meakin, C. A., Seitenzahl, I., Townsley, D., et al. 2009, ApJ, 693, 1188
- Piro (2012) Piro, A. L. 2012, ApJ, 759, 83
- Piro & Nakar (2013) Piro, A. L., & Nakar, E. 2013, ApJ, 769, 67
- Piro & Nakar (2012) Piro, A. L., & Nakar, E. 2012, preprint, arXiv:1211.6438
- Palmeri et al. (2008) Palmeri, P., Quinet, P., Mendoza, C., et al. 2008, ApJS, 177, 408
- Reynolds et al. (2008, Paper I) Reynolds, S. P., Borkowski, K. J., Green, D. A., et al. 2008, ApJ, 680, L41 (Paper I)
- Reynolds et al. (2009, Paper III) Reynolds, S. P., Borkowski, K. J., Green, D. A., et al. 2009, ApJ, 695, L149 (Paper III)
- Seitenzahl et al. (2013) Seitenzahl, I. R., Ciaraldi-Schoolmann, F., Röpke, F. K., et al. 2013, MNRAS, 429, 1156
- Uchida et al. (2013) Uchida, H., Yamaguchi, H., & Koyama, K. 2013, ApJ, in press
- Yamaguchi et al. (2008) Yamaguchi, H., Koyama, K., Katsuda, S., et al. 2008, PASJ, 60, 141