Discovery of twin kHz quasi-periodic oscillations in the low mass X–ray binary XTE J1701–407
Abstract
We report the discovery of kHz quasi-periodic oscillations (QPOs) in three Rossi X–ray Timing Explorer observations of the low mass X–ray binary (LMXB) XTE J1701–407. In one of the observations we detect a kHz QPO with a characteristic frequency of Hz, while in the other two observations we detect twin QPOs at characteristic frequencies of Hz, Hz and Hz, Hz. All detections happen when XTE J1701–407 was in its high intensity soft state, and their single trial significance are in the 3.1-7.5 range. The frequency difference in the centroid frequencies of the twin kHz QPOs ( Hz) is one of the largest seen till date. The 3–30 keV fractional rms amplitude of the upper kHz QPO varies between and . XTE J1701–407, with a persistent luminosity close to 1% of the Eddington limit, is among the small group of low luminosity kHz QPO sources and has the highest rms for the upper kHz QPO detected in any source. The X-ray spectral and variability characteristics of this source indicate its atoll source nature.
keywords:
stars: individual: XTE J1701–407 – stars: binaries – stars: neutron – X–rays: stars1 INTRODUCTION
Low mass X–ray binaries (LMXBs) can be divided into systems containing a black hole candidate (BHC) and those containing a neutron star (NS). The accretion properties of these systems can be studied through the timing and spectral properties of the X–ray emission (e.g., van der Klis, 1995a; Ford et al., 2000; Wijnands & Miller, 2002). On the basis of correlated variations in the X–ray colour–colour diagram (CD) and power density spectra (PDS), the NS LMXBs are classified as sources and sources (Hasinger & van der Klis, 1989). The sources are generally high luminosity sources (0.5–1.0 of Eddington luminosity ) while the atoll sources are low luminosity sources (0.01–0.5 ; see, e .g., van der Klis, 2006b, for a review, and Homan et al. 2010 for recent discoveries).
In the CD the atoll sources show three distinct states: the extreme island state (EIS), the island state (IS) and the banana state, the latter is further subdivided into the lower left banana (LLB), lower banana (LB) and the upper banana (UB). In Figure 1 we show the CD of the well known atoll source 4U 1608–52 (e.g., van Straaten et al., 2003), where all the different atoll spectral states are seen. Generally, as the source moves from the EIS to the UB through the IS, LLB and LB, the spectrum softens and the soft X-ray intensity increases (see, e.g., Di Salvo et al., 2003; Schnerr et al., 2003).
A number of quasi-periodic oscillations (QPOs) and broad-band variability components are often present simultaneously in the PDS of the X-ray light curves of these systems. The timing characteristics of these variability components are related to the spectral state of the source, i.e., to the position of the source in the CD. Generally, the characteristics of the timing features (i.e. frequency, quality factor and fractional rms amplitude) vary monotonically as the source moves along the atoll track. This behavior has been attributed to changes in the accretion rate (), the interaction of the matter in the accretion disk and the radiation emitted from the region close to the neutron star surface which affects the X–ray variability and spectrum (e.g., van der Klis, 2006a, for a review). QPOs can be seen with frequency between a few mHz to more than a kHz. Broad-band components are only seen up to 100–200 Hz. Weak band-limited noise is seen in the power spectra of atoll sources when they are in the banana state. This noise becomes stronger as the source spectrum hardens, i.e. as the source moves to the island states. Usually, one or two kHz QPOs are detected in the LLB and the LB. No kHz QPOs are generally detected in the UB nor in the harder EIS states (van der Klis, 2000, 2004; Altamirano et al., 2008a). In the hard island states, two broad features have been suggested as the equivalent of kHz QPOs at low frequencies ( Hz, e.g., Psaltis et al., 1999; van Straaten et al., 2004, 2005, and references therein).
The Keplerian velocities in the intense gravitational fields near NSs are very high. Accreting matter therefore has very short (millisecond) orbital periods which may be the cause of the kHz QPOs. In some models (e.g. Miller et al., 1998; van der Klis, 2000; Lamb & Miller, 2003; Lee et al., 2004) and observations (e.g., Jonker et al., 2002; Wijnands et al., 2003; Markwardt & Swank, 2003; Linares et al., 2005) the difference in the frequency of the twin kHz QPOs () is thought to be related to the NS spin frequency as or . However current data do not allow a definitive statement about this (see, e.g. Méndez & Belloni, 2007; Yin et al., 2007; van der Klis, 2008; Altamirano et al., 2010).
The Rossi X–ray Timing Explorer (RXTE) has been one of the most successful X–ray astronomy missions. From 1995 to 2012, RXTE has been used for observing known X–ray sources and also for discovering many new ones. An example of the latter is XTE J1701–407, a transient X–ray source discovered with RXTE on June 2008 (Markwardt et al., 2008). Since its discovery XTE J1701–407 has shown thermonuclear X–ray bursts (Linares et al., 2009; Falanga et al., 2009; Chenevez et al., 2010) establishing that it is an accreting NS. The discovery of kHz QPOs was briefly reported by Strohmayer et al. (2008), where it was suggested that this source is among the least luminous sources () in which twin kHz QPOs have been detected. Triggered by this possibility, in this paper we present a detailed study of the X-ray spectral and variability characteristics of XTE J1701–407 using all the 58 RXTE observations.
The upper limit on the distance of XTE J1701–407 was set to 6.1 kpc by Linares et al. (2009) and Falanga et al. (2009) from the spectral evolution of a long type I X-ray burst. Later, Chenevez et al. (2010) reported detection of photospheric expansion during a burst and derived the distance to XTE J1701–407 to be kpc; we use this distance for estimating .

2 Observations and data analysis
2.1 Light curves and colour–colour diagram
To study the long-term (days) X-ray variability, we use RXTE Proportional Counter Array (PCA, see Zhang et al., 1993; Jahoda et al., 2006) galactic bulge scan monitoring observations (Swank & Markwardt, 2001); the observations were taken once every days; the intensity (in units of cts/sec/5PCUs) is provided in the 2–10 keV energy range.
| Observation | Date | Exposure | Countsa | Stateb |
|---|---|---|---|---|
| (mm/dd/yy) | (s) | (c/s/PCU) | ||
| 93444-01-01-00 | 06/09/08 | 1027 | 17.8 | H |
| 93444-01-01-01 | 06/10/08 | 2655 | 20.5 | H |
| 93444-01-02-00 | 06/16/08 | 2039 | 39.6 | S |
| 93444-01-02-01 | 06/17/08 | 2659 | 27.1 | H |
| 93444-01-02-02 | 06/18/08 | 1964 | 25.8 | H |
| 93444-01-03-00 | 06/23/08 | 3493 | 17.4 | H |
| 93444-01-03-01 | 06/21/08 | 3561 | 20.3 | H |
| 93444-01-03-02 | 06/22/08 | 3102 | 20.0 | H |
| 93444-01-04-00 | 07/18/08 | 3510 | 41.7 | S |
| 93444-01-04-01 | 07/22/08 | 1984 | 42.9 | S |
| 93444-01-04-02 | 07/23/08 | 3541 | 45.2 | S |
| 93444-01-05-00 | 07/25/08 | 2004 | 39.4 | S |
| 93444-01-05-01 | 07/27/08 | 1820 | 40.1 | S |
| 93444-01-05-02 | 07/30/08 | 3838 | 37.8 | S |
| 93444-01-05-03 | 07/31/08 | 3602 | 32.3 | S |
| 93444-01-06-00 | 08/02/08 | 2126 | 31.2 | S |
| 93444-01-06-01 | 08/05/08 | 3784 | 12.1 | H |
| 93444-01-06-02 | 08/01/08 | 3536 | 32.8 | S |
| 93444-01-06-03 | 08/03/08 | 4166 | 25.5 | S |
| 93444-01-06-04 | 08/04/08 | 7767 | 13.9 | H |
| 93444-01-06-05 | 08/06/08 | 1888 | 10.2 | H |
| 93444-01-06-06 | 08/07/08 | 1562 | 9.4 | H |
| 93444-01-07-00 | 08/08/08 | 2647 | 8.1 | H |
| 93444-01-07-01 | 08/09/08 | 2761 | 8.9 | H |
| 93444-01-07-02 | 08/10/08 | 2402 | 11.9 | H |
| 93444-01-07-03 | 08/12/08 | 2300 | 13.1 | H |
| 93444-01-07-04 | 08/13/08 | 1821 | 15.3 | H |
| 93444-01-07-05 | 08/14/08 | 5361 | 15.5 | H |
| 93444-01-07-06 | 08/09/08 | 635 | 8.7 | H |
| 93444-01-07-07 | 08/09/08 | 2216 | 10.5 | H |
| 93444-01-07-08 | 08/14/08 | 1760 | 13.4 | H |
| 93444-01-07-09 | 08/14/08 | 1342 | 15.1 | H |
| 93444-01-08-00 | 08/18/08 | 493 | 17.9 | H |
| 93444-01-09-00 | 09/12/08 | 1657 | 57.2 | S |
| 93444-01-09-01 | 09/14/08 | 1943 | 81.7 | H |
| 93444-01-09-02 | 09/15/08 | 555 | 22.5 | H |
| 93444-01-09-03 | 09/16/08 | 2147 | 25.6 | H |
| 93444-01-09-04 | 09/18/08 | 2107 | 21.8 | H |
| 93444-01-10-00 | 09/20/08 | 2765 | 22.3 | H |
| 95328-01-01-00b | 01/05/10 | 13695 | 33.4b | – |
| 95328-01-01-01b | 01/05/10 | 3457 | 35.7b | – |
| 95328-01-01-02b | 01/07/10 | 1278 | 32.0b | – |
| 95328-01-01-03b | 01/07/10 | 1293 | 32.3b | – |
| 95328-01-01-04b | 01/07/10 | 5738 | 44.3b | – |
| 95328-01-02-00b | 01/08/10 | 10422 | 45.1b | – |
| 95328-01-03-00b | 03/29/10 | 6969 | 61.9b | – |
| 95328-01-04-00b | 05/24/10 | 11446 | 25.6b | – |
| 95328-01-05-00b | 08/16/10 | 3562 | 56.7b | – |
| 95328-01-06-00b | 08/17/10 | 3578 | 54.5b | – |
| 95328-01-07-00b | 11/14/10 | 10302 | 22.4b | – |
| 95328-01-08-00b | 01/06/11 | 3390 | 70.7b | – |
| 95328-01-08-01b | 01/05/11 | 1439 | 85.1b | – |
| 95328-01-09-00b | 01/18/11 | 10326 | 23.2b | – |
| 95328-01-09-01b | 01/18/11 | 17179 | 27.6b | – |
| 95328-01-10-00b | 04/25/11 | 7190 | 16.6b | – |
| 95328-01-10-01b | 04/26/11 | 7305 | 16.7b | – |
| 95328-01-10-02b | 04/28/11 | 9590 | 18.0b | – |
| 95328-01-11-00b | 09/20/11 | 7073 | 20.6b | – |
To study the X-ray spectral variations and the short-term
variability ( sec), we use the 58 pointed observations obtained
with the RXTE PCA between June 9th 2008 to September 20th
2011.
Each observation is between 0.5 ksec and 17 ksec long, adding up to a
total of ksec. For details on the observations, see
Table 1.
We calculated X-ray colours using 16s time resolution Standard 2 mode
data. Light curves were cleaned for instrumental effects like spikes
and dropouts, and corrected for background contribution in each band
using the standard faint source background model for the PCA (for
details of the model see PCA Digest at http://heasarc.gsfc.nasa.gov/).
We define the soft colour as the ratio of average count rates per observation in the energy ranges 3.6–6.4 keV and 2.0–3.5 keV, the hard colour as the ratio of count rates in the energy ranges 9.7–16.0 keV and 6.4–9.7 keV, and the intensity as the count rate in the energy range 2–16 keV. The exact count rates in these energy bands were obtained by linearly interpolating between PCU channels. To correct for the difference in sensitivity between different PCUs we normalized the count rates in each energy band by those of the Crab nebula in the same energy bands (e.g. Kuulkers et al., 1994; van Straaten et al., 2003). The Crab nebula observations used are those closest in time to each XTE J1701–407 observation. Given that the spectra of the source did not vary significantly within an observation (even in the long 17 ksec observation), in this paper we report intensities and colors per observation.
2.2 Fourier timing analysis
We used time resolution Event mode data available for
39 observations between 9th June and 29th September 2008.
For the remaining 19 observations (2010 to 2011)
the data are available in the Good
Xenon mode which has a resolution of . These data were
binned to also obtain a resolution of which results in
a Nyquist frequency of 4096 Hz.
From the event list of each observation we calculate the power spectra
using fast Fourier transforms (FFT) of continuous 16s data
segments (leading to a minimum frequency of s = 0.0625 Hz) and
using
data in the 3–30 keV energy
range (so as to optimize the signal to noise ratio).
The 16 s power spectra are then averaged to get one power density
spectrum per observation. In order to search for QPOs at very
low frequencies we also calculate FFTs of 1024 s data segments, which
gives a minimum frequency of mHz.
In both cases no deadtime or background corrections are done before
calculating the power density spectrum. We estimate the dead time corrected
Poisson noise spectrum using the analytic function in
Zhang et al. (1995). The estimated Poisson noise spectrum is
subtracted from the power density spectrum which is then converted to
root mean squared
(rms) normalization (van der Klis, 1995b). In the rms normalization
the square root of the integrated power gives the fractional rms
amplitude of the source variability in the frequency range over which
we integrate.
We fit the power density spectrum using multiple Lorentzian components. The characteristic frequency of the Lorentzians is given by (Belloni et al., 2002). The quality factor is defined as . FWHM is the full width at half maximum and is the centroid frequency of the Lorentzian. The Lorentzian components are usually categorized according to their characteristic frequencies as upper kHz (), lower kHz (), hump (), break (), hectohertz () (e.g, Belloni et al., 2002; van Straaten et al., 2003; Altamirano et al., 2005). The quoted errors use . Where only one error is quoted, it is the quadratic average between the positive and the negative error.
2.3 Contaminated Observations
Of the 58 RXTE observations, the first 39 observations, performed in 2008 (proposal P93444) were obtained with a Ra–Dec pointing of 255.35∘, –40.5∘ and the later 19 observations, performed in 2010–2011 (proposal P95328) were obtained with a Ra–Dec pointing of 255.43∘, –40.86∘. During the 2008 observations, the high mass X–ray binary (HMXB) pulsar OAO 1657–415 was at 1.17∘ from the PCA pointing coordinates, whereas during the 2010–2011 ones the HMXB was at 0.83∘. Therefore, in the latter case the HMXB is in the 1∘ FWHM field of view (FoV) of the RXTE-PCA observations of XTE J1701–407. To explore whether OAO 1657–415 affected our observations, we created 1024 s length power spectra of all 2010–2011 observations. In observations 95328-01-01-04, 95328-01-02-00, 95328-01-03-00 and 95328-01-04-00 we find a very narrow peak which has a frequency of 27.2 mHz. A period search using the FTOOL efsearch reveals a strong signal at 37.063 s corresponding to a frequency 26.981 mHz. This is is consistent with the spin period of OAO 1657–415 (Barnstedt et al., 2008; Denis et al., 2010). Given that the 2010–2011 observations are clearly contaminated by the flux from OAO 1657–415, we do not use them in the CD or intensity plots but we do use them in our timing analysis, as no high frequency features ( 1.27 Hz) have ever been detected from HMXBs (Kaur et al., 2007, and references therein). We also analyzed all the 86 RXTE observations of OAO 1657–415 for the presence of kHz QPOs and detected none.
3 Results
3.1 Light curve and colour–colour diagram
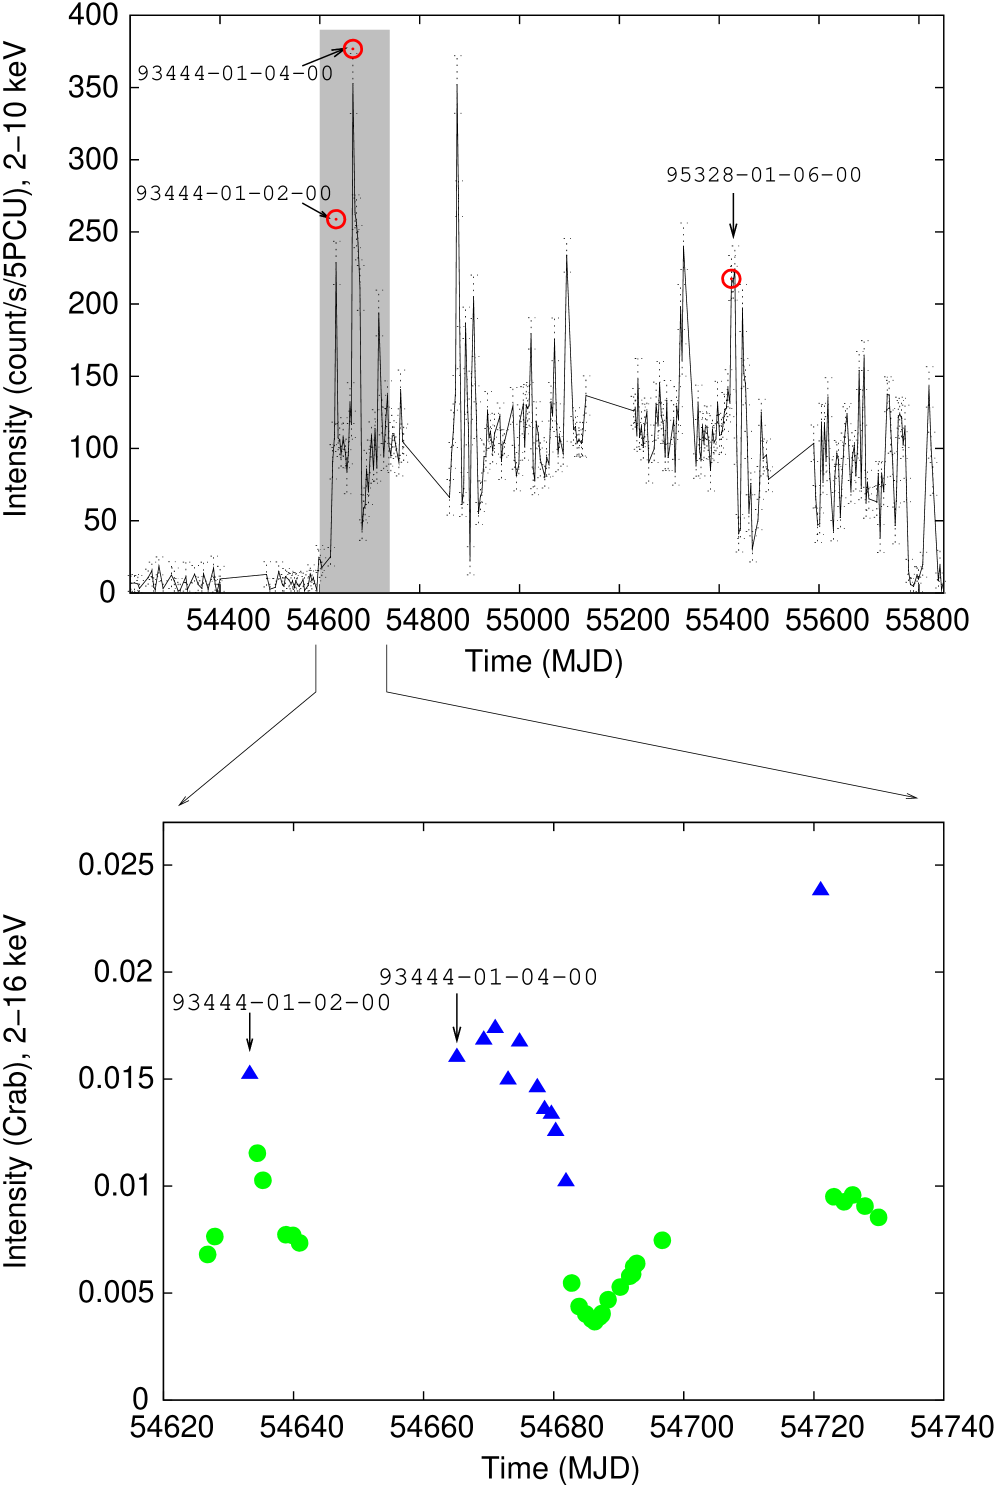
In the upper panel of Figure 2 we show the bulge-scan long-term light curve of XTE J1701–407. After the outburst onset (detected on June 2008, MJD 54625), the lightcurve shows instances of increased emission on top of an average 2–10 keV intensity of 100 cts/s/5PCU, during which the intensity increases to nearly two to four times the average. After a three year long outburst since its discovery, the source went below the RXTE galactic bulge scan monitor detection limit around 27th August 2011(Degenaar et al., 2011a). A few days later it rebrightened to 100 cts/s/5PCU from 16th to 24th September 2011 (Degenaar et al., 2011b); after that its intensity decreased to 10 cts/s/5PCU and remained so till it was last monitored by RXTE on 29th October 2011 (MJD 55863.4). In the lower panel of Figure 2 we show the Crab normalized light curve for 2008 observations. These observations sample the source when its intensity was between 2 mCrab and 25 mCrab. In Figure 3 we show the CD of the 2008 observations. It is clear that the observations are confined to a few distinct regions in the diagram. We refer to the 27 observations with hard colour as hard state (circles) and the 12 observations with hard colour as soft state (triangles).
As can be seen in Figure 2, the first two pointed observations of XTE J1701–407 occur when it was in the hard state (on MJD 54626 and 54627). Then the source was detected in the high luminosity soft state on MJD 54633 in one observation. As the intensity decreased the source went to the hard state again where it was observed for 5 days. After a gap of 27 days, XTE J1701–407 was observed in the soft state for 17 days after which its decreased and underwent a transition to the hard state; our data covers 14 days before they stop. After a 25 days gap, the source was in the soft state for one day (MJD 54721); within a day XTE J1701–407 transited to the hard state again. Clearly, the soft state observations track the high intensity periods; however, there is no clear intensity cut that indicates whether the source is in the soft or hard state (as noted by Linares et al. (2009)). This is probably due to hysteresis effects, which are typical for this type of systems (Maccarone & Coppi, 2003; Meyer-Hofmeister et al., 2005).
3.2 Aperiodic variability
We examined all the power spectra in the energy band 3–30 keV individually for variability. We detect significant (3 single–trial) QPOs in three different observations, the times of which are marked with arrows in the upper panel of Figure 2. In Figure 3 we indicate only the two uncontaminated observations of 2008. It should be noted that all these three QPOs were detected during the high intensity state. The source is in the soft state during observations 93444-01-02-00 and 93444-01-04-00 (Figure 3); the spectral state during observation 95328-01-06-00 is difficult to constrain as the spectra are contaminated by a HMXB in the FoV (OAO 1657–415, see Section 2.3).
In observation 93444-01-02-00 (MJD 54633.2) we detect two QPOs at characteristic frequencies Hz and Hz. In Figure 4 we show them separately for clarity. The Hz QPO is accompanied by a broad noise component fit with a Lorentzian centered at Hz. In observations 93444-01-04-00 (MJD 54665.1) and 95328-01-06-00 (MJD 55425.08) we detect twin kHz QPOs at characteristic frequency Hz and Hz and Hz and Hz, respectively (see Figure 5). In the latter case (95328-01-06-00) we also detect a broad bump at Hz and a fractional rms amplitude of 11%. In the observation 93444-01-04-00 this broad bump is not detected significantly, with a upper limit of 19% fractional rms amplitude. The difference in the centroid frequencies of the twin kHz QPOs is Hz and Hz for the two observations, respectively. In Table 2 we report on the best fit parameters for the detected features with single trial significance .
To calculate the total number of trials, we use the fact that we looked for QPOs in the 0.1-2000 Hz range in 58 observations, and that we found QPOs with FWHM as reported in Table 2. This leads to a total number of trials 3170, 1574 and 2187 for observations 93444-01-02-00, 93444-01-04-00 and 95328-01-06-00 respectively. Under these conservative assumptions, the upper kHz QPOs in 93444-01-02-00 and 95328-01-06-00 are at 4.8 and respectively, while the significance of all other QPOs including lower kHz QPOs is below . However in atoll sources, the upper kHz QPOs are mostly detected in the high luminosity soft state and in a narrower frequency range (800–1200 Hz); when we consider only the 12 soft state observations (see Table 1 and Figure 3), our number of trials are 131, 65, 91, respectively for the upper kHz QPOs detected in 93444-01-02-00, 93444-01-04-00 and 95328-01-06-00. With these considerations, the upper kHz QPOs in 93444-01-02-00 and 95328-01-06-00 have significances of and , respectively; the significance of the upper kHz QPO in 93444-01-04-00 falls to and that of the two detections of the lower kHz QPOs to 1. However, since all kHz QPOs are detected in the soft state and in the expected frequency range for neutron stars (Jonker et al., 2001; Belloni et al., 2005; van der Klis, 2006a; van Straaten et al., 2000, 2003; Altamirano et al., 2008a; Boirin et al., 2000; Wijnands & van der Klis, 1997; Kaaret et al., 2002; Tomsick et al., 1999) we conclude that our kHz QPO detections in XTE J1701–407 are most probably real.
Apart from the QPO detections and the broad features mentioned above, we did not detect any of the other broad band noise components expected in the banana state (e.g., van Straaten et al., 2003, 2005; Altamirano et al., 2008a). This is probably due to the low statistics in our data. To further investigate this, we averaged all the power spectra in two groups using only data when the source was either in the hard or in the soft state. In Figure 6 we show the averaged power spectrum of all hard state observations; the power spectrum has an 0.1-100 Hz integrated fractional rms amplitude of % and it is well described with two broad noise components with characteristic frequencies 0.52 Hz and 20.6 Hz (see Table 3 for the best fit parameters). The quality factor Q needed to be fixed to zero in our fits (as the best fit gave negative values; note that this is common practice when the component is too broad and is consistent with a Lorentzian of Hz, see, e.g., Belloni et al., 2002; van Straaten et al., 2005); we note that the frequency and fractional rms did not change significantly before and after the value of Q was fixed. The averaged power spectra of the soft state observations (excluding the contaminated observations and those in which we detect QPOs) has an 0.1-100 Hz integrated fractional rms amplitude of % and shows no significant features; we detected only an 50 Hz signal with a significance of . For this power spectrum we estimated 7.01%, 13.4%, 12.6% confidence upper limits for 30 Hz, 740 Hz, 1110 Hz QPOs respectively with parameters similar to those in Table 2.
| Observation | (Hz) | Q | |
|---|---|---|---|
| 93444-01-02-00 | |||
| 93444-01-04-00 | |||
| 95328-01-06-00 | |||
| (Hz) | rms(%) | Q |
|---|---|---|
3.3 Correlation of and the other characteristic frequencies
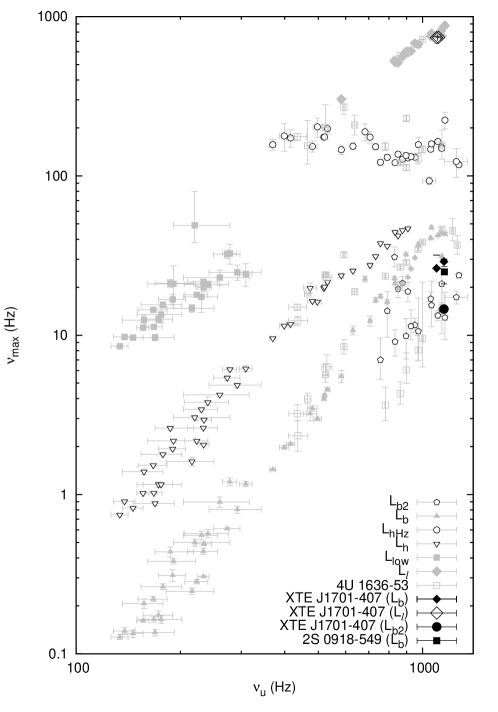
The characteristic frequency of the various power spectral components (so called , , , ) are correlated to the characteristic frequency of the upper kHz QPO (see e.g. van Straaten et al., 2003, 2005; Altamirano et al., 2008a, and references within).
In Figure 7 we plot the characteristic frequency of the various components versus for XTE J1701–407, and for the atoll sources 4U 0614+09, 4U 1608–52 and 4U 1728–34 (van Straaten et al., 2003, 2005; Altamirano et al., 2005, 2008a). As can be seen, at high , different tracks blend together and sometimes it is difficult to differentiate between power spectral components. Our low frequency features could be or only based on the frequency correlations. The high coherence of the feature at Hz suggests it might be (see, e.g. Altamirano et al., 2008a).
3.4 Fractional rms amplitude versus luminosity
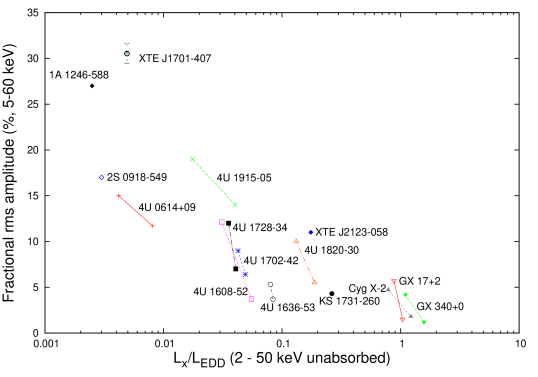
In Figure 8 we show the fractional rms amplitude of the kHz QPOs versus the luminosity for XTE J1701–407 and other sources. The fractional rms amplitude is calculated for the upper kHz QPO if it is significantly detected in the 5–60 keV range, and it is plotted for the maximum and minimum frequency of the upper kHz QPOs detected in each source (see Jonker et al., 2001). Besides the high dispersion of the data, it is clear that there is an anti-correlation between the fractional rms amplitude of the kHz QPOs and the source flux. The data of XTE J1701–407 is consistent with the anti-correlation (we estimated the rms amplitudes in the 5–60 keV range to match the energy range used by Jonker et al. 2001). The flux upper limit used for XTE J1701–407 in Figure 8 was obtained from Linares et al. (2009) and data for the other sources from Ford et al. (2000) and Jonker et al. (2001).
3.5 Correlation of rms and energy
The fractional rms amplitude of QPOs is a measure of the fraction of observed photons which are modulated at the QPO frequency, and so can give additional information useful to understand the physical process that sets the amplitude and/or the frequency of the oscillation (see Cabanac et al., 2010; Gierliński & Zdziarski, 2005; Zdziarski, 2005; Zdziarski et al., 2005, and references within for extensive discussion). The fractional rms amplitude of QPOs increases with energy (the only clear exceptions are the mHz QPOs in 3 atoll sources thought to be due to marginally stable burning of hydrogen or helium on the neutron star surface, see, e.g. Altamirano et al., 2008b; Revnivtsev et al., 2001, and references therein). In Figure 9 we show the fractional rms amplitude versus energy of the kHz QPO at Hz in observation 93444-01-04-00. We plot two points (energy bands 2.06 to 5.71 keV and 6.12 to 31.7 keV; more points lead to larger errors). Points from observation 93444-01-02-00 are not included because of very low statistics and points from 95328-01-06-00 are not included as it is one of the contaminated observations. For comparison we also include the data for the atoll source 4U 1608–52 (Berger et al., 1996; Méndez et al., 1998). We see that the rms depends weakly on energy for XTE J1701–407, significantly different from the relatively luminous source 4U 1608-52, where it increases monotonically with energy.
4 DISCUSSION
In this paper we report the discovery of kHz QPOs in the low-mass X-ray binary XTE J1701–407. XTE J1701–407 is one of the least luminous LMXB that shows kHz QPOs at an average flux of erg cm-2 s-1 in the 2–20 keV band (Falanga et al., 2009); from time to time it shows a sudden excursion to the soft state as the source intensity increases. The increased emission is most probably because of an increase in the mass accretion rate (). When increases, it leads to high and the spectrum softens. This is a well known behaviour in compact accreting objects, (see, e.g., Done & Gierliński, 2003; Done et al., 2007, and references within). Based on the transition tracks between hard and soft states in the CD, Gladstone et al. (2007) have classified atoll sources as diagonals and verticals. Comparison of the first and last panel of Figure 3 with the second row of Figure 2 in Gladstone et al. (2007), implies that XTE J1701–407 behaves as a vertical. According to Gladstone et al. (2007), this means is low enough to allow the magnetic field to emerge from the surface of the neutron star and affect the accretion flow. Given that the CD of XTE J1701–407 resembles that seen in other low-luminosity sources, it shows thermonuclear X–ray bursts (Markwardt et al., 2008; Linares et al., 2009; Falanga et al., 2009; Chenevez et al., 2010), strong broad band noise in the hard state and kHz QPOs when the source flux is highest and spectra softest, we conclude that XTE J1701–407 can be classified as an atoll source, (see also Linares et al., 2009).
4.1 Quasi-periodic oscillations
Twin kHz QPOs were detected on two occasions with centroid frequency differences of Hz and Hz, i.e. is the same within errors in both cases. This is among the highest detected in a neutron star LMXB so far (van der Klis, 2000; van der Klis et al., 1997; Méndez & Belloni, 2007), the other higher values are Hz in GX 340+0 (Jonker et al., 2000) and Hz in 4U 0614+09 (van Straaten et al., 2000). Occurrences of high highlights the fact that models for kHz QPOs should be able to accommodate values from Hz (Linares et al., 2005) up to Hz.
Although it is still not confirmed nor refuted (see, e.g., Méndez & Belloni, 2007; van der Klis, 2008), it has been proposed that is related to the spin frequency of the neutron star (Strohmayer et al., 1996; Miller et al., 1998). Muno et al. (2001), based on observational results, proposed that (for ) and (for ). The spin frequency of the neutron star in XTE J1701-407 is not known; however, assuming that the proposal of Muno et al. (2001) is correct, then the spin frequency of XTE J1701-407 should be around 185 Hz or around 370 Hz.
4.2 kHz QPO fractional rms amplitude versus luminosity
Jonker et al. (2001) showed that there was an anticorrelation between the kHz QPO fractional rms amplitude and the X-ray luminosity Lx of the source when the QPOs were detected. This was further supported by the results of Jonker et al. (2007) who found fractional rms amplitude kHz QPOs in the low-luminosity neutron star 1A 1246–588. As shown in Figure 8, our discovery of kHz QPOs on XTE J1701–407 further supports the anti-correlation. As can be seen the anti-correlation has some dispersion, and although kHz QPOs have been detected in sources at lower Lx than XTE J1701–407 (e.g., 4U 0614+109 and 2S 0918–549), the kHz QPO fractional rms amplitude in XTE J1701–407 is the highest rms reported as yet for an upper kHz QPO. To date there is no clear picture that explains this anticorrelation (e.g., Jonker et al., 2001, 2007) and, as suggested by Jonker et al. (2001), it should be considered when modeling the mechanisms producing the kHz QPOs.
Méndez (2006) studied the relation between the maximum fractional rms amplitude of the kHz QPOs observed in a source, versus the source luminosity and found that for the upper kHz QPO, the fractional rms amplitude was approximately constant (20%) at (2–60 keV), and decreased at (see fig. 3 in Méndez, 2006). The results on the kHz QPO in 1A 1246–588 by Jonker et al. (2007) cast doubt on this trend, and led those authors to the conclusion that either the relation between kHz QPO frequency and fractional rms is significantly different in 1A 1246–588 from that which is seen in other NS-LMXBs, or the increase in amplitude and source luminosity does not level off at 20% (Méndez, 2006) but keeps increasing. Our results on the kHz QPOs in XTE J1701–407 have a fractional rms amplitude of 30.51.1 % (5–60 keV) when at 1100-1150 Hz, showing that 1A 1246–588 is not unique, and strongly supporting the conjecture of Jonker et al. (2007) that the fractional rms amplitude keeps increasing at low luminosity.
5 ACKNOWLEDGMENTS
DP and KS thank IUCAA, Pune, India and University of Amsterdam, Netherlands for their support and thank Ranjeev Misra and Gulab Dewangan for discussions during their visits to IUCAA. This research has made use of NASA’s Astrophysics Data System. This research has made use of data obtained through the High Energy Astrophysics Science Archive Research Centre Online Service, provided by the NASA/Goddard Space Flight Center.
References
- Altamirano et al. (2005) Altamirano D., van der Klis M., Méndez M., Migliari S., Jonker P.G., Tiengo A., Zhang W., 2005, \apj, 633, 358
- Altamirano et al. (2008a) Altamirano D., van der Klis M., Méndez M., Jonker P.G., Klein-Wolt M., Lewin W.H.G., 2008a, \apj, 685, 436
- Altamirano et al. (2008b) Altamirano D., van der Klis M., Wijnands R., Cumming A., 2008b, \apjl, 673, L35
- Altamirano et al. (2010) Altamirano D., Linares M., Patruno A., Degenaar N., Wijnands R., Klein-Wolt M., van der Klis M., Markwardt C., et al., 2010, \mnras, 401, 223
- Barnstedt et al. (2008) Barnstedt J., Staubert R., Santangelo A., Ferrigno C., Horns D., Klochkov D., Kretschmar P., Kreykenbohm I., et al., 2008, \aap, 486, 293
- Belloni et al. (2002) Belloni T., Psaltis D., van der Klis M., 2002, 572, 392
- Belloni et al. (2005) Belloni T., Homan J., Casella P., van der Klis M., Nespoli E., Lewin W.H.G., Miller J.M., Méndez M., 2005, \aap, 440, 207
- Berger et al. (1996) Berger M., van der Klis M., van Paradijs J., Lewin W.H.G., Lamb F., Vaughan B., Kuulkers E., Augusteijn T., et al., 1996, \apjl, 469, L13+
- Boirin et al. (2000) Boirin L., Barret D., Olive J.F., Bloser P.F., Grindlay J.E., Sep. 2000, \aap, 361, 121
- Cabanac et al. (2010) Cabanac C., Henri G., Petrucci P.O., Malzac J., Ferreira J., Belloni T.M., 2010, \mnras, 404, 738
- Chenevez et al. (2010) Chenevez J., Falanga M., Brandt S., Galloway D., Kuulkers E., Cumming A., Schatz H., Lund N., et al., 2010, The Astronomer’s Telegram, 2814, 1
- Degenaar et al. (2011a) Degenaar N., Wijnands R., Altamirano D., Cackett E., Linares M., Homan J., Fridriksson J., 2011a, The Astronomer’s Telegram, 3604, 1
- Degenaar et al. (2011b) Degenaar N., Wijnands R., Altamirano D., Cackett E., Linares M., Homan J., Fridriksson J., 2011b, The Astronomer’s Telegram, 3654, 1
- Denis et al. (2010) Denis M., Bulik T., Marcinkowski R., 2010, Acta Astronomica, 60, 75
- Di Salvo et al. (2003) Di Salvo T., Méndez M., van der Klis M., 2003, \aap, 406, 177
- Done & Gierliński (2003) Done C., Gierliński M., 2003, \mnras, 342, 1041
- Done et al. (2007) Done C., Gierliński M., Kubota A., 2007, \aapr, 15, 1
- Falanga et al. (2009) Falanga M., Cumming A., Bozzo E., Chenevez J., 2009, \aap, 496, 333
- Ford et al. (2000) Ford E.C., van der Klis M., Méndez M., Wijnands R., Homan J., Jonker P.G., van Paradijs J., 2000, \apj, 537, 368
- Gierliński & Zdziarski (2005) Gierliński M., Zdziarski A.A., 2005, \mnras, 363, 1349
- Gladstone et al. (2007) Gladstone J., Done C., Gierliński M., 2007, \mnras, 378, 13
- Hasinger & van der Klis (1989) Hasinger G., van der Klis M., 1989, \aap, 225, 79
- Homan et al. (2010) Homan J., van der Klis M., Fridriksson J.K., Remillard R.A., Wijnands R., Méndez M., Lin D., Altamirano D., et al., 2010, \apj, 719, 201
- Jahoda et al. (2006) Jahoda K., Markwardt C.B., Radeva Y., Rots A.H., Stark M.J., Swank J.H., Strohmayer T.E., Zhang W., 2006, \apjs, 163, 401
- Jonker et al. (2000) Jonker P.G., Méndez M., van der Klis M., 2000, \apjl, 540, L29
- Jonker et al. (2001) Jonker P.G., van der Klis M., Homan J., Méndez M., van Paradijs J., Belloni T., Kouveliotou C., Lewin W., et al., 2001, \apj, 553, 335
- Jonker et al. (2002) Jonker P.G., Méndez M., van der Klis M., 2002, \mnras, 336, L1
- Jonker et al. (2007) Jonker P.G., in’t Zand J.J.M., Méndez M., van der Klis M., 2007, \mnras, 378, 1187
- Kaaret et al. (2002) Kaaret P., in ’t Zand J.J.M., Heise J., Tomsick J.A., Aug. 2002, \apj, 575, 1018
- Kaur et al. (2007) Kaur R., Paul B., Raichur H., Sagar R., 2007, \apj, 660, 1409
- Kuulkers et al. (1994) Kuulkers E., van der Klis M., Oosterbroek T., Asai K., Dotani T., van Paradijs J., Lewin W.H.G., 1994, \aap, 289, 795
- Lamb & Miller (2003) Lamb F.K., Miller M.C., 2003, ArXiv Astrophysics e-prints
- Lee et al. (2004) Lee W.H., Abramowicz M.A., Kluźniak W., 2004, \apjl, 603, L93
- Linares et al. (2005) Linares M., van der Klis M., Altamirano D., Markwardt C.B., 2005, \apj, 634, 1250
- Linares et al. (2009) Linares M., Wijnands R., van der Klis M., A. W., P. S.P.D.N.C., R. S., 2009, \mnras
- Maccarone & Coppi (2003) Maccarone T.J., Coppi P.S., 2003, \mnras, 338, 189
- Markwardt & Swank (2003) Markwardt C.B., Swank J.H., 2003, \iaucirc, 8144, 1
- Markwardt et al. (2008) Markwardt C.B., Pereira D., Swank J.H., 2008, The Astronomer’s Telegram, 1569, 1
- Méndez (2006) Méndez M., 2006, \mnras, 371, 1925
- Méndez & Belloni (2007) Méndez M., Belloni T., 2007, \mnras, 381, 790
- Méndez et al. (1998) Méndez M., van der Klis M., van Paradijs J., Lewin W.H.G., Vaughan B.A., Kuulkers E., Zhang W., Lamb F.K., et al., 1998, \apjl, 494, L65+
- Meyer-Hofmeister et al. (2005) Meyer-Hofmeister E., Liu B.F., Meyer F., 2005, \aap, 432, 181
- Miller et al. (1998) Miller M.C., Lamb F.K., Psaltis D., 1998, \apj, 508, 791
- Muno et al. (2001) Muno M.P., Chakrabarty D., Galloway D.K., Savov P., 2001, \apjl, 553, L157
- Psaltis et al. (1999) Psaltis D., Belloni T., van der Klis M., 1999, \apj, 520, 262
- Revnivtsev et al. (2001) Revnivtsev M., Churazov E., Gilfanov M., Sunyaev R., 2001, \aap, 372, 138
- Schnerr et al. (2003) Schnerr R.S., Reerink T., van der Klis M., Homan J., Méndez M., Fender R.P., Kuulkers E., 2003, \aap, 406, 221
- Strohmayer et al. (1996) Strohmayer T.E., Zhang W., Swank J.H., Smale A., Titarchuk L., Day C., Lee U., 1996, \apjl, 469, L9+
- Strohmayer et al. (2008) Strohmayer T.E., Markwardt C.B., Swank J.H., 2008, The Astronomer’s Telegram, 1635, 1
- Swank & Markwardt (2001) Swank J., Markwardt K., 2001, in ASP Conf. Ser. 251, New Century of X-ray Astronomy, eds. H. Inoue & H. Kunieda (San Francisco: ASP), 94
- Tomsick et al. (1999) Tomsick J.A., Halpern J.P., Kemp J., Kaaret P., Aug. 1999, \apj, 521, 341
- van der Klis (1995a) van der Klis M., 1995a, In: F. Giovannelli & G. Mannocchi (ed.) Frontier Objects in Astrophysics and Particle Physics, Vulcano Workshop 2008, held 23-28 May, 1994 in Vulcano, Italy. Edited by F. Giovannelli and G. Mannocchi, 1995, p.213, 213–+
- van der Klis (1995b) van der Klis M., 1995b, Proceedings of the NATO Advanced Study Institute on the Lives of the Neutron Stars, held in Kemer, Turkey, August 19-September 12, 1993. Editor(s), M. A. Alpar, U. Kiziloglu, J. van Paradijs; Publisher, Kluwer Academic, Dordrecht, The Netherlands, Boston, Massachusetts, 301
- van der Klis (2000) van der Klis M., 2000, \araa, 38, 717
- van der Klis (2004) van der Klis M., 2004, in “Compact Stellar X-ray Sources”, eds. W.H.G. Lewin and M. van der Klis, in press.
- van der Klis (2006a) van der Klis M., 2006a, Rapid X-ray Variability, 39–112
- van der Klis (2006b) van der Klis M., 2006b, in Compact Stellar X-Ray Sources, ed. W. H. G. Lewin & M. van der Klis (Cambridge: Cambridge Univ. Press)
- van der Klis (2008) van der Klis M., 2008, In: Wijnands R., Altamirano D., Soleri P., Degenaar N., Rea N., Casella P., Patruno A., Linares M. (eds.) American Institute of Physics Conference Series, vol. 1068 of American Institute of Physics Conference Series, 163–173
- van der Klis et al. (1997) van der Klis M., Wijnands R.A.D., Horne K., Chen W., 1997, \apjl, L97+
- van Straaten et al. (2000) van Straaten S., Ford E.C., van der Klis M., Méndez M., Kaaret P., 2000, \apj, 540, 1049
- van Straaten et al. (2003) van Straaten S., van der Klis M., Méndez M., 2003, \apj, 596, 1155
- van Straaten et al. (2004) van Straaten S., van der Klis M., Wijnands R., 2004, Nuclear Physics B Proceedings Supplements, 132, 664
- van Straaten et al. (2005) van Straaten S., van der Klis M., Wijnands R., 2005, \apj, 619, 455
- Wijnands & Miller (2002) Wijnands R., Miller J.M., 2002, \apj, 564, 974
- Wijnands et al. (2003) Wijnands R., van der Klis M., Homan J., Chakrabarty D., Markwardt C.B., Morgan E.H., 2003, \nat, 424, 44
- Wijnands & van der Klis (1997) Wijnands R.A.D., van der Klis M., 1997, \apjl, 482, L65+
- Yin et al. (2007) Yin H.X., Zhang C.M., Zhao Y.H., Lei Y.J., Qu J.L., Song L.M., Zhang F., 2007, \aap, 471, 381
- Zdziarski (2005) Zdziarski A.A., 2005, \mnras, 360, 816
- Zdziarski et al. (2005) Zdziarski A.A., Gierliński M., Rao A.R., Vadawale S.V., Mikołajewska J., 2005, \mnras, 360, 825
- Zhang et al. (1993) Zhang W., Giles A.B., Jahoda K., Soong Y., Swank J.H., Morgan E.H., 1993, In: Proc. SPIE Vol. 2006, p. 324-333, EUV, X-Ray, and Gamma-Ray Instrumentation for Astronomy IV, Oswald H. Siegmund; Ed., 324–333
- Zhang et al. (1995) Zhang W., Jahoda K., Swank J.H., Morgan E.H., Giles A.B., 1995, \apj, 449, 930