Spectroscopy of 13 high mass stars in the Cyg OB2 association
Aiming to explore weak spectral features of stellar and interstellar origin we used the NES echelle spectrograph of the 6–m telescope to obtain high–resolution spectra for 13 hot O3–B4 stars in the Cyg OB2 association, including a high luminous star No. 12. Velocity fields in the atmospheres and interstellar medium, characteristics of optical spectra and line profiles are investigated. The cascade star formation scheme for the association is confirmed. Evidence is presented suggesting that the hypergiant Cyg OB2 No. 12 is an LBV object and that its anomalous reddening has a circumstellar nature.
1 Introduction
Among hypergiants of the Galaxy, those belonging to stellar associations are most attractive for study. Membership in a stellar group makes it easier to estimate a star’s age, luminosity, and center of mass radial velocity, which is needed to introduce a zero point for the system of velocities observed in the stellar atmosphere and wind. In addition, studies of stars with extreme luminosities and mass loss rates can naturally be expanded to their influence on the association’s gas and dust component and the star formation process. In the present paper, we address this two-sided problem for the enigmatic star No. 12 and other members of the Cyg OB2 association. This association (initially named VI Cyg; , , l = 80.2o, b = +0.8o) was discovered in the middle of the 20-th century and still remains one of the most actively studied objects in our Galaxy. Refinement of its principal characteristics (size, population, age, etc.) is still underway; the list of frequently cited publications given below shows that this refinement has proceeded especially intensively in recent years.
1.1 History of stellar population studies for Cyg OB2
1953: Münch and Morgan [1] noticed a concentration of OB stars to the northwest of Cyg on a photograph taken through an objective prism. A year later, it acquired the status of an O–association: it turned out that 13 of the first 14 stars identified in it were O stars [2]. The considerable extinction towards Cyg OB2 ( Av ) is not high enough to severely impede high resolution spectroscopy for the brightest association members, and the accompanying reddening even makes it easier to use a low dispersion objective prism or three color photometry to search for fainter hot stars [3, 4].
1966: Based on their photographic UBV photometry and counts of faint stars on Palomar Sky Survey images, Reddish et al. [5] increased the projected area of Cyg OB2 on the plane of the sky to a third of a square degree (the linear diameter was about 20 pc); the number of possible OB members of the association increased to 300.
1991: Although Massey and Thompson [6] restricted their study to the central part of the association, their more accurate CCD photometry enabled them to reliably identify its 108 brightest members, for 76 of which they performed 2D spectral classifications based on moderate-resolution spectra. This study made it possible to accurately trace the main sequence (MS) in the Hertzsprung–-Russell (HR) diagram, and to estimate the limiting mass for an association member to be 85 and the
2000: Suspecting that Reddish et al. [5] had studied only a relatively transparent “window”, Knodlseder [7] attempted to broaden it using counts in the near-IR from the 2MASS survey. According to his estimates, the diameter of the association is about 60 pc, the number of OB members is about 2500, and the total mass is from 40 to 100 thousand , so that it can be considered the first young globular cluster detected in our Galaxy.
2002: Comeron et al. [8] added IR photometry with low-resolution IR spectroscopy. They confirmed Knodlseder’s estimates, but drew more cautious conclusions, reporting Cyg OB2 to be only one of the Galaxy’s highest-mass clusters, “perhaps comparable to a young globular cluster.”
2003: Hanson [9] expressed stronger doubts about the unique status of Cyg OB2, called a super-star cluster. She was able to provide MK classifications for the brightest OB–star candidates, based on the shortwavelength part of the spectrum; these are indeed early type stars, but most are appreciably older than the main population of the association and are located in its extended halo.
2007: The spectroscopic survey of Kiminki et al. [10] doubled the number of OB stars with MK classifications and identified as members of Cyg OB2. This survey also made it possible to use radial velocities as an additional criterion of association membership: the velocity dispersion was found to be moderate (2.4 km/s), as is typical of open clusters.
2008: Photometry in the visible and near-IR and low-resolution spectroscopy revealed two types of stellar condensations, both spatially close to the association and probably related to it evolutionarily, although they are located in its peripheral regions. The first contains A0–A5 stars, which are several million years older than the high mass Cyg OB2 stars [11], while the second contains late type stars that have not yet reached the MS and were presumably formed under the influence of the hot, higher-mass stars of the association [12]. Comeron et al. [13] repeated their photometric and spectroscopic study in an annular zone between and from the association center and found evolved BIII, Be, and WR stars there, in addition to field stars; in their opinion, this “conclusively dismisses the case for a large extent of Cygnus OB2 beyond the boundaries of its central concentration.” However, Negueruela et al. [14] believe that star formation has proceeded in small bouts over an extended period of time in the central part of the association as well: most of the stars have ages of about 2.5 million years; stars that formed 5–7 million years ago are also present, as well as quite young stars (or rejuvinated, blue stragglers?).
2010: Wright et al. [15] augmented the list of Cyg OB2 members with new young stars, identified from their X-ray radiation, and estimated the total mass of the association to be 30 thousand . They found new evidence that the current O stars were produced in the latest phase of triggered, rather than burst, star formation. Thus, Cyg OB2 is a rich association but not a super-cluster, as is natural for an aggregate formed in a disk galaxy far from its center [16]. In a supercluster, stars with a total mass of at least 100 thousand are concentrated in a volume not exceeding several cubic parsecs. The object closest to us that approaches a supercluster according these parameters is Westerlund 1 [17]. Its spatial structure differs drastically from that of Cyg OB2: a direct photo (in red light: Av !) shows a very compact group of stars, while two small subclusters of the Orion Trapezium type were identified in the central region of Cyg OB2 only recently [18], and, taken together, they contain no more than one-third of all O stars of the association.
1.2 The problem of star No. 12
Among the brightest members of Cyg OB2, star No. 12 (using the numbering of Schulte [3]) has attracted the most attention. Immediately after the discovery of the association, Morgan et al. [19] noted this star’s striking combination of a red color (it is considerably redder than its neighbors, stars No. 5 and No. 9), early spectral type, and very high luminosity. It was soon found that Cyg OB2 No. 12 (hereafter called star No. 12 for brevity) also stood out among the association’s stars in its abnormally high degree of polarization [20]. Having moved to the near-infrared for spectroscopic classification of star No. 12 and selected several comparison stars, Sharpless [21] obtained the spectral type B5, absolute magnitude Mv, and interstellar extinction Av . No significant refinements of these estimates have since been found necessary. If there were no absorbing matter in the line of sight, this star would rival Sadr and Deneb in brightness. In the HR–diagram, star No. 12 is above the Humphreys–Davidson limit and is one of the brightest stars in the visible range in our Galaxy, making it natural to suspect that it is a luminous blue variable (LBV). Numerous attempts to confirm the LBV status for this star have not brought a final result. In 1984, Leitherer et al. [22] noted that the wind from star No. 12 was similar those from S Dor variables. According to Massey and Thompson [6], it is an incipient LBV star. Humphreys and Davidson [23] believe star not to be a full-fledged LBV star. Van Genderen [24] calls it a weak-active star. The result is that star No. 12 was still listed as only a candidate LBV object in the review of Clark et al. 25] in 2005.
Of the principal characteristics of LBVs, the star has a high luminosity and a high mass-loss rate, an early spectral type, and brightness variability. Variability has been detected both in the blue [26] and in the red [27], with mean magnitudes of 14.7m and 9.0m, respectively, and brightness variations reaching 0.3m. However, to our knowledge, it remains unknown if the star’s brightening is accompanied by reddening – an effect noted even for the lowest-amplitude LBV objects [28].
The first information obtained about the wind from star No. 12 was contradictory. Judging from the radio emission from free–free transitions discovered in 1980 by Wendker and Altenhoff [29], it is as strong as the wind of P Cygni [30], but is not manifest via an IR excess for some reason. This contradiction was removed in [22] using a cool-wind model (Te = 5000 K for Teff = 13600 K), however, with an unnaturally high limiting outflow velocity, km/s. This velocity is an order of magnitude lower for LBV objects during their maximum visual brightness; their winds are not only cool, but also slow. The above estimate is probably erroneous: it is based on low-quality spectra of star No. 12 where a depression near 6532 Å was taken to be a blueshifted H component [31, 32]. This depression could result from a local defect and a group of telluric H2O absorption festures overlapping the diffuse interstellar band (DIB) at 6534 Å [33]. Recent high resolution spectra have no anomalies near 6532 Å, and the absorption H components indicate a limiting velocity km/s [34].
High angular resolution centimeter wavelength radio observations reveal variability and asymmetry of the wind from star No. 12; at 6 cm, the source is elongated North–South (), and a condensation can even be noted in its southern part [35].
The question of star No. 12 is an LBV star may be related to its anomalous reddening. The star’s color excess E (B–V) is at least 1m larger than those of other stars of the association. The hypothesis that this additional reddening has a circumstellar origin, which would provide a strong argument for star No. 12 being an LBV object, has not yet found reliable observational confirmation. The star has been identified with the IR–source IRAS 20308 + 4104 and the presence of cool dust in its envelope is suspected [36], but direct images of the dust shell have not yet been detected in IR frames.
This paper describes our own high resolution spectra for the 13 brightest stars in the region of the Cyg OB2 association. These spectra will be used for model analyses of the atmospheres and winds of particular stars, as well as the derivation of empirical Vr (r) relations and their zero points, i.e., the radial velocities of the stellar centers of mass (Vsys). These relations can potentially help us approach an understanding of the nature of star No. 12, where the problem of Vsys is especially acute [34]. Unfortunately, our spectra do not contain emission lines from HII regions, but they are rich in absorption lines that provide information on the structure and kinematics of the interstellar medium in the direction of the association and, in the volume of the association proper, information on the interaction of stellar winds with the ambient matter.
1.3 Observations, reduction and analyses of the spectra
Table 1 presents information on the available spectroscopic material. The first five columns contain the star numbers from Schulte [4], dates when the spectra were taken, names of spectrographs used, spectral resolution, and spectral range registered. The last column contains references to publications where fragments of low– or moderate–resolution spectra for corresponding stars can be found. The vast majority of our spectra were taken with the NES echelle spectrograph [42] at the Nasmyth focus of the 6-m telescope at the Special Astrophysical Observatory. These observations used a 2048 x 2048 CCD chip and image slicer [43]. The spectroscopic resolution was and the signal-to-noise ratio was S/N100. In addition to these spectra, we also used three spectra taken with the MAESTRO Coudè echelle spectrograph of the Mt. Terskol Observatory [43] and a spectrum taken with the PFES echelle spectrograph [44] at the primary focus of the 6–m telescope.
We extracted the one–dimensional spectra from the two–dimensional echelle frames using the modified [45] ECHELLE context of the MIDAS software package. We removed cosmic rays via median averaging of pairs of successive spectra. The final reduction (continuum tracing and continuum normalization, measurements of the radial velocities and equivalent widths) was done using the DECH20 software package [46], traditionally used at the SAO. In particular, this package includes a procedure for applying mutual wavelength shifts of the direct and mirror profile images, enabling measurement of the radial velocity of any feature of the profile. We performed the wavelength calibration using spectra of a Th–Ar hollow cathode lamp. Control and corrections of the position shifts between the stellar and lamp spectra were performed using telluric absorption and emission features; the residual systematic errors of the resulting radial velocities are no more than 1 km/s. All velocities discussed in this paper are heliocentric. The procedure used to measure the radial velocities Vr from the NES spectrograph spectra and sources of uncertainties are discussed in more detail in [47].
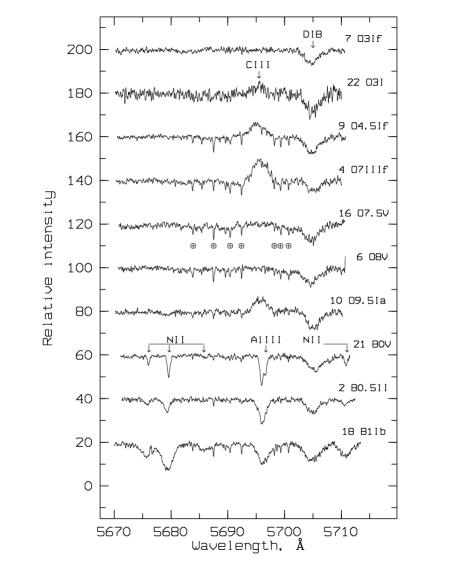
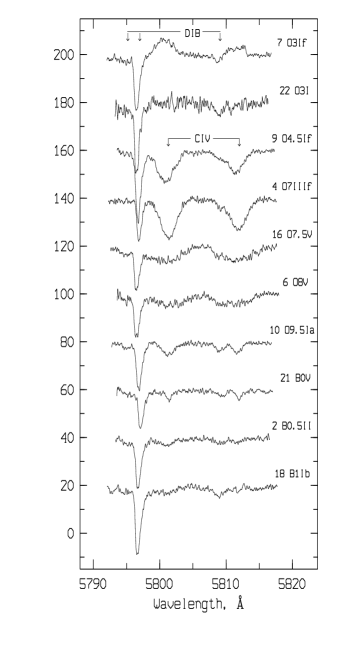
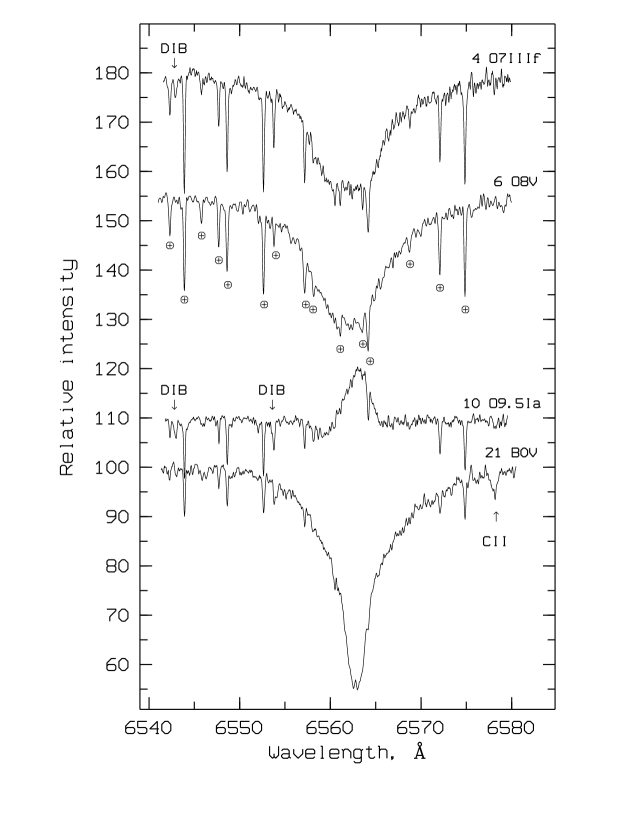
Since the question of correct laboratory wavelengths remains important for spectroscopy of O stars (values for high-order C, N, and O ions in various recent publications differ by as much as several km/s), thus we used the wavelengths from the NIST database (), after checking them using the spectra of the narrow line standard stars 10 Lac (O9 V) and HD 163800 (O7 III). The spectrum of the first star was taken from the NES archive and that of the second star from the library of the UVES spectrograph [48]. We used for the DIBs the wavelengths of [49], considered to be most reliable. Fragments of our spectra are displayed in Figs. 1 and 2. The continuum intensity in all the figures is taken to be 100. Selected data on the stars used to estimate their distances using the standard photometric parallax technique, along with the distances themselves, are presented in Table 2.
The spectral types for the O3–O8 stars were taken from the references given in the last column of Table 1; for the remaining stars, we refined these using available spectra. This refinement was motivated by doubts concerning association membership for stars No. 2, 10, and 18: they are located in its outskirts of the associaton, and their points in the HR–diagram are to the right of the MS but belower the upper MS. Differences between the new spectral types and those earlier used are not large, but quite distinct. For example, stars No. 2 and No. 18 have the same type, B1 I, in the spectroscopic survey of Kiminki et al. [10], while the types in our study are B0.5 II and B1 Ib, respectively. Figure 1 shows that the N II and Al III absorption becomes stronger while the C IV absorption disappears in the latter compared to the former star. Figure 2 illustrates the refinement of the luminosity class. Stars No. 10 and 21 are considered to be supergiants in [9], but their H profiles indicate that star No. 10 is indeed a supergiant, but star No. 21 is a dwarf.
However, our new classification of these three peripheral stars resulted in only small displacements of their data points in the HR–diagram, thus preserving their assumed evolutionary status of older-generation stars in the Cyg OB2 association [14]. Their estimated distances were likewise not significantly influenced; Table 2 shows that these distances are the same as the distances to the association’s central stars, within the errors; i.e., at least the interstellar components of their spectra should be no less informative than for the other stars.
2 Main results
2.1 Stellar radial velocities
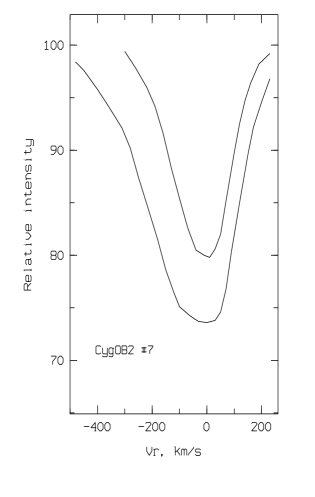
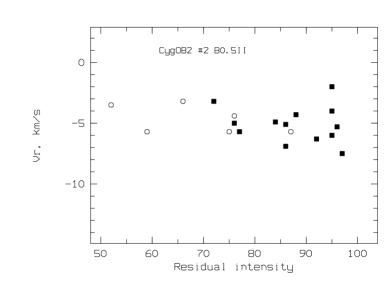
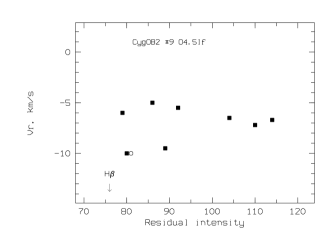
The radial velocity data Vr are collected in Table 3 (values are not presented for Cyg OB2 No. 12, as we will discuss them separately). The uncertainties of the Vr values for individual lines and averages over groups of lines can be judged from the scatter and number of symbols in Fig. 3, which displays Vr(r) relations for several stars. Along with the S/N, the accuracy of the Vr measurements is determined by a line’s width and intensity; because of this, the second column of Table 3 presents our estimates of the halfwidths of weak lines at the continuum level. For five stars also considered in [37], these values coincide with the V sin i estimates from [37] within the errors. Our O–star spectra provide 6–12 measurable lines, and our B–star spectra 30–50. Most of these are weak (deviations from the continuum level of no more than 20%). In all cases when the intensity difference in a line considerably exceeded the noise level, we measured the velocity for the absorption core or emission peak. This is especially important for early O stars, in which the profiles of sufficiently deep absorption lines are distorted by their winds. Figure 4 shows that these profiles are asymmetric: the red slope of the profile is steeper than the blue one, the red wing is shortened, and the blue wing is extended; i.e., there is a positive velocity gradient with depth. These signatures of direct P Cygni profile are the same for the H I, He I, and even He II lines. Velocities for lines with such profiles are labeled “P” in Table 3.
All the velocities presented in Table 3, with the exception of those for interstellar NaI (1) absorption features, are rounded to integer km/s. The remaining columns contain mean values derived from the C III, IV and N IV emission lines (column 3); the limiting mean velocities from absorption lines, approached in the transition from the deepest to the most shallow lines (r100) (column 4), derived using plots of the Vr (r) relations; the velocities derived from He I lines, from line , the single He I (11) 5875.72 Å for stars No. 7, 22, 4, and 10 and averaged from several lines for the other stars (column 5); the velocities for line cores or the absorption components of P Cygni profiles for the H and H lines (column 6 and 7, respectively); for comparison, the velocities of the same stars from other papers, with corresponding references (columns 11–12). For the two–spectra spectroscopic binaries Cyg OB2 No. 5 and No. 8, these are given with phases taken into account.
The differential line shifts we detected are no greater than 10 km/s, with the exception of two cases with considerable Balmer progressions (stars No. 9 and No. 10). However, only the data from column 4 or the weighted mean values of the data from columns 4 and 3 were used as “systemic” velocities, Vsys, describing the star as a whole. The mean Vsys for seven reliable association members is km/s. This differs considerably from the mean value for the velocities found for the same stars in [10] ( km/s), but coincides, within the errors, with the Vsys value found in [10] for several dozen stars ( km/s).
2.2 Radial velocities for the interstellar medium
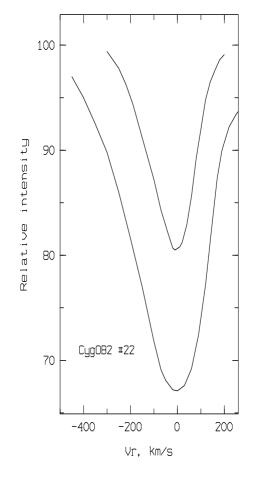
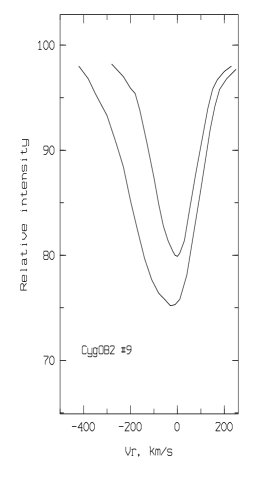
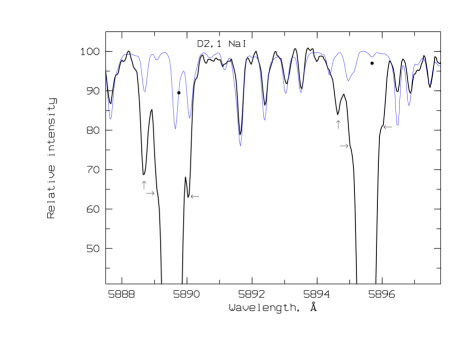
Lines of the interstellar medium are mainly represented in the NES spectrograph spectra by absorption lines of the Na I (1) doublet and numerous DIBs. In addition, the spectrum of star No. 5 acquired on September 14, 2011 exhibits lines of CH and CH+, and other spectra of the same star also contain K I and Ca II lines. Interstellar emission lines are not accessible to measurement. Revealing weak features of Na I (1) lines and measuring their parameters requires careful account of the telluric component of the spectrum. It is easy to recognize and remove the atmospheric Na I emissions that sometimes distort the lowest parts of the profiles. To remove water–vapor absorption lines, we took spectra of several suitable comparison stars with the same NES spectrograph and reduced them using the same techniques as for the Cyg OB2 stars. One of these is HR 4687, whose spectrum contains broad stellar ( km/s [53]) and very weak interstellar lines, so that the spectrum in the range of the Na I (1) doublet exhibits an undistorted set of atmospheric water–vapor absorption lines. Figure 5 displays a fragment of this spectrum, overlaid with the corresponding spectrum fragment for star No. 6 from Cyg OB2.
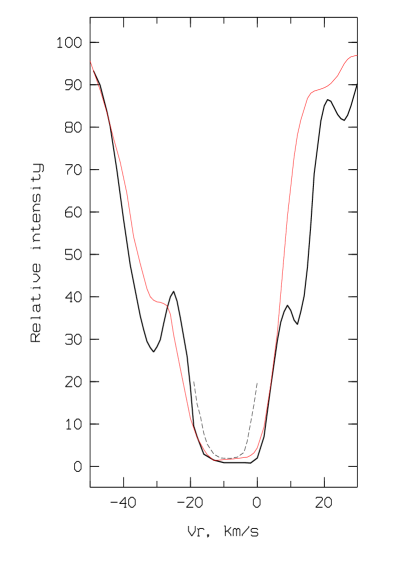
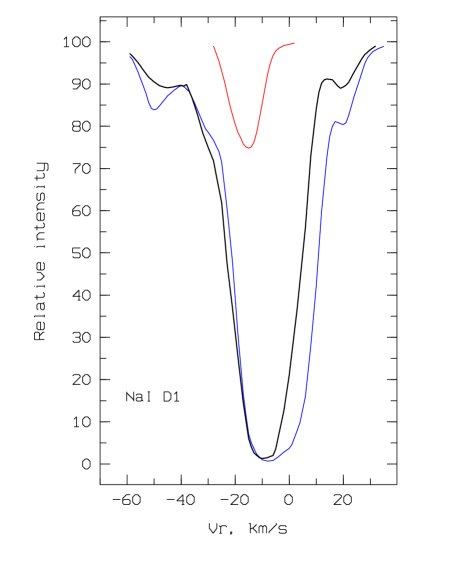
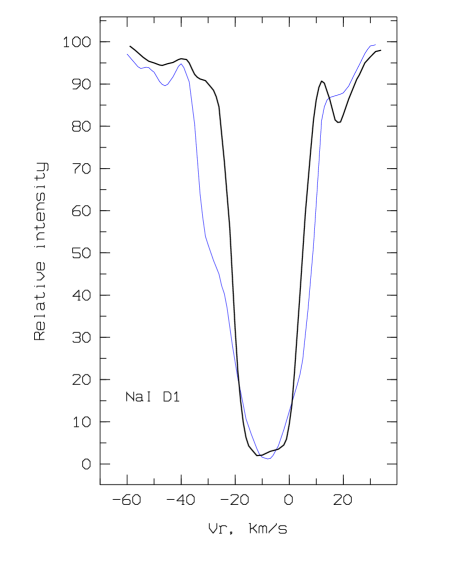
Profiles of the stronger D2 line of the Na I (1) doublet are shown in Fig. 6 for stars No. 9 and No. 22; Table 4 presents the parameters of these profiles for all the program stars. Figure 6 shows that, in each of the profiles, it is possible to identify a saturated trapezium–shaped component with shallower triangle components on either side. Figure 7 displays profiles of the weaker D1 line for 4 other association members. The residual intensity r is still present in its core: in the range km/s. Column 8 in Table 3 contains radial velocities for the cores of the main Na I (1) components taken as a whole (i.e., for their bisectors). However, since these components are fairly broad (15–22 km/s), and their slopes are steep and sometimes almost vertical, we found it useful to supplement these Vr values with those for the blue and red slopes (Vblue and Vred). These are presented, one below the other, in the third column of Table 4 for the r = 10 level in the D2 profiles of the association stars and for the r = 70 level in a foreground star. The following columns of Table 4 present the radial velocities and central depths of the side D2 components. Note that the side components are much weaker than the main ones; they are not visible in the well-traced profiles of the KI(1) lines presented in [54], and we were not able to detect them in our own spectra, even for the deepest and narrowest DIBs.
We can identify several indications that the deep, broad components of the Na I (1) lines are blends of narrower components. Multicomponent profiles of unsaturated interstellar lines (K I, etc.) are known for some of the stars (the corresponding references can be found in the last column of the line in Table 4). For example, the profile of the K I 7699 Å of star No. 12 was resolved in [54] into 5 individual components with velocities from to 9 km/s. The same is true for Na I (1) profiles if we consider bright stars located in the vicinity of the association in projection on the sky, but less distant than it. The main profile components of the stars P Cyg and 55 Cyg, whose distances are close to those of the Cyg OB2 association, are as saturated and broad as for the stars of our sample; for the less distant stars Cyg and Cyg, they are resolved into shallower and narrower (down to 1–2 km/s) components [57].
Finally, our spectra also provide some evidence that the main components have structure. Our spectroscopic resolution and exposure times were insufficient to detect features in deep cores, but do display an increase of the main components’ width due to the nearest side components. The data in Table 4 demonstrate that the largest depth (R 70) is reached by the components closest to the main ones, and Fig. 7 shows how these merge with the latter. This is obvious for the components with Vr km/s in the spectrum of star No. 21 (right panel of Fig. 7) and is not excluded for the red profile slopes in the spectrum of star No. 6, which are displaced by 6 km/s relative to those for star No. 16 (the left panel of Fig. 7).
Moreover, we also have evidence from the relative intensity of the main components of the Na I (1) absorptions: the shorter wavelength components among these are usually deeper than longer wavelength ones. Indirect evidence for this is provided by the K I (1) profiles in the spectra of stars No. 5 and 12 [54] and the evolution of the Na I (1) profiles with distance in the direction of Cyg OB2, which can be followed in high resolution spectra for bright stars. The nearby stars Cyg (d 50 pc) and 57 Cyg (d 150 pc) have single component, narrow, unsaturated D2 profiles, and the heliocentric Vr radial velocities derived from them are Vr = and km/s, respectively. For the more distant stars 59 Cyg (d0.4 kpc), Cyg, and Cyg (d kpc for both), in addition to isolated components at Vr km/s, close groups of components between Vr km/s and Vr km/s appear, with the depths of decreasing with wavelength [58]. The cores of the D1 lines of most of our program stars also show an increase in the residual intensity, from r at Vr km/s to r at Vr km/s. The profiles of the weaker CH Å interstellar lines (r = 71 and 60, and CH 4300 Å, respectively) in the spectrum of star No. 5 obtained on September 14, 2011 are clearly asymmetric: the red slopes rise from the cores at Vr km/s much less steeply than the blue slopes.
This can be related to the fact that the widths of the main components differ appreciably in our spectra (by a factor up to 1.5 for stars No. 2 and 6). Table 4 (column 3) shows that the D2 line at r = 10 is the narrowest for star No. 2: km/s (Fig. 6), and there is no Vblue or Vred value for any other star in this interval. This suggests we can use the above velocities as zero points, and the shifts of the blue and red profile slopes relative to these velocities as a measure of the profile width. Figure 8 displays the relative values of these widths for stars in the central region of the association. The sizes of the filled circles and squares in this figure are proportional to (Vblue) and (1.8 + Vred), respectively. The squares are larger than circles for all our stars: the main profile components are more broadened toward the red than toward the blue. The same is true for the differences from star to star: the largest and smallest amounts of broadening toward the red differ by 4.9 km/s, and toward the blue by only 2.6 km/s. The difference is still stronger for the D1 line: 6.3 and 2.5 km/s, respectively.
If the profile of the Na I (1) interstellar line is formed from an almost continuous series of narrow components, why should we single out their central condensation and consider it separately from the side components? Apart from the obvious methodical advantage of the clearer outlines of the profiles, the central component also stands out because it is formed along the entire line of sight, in contrast to the side components, which appear at the more distant end of the line of sight, possibly only close to Cyg OB2. This last suggestion is based on a comparison of spectra presented in [57, 58] and taken from the SAO spectroscopic archive: we can see no side components for stars in the direction of the association located at distances up to 1 kpc, whereas they are present for stars that are spatially close to the association. In particular, the Na I (1) profiles of the supergiants HD 194839 and HD 194279, which are separated from the center of Cyg OB2 by and , respectively, and lie at a distance of 1.8 kpc from the Sun, have components with Vr km/s that are comparatively deep as for stars No. 9 and No. 22, as well as weaker components with Vr km/s, and the star HD 195592 (at a distance of 1.8 kpc and separated from Cyg OB2 by ) has a component with Vr km/s.
Thus, it is natural to compare the intensities of main components of the Na I (1) profiles in the spectra of our program stars to the amount of interstellar absorption and the intensities of DIBs, which also accumulate along the entire line of sight. Recall, however, that the latter are not accumulated uniformly with distance. This is demonstrated for the interstellar extinction Av, for example, by Fig. 23 in [59]: the slow increase of Av to d 1.5 kpc in the direction of Cyg OB2 is followed by a jump by 3m in a layer only about 100 pc deep (an “extinction wall”). This nonuniformity is also characteristic of the variations of the depths and equivalent widths of the DIBs: half of these quantities accumulates for the Cyg OB2 stars by d 1.5 kpc.
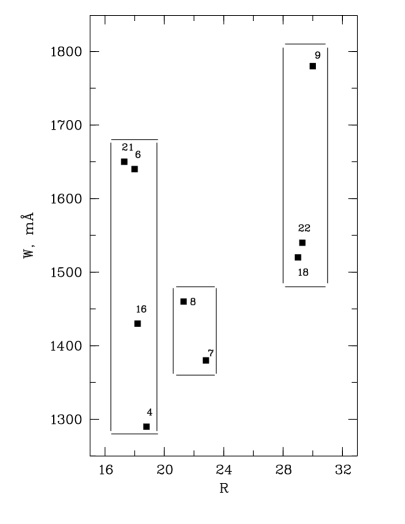
Table 5 presents the equivalent widths and depths for the Na (1) (1) doublet and for several DIBs (seven of more than 100 identified in the entire usable wavelength range). Figure 9 relates the intensities of Na I (1) lines and their main components to the depth of one of the strongest interstellar bands, the DIB. Since the equivalent width, which is a 5797 Å natural intensity measure for a line as a whole, loses its definiteness for the main component, we replaced this with the profile width at the r = 10 level; for better accuracy, we used sums for the D1 and D2 lines. The DIB in the central part of the depth of the 5797 Å association displayed in Fig. 9 varies by a factor of almost two, and the growth with its increase is obvious, as expected, both for W and for Vr.
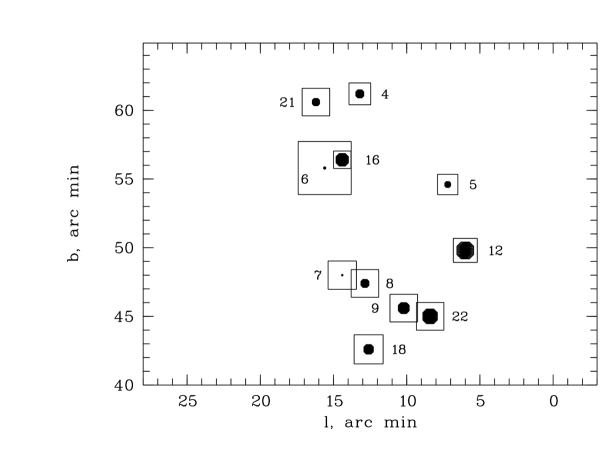
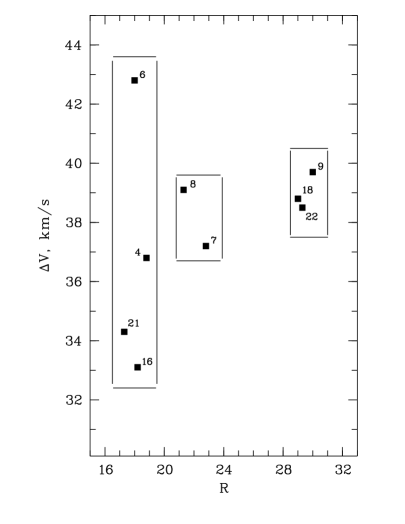
However, stars with similar DIB depths are not randomly distributed across the association field, and instead form compact groups, delineated by rectangles in Fig. 9. Only 2 to 4 DIB intensities are available in each of these groups, but it is possible to use many more Av estimates. Table 2 in [10] presents from 15 to 20 Av values for fields 3–5 in size that include the selected groups, and Fig. 4 from [10] demonstrates that these values are close to each other within the fields, but, like R(5797), differ considerably in different fields. The first of these, with stars No. 4, 6, 16, and 21, is in a relatively transparent field that is clearly seen in interstellar-extinction maps [60, 61]; the second field, with stars No. 7 and 8, and especially the third field, with stars No. 9, 22, and 18, are closer to its southern boundary, and their mean Av values are 4.3, 5.2, and 6.8, respectively. As follows from Fig. 9, as well as Figs. 7 and 8, the first group exhibits a large scatter of Na I (1) profile widths, i.e., of intensities of the main components at r = 10. This scatter is much lower in the second group and close to the measurement uncertainties in the third group. It is not surprising that the Vr values become closer for the two latter groups: both are clusters identified within the association, while an increased star density in the first group was noted only near star No. 4 [14, 18]. However, if we return to Table 4, we find that the scatter of Vblue is close to the measurement uncertainties for all three groups, and the mean values for the first and third groups differ by only 0.8 km/s (18.0 and 18.8 km/s, respectively).
In contrast to the widths of the lower profile sections, the total equivalent widths do not become closer in the transition from the first to the third group (Fig. 9). This already indicates that the equivalent width differences are due to the presence of side components in the profile. Indeed, the equivalent widths of the Na I (1) lines are correlated with the sum of the depths of their side components, and Figs. 6 and 7 provide a direct confirmation of this: the contribution of the side components to the equivalent widths is larger for star No. 9 than for star No. 22, as is also true for star No. 6 compared to star No. 16 and for No. 21 compared to star No. 4.
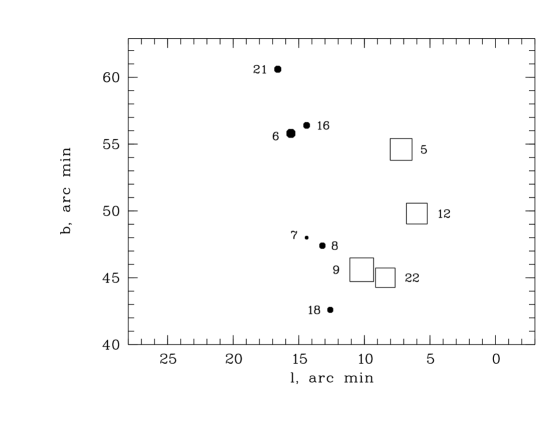
The relation between intensity and position is clearly shown by the side components of the Na I (1) line profiles: the depth of the side components decreases with distance from the main component, toward both the blue and the red. At the same time, at least the blue components are positioned similarly to the main components, as is shown by Fig. 10, which presents the dependence of the component depths and radial velocities on the star’s position in the central region of the association. To demonstrate this positional segregation more clearly, only sufficiently well separated components with distinct minima (like those for star No. 9 in Fig. 6) were selected for this figure; with our resolution, these appear at VVr, distances exceeding 10 km/s. The zones of the component mean values Vr and km/s are clearly separated: the former components are weak and observed only in the above relatively transparent window (upper left part of Fig. 10); the latter are much stronger, and are observed only towards the boundary, where the transparency is poorer (lower right part of the figure). It follows from Table 4 that the velocities and depths of the red side components are close only for stars No. 4, 6, 16, and 21 (Vr km/s, R ); the velocities of the rest of the stars are scattered from 12 to 41 km/s, and their depths range from 9 to 66. The total velocity range determined with the side components of the Na I (1) lines is at least 80 km/s ( km/s relative to the mean radial velocity of the association stars).
Our data naturally supplement the picture of the expansion of the interstellar medium and induced star formation under the influence of the winds from the brightest association stars, presented by molecular radio [62] and H spectroscopy [63]. Judging from the relation between the shifts and depths of blue components, the outflow velocity of the gas is the highest where its density is lowest. The red components are unrelated to the expansion, in contrast to the H emission profiles, and can be related to the formation of new stars and clusters of new stars. In particular, is it due to chance that star No. 9, which is projected on a dust cloud and molecular clump (“clump 1” in [64]), stands out in terms of the intensity of its red components?
2.3 Star No. 12
Strong H, weak H, and two weak Fe II emission lines near 7500 Å are present in our spectra of the Cyg OB2 star No. 12. There are only 2–3 strong He I lines (R 30) and the CII (2) and SiII (2) doublet (R 20) absorption lines; the depths of 90 % of the remaining lines do not exceed 10, and do not exceed 4 for half of them. As for the hotter stars in the association, the profiles of the strongest absorption lines of star No. 12 are asymmetric, with the same kind of asymmetry: the red slope is steeper than the blue one (Fig. 11). This suggests that their formation zone is not limited to the photosphere, and includes the base of the wind. Having in mind this possibility, we used our additional spectroscopic material together with spectra from [65] for the range 4100–4800 Å, which is not included in our observations, to estimate the spectral type of star No. 12, based solely on the weak, photospheric absorption lines. We compared the line groups N II and S II, Fe III and Fe II, etc., whose intensities reach their maxima in earlier or later spectral subtypes relative to the one we determined. This indicated somewhat earlier subtype than we found in [34]: B4 instead of B5. This result coincides with the estimate of Clark et al. [65]. This is also confirmed by a comparison of the spectrum of star No. 12 with the spectra of HD 168625 (B5.5 Ia0 [66]) and HD 80077 (B2.5 Ia 0 [67]), eliminating the effect of luminosity: both stars are hypergiants, the former being cooler and the latter hotter than star No. 12.
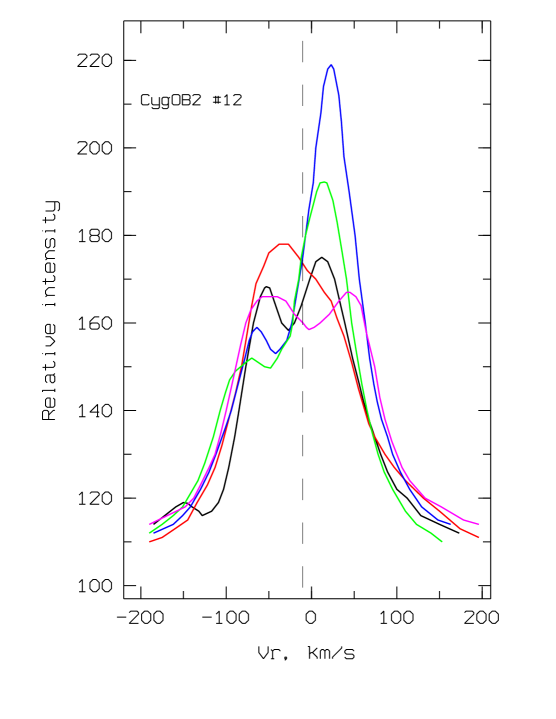
Velocities vary from epoch to epoch and also differ between groups of lines. Figure 12 displays the Vr (r) relations for the two dates with the largest radial velocity deviations: Vr (SiII) = km/s (April 12, 2003) and Vr (HeI) = 0 km/s (September 26, 2010).
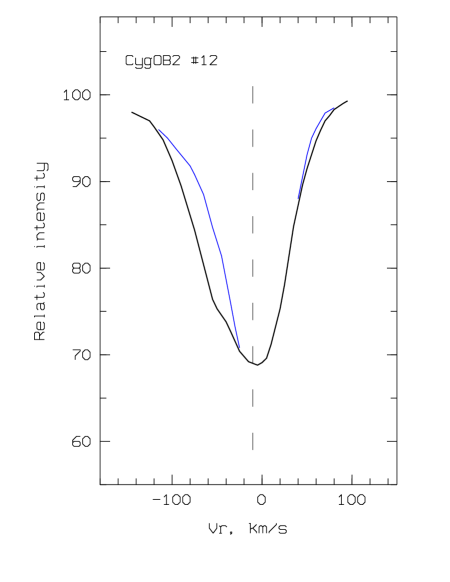
The velocity time variations in our data range from 13 to 21 km/s. In all cases, V (r is below Vsys, which can be interpreted as expansion with variable velocity, even of the deep atmospheric layers where the weakest absorption lines are formed. This seems to be in contradiction with the shifts of the strong relative to the weak absorption features: these shifts are lowest for the SiII (2) doublet, which even has a negative mean shift ( km/s), but positive (+4.8 km/s) for the CII (2) doublet, increasing to 13 km/s for the strongest HeI lines. However, as was mentioned above, these numbers were obtained from profile cores carrying information about the outer atmospheric layers, while their upper parts also indicate expansion. Figure 11 shows that the wings are displaced to the blue relative to the cores, and are stronger for deeper lines. As they rise toward the continuum, the profile bisectors deviate toward the left, to the velocities derived from the weakest lines or even lower. The blue wing is extended and the red one shortened (a hint of a P Cygni profile). For the strongest of the absorption features, the HeI 5876 line, we find Vr and 60 km/s for the blue and red wings at the r = 98 level in the spectrum taken on September 15, 2011, when the differential line shifts were the smallest; for comparison, the NII 5679 and SII 5433 lines had Vr and +42 km/s at the same residual intensity level.
The strong absorption features vary with time in their positions, intensities, and even profile shapes. Sometimes, apparently at the times of the greatest deepening of the core, the derived velocity approaches the velocity of the dip in the upper part of the H line. One such case, already noted in [34], was detected line on April 12, 2003 for the Si II 6347 Å (Fig. 11). Moreover, on December 8, 2006, the wind depression profile was even observed directly in the He I 5876 Å. This is shown in Fig. 13 together with the profile of the same line for September 15, 2011, which has been shifted horizontally so that the cores coincidence. We find a deepening at Vr km/s on the blue slope of the first spectrum. Unfortunately, the December 8, 2006 spectrum does not include the long–wavelength range containing the Si II 6347 Å and H lines, but it does include the H line, which has a weakly expressed P Cygni profile whose absorption component yields Vr km/s.
The differential line shifts and profile shapes line in the spectra for Cyg OB2 No. 12 are comparable to those for the hypergiants of similar spectral types mentioned above: HD 80077 (B2.5), HD 168625 (B5.5), and HD 183143 (B7) [68]. The strong lines of all these stars display the asymmetry described above; the first two exhibit positive shifts of the He I 5876 Å line core with respect to the weakest absorptions, though they are smaller than for No. 12, and the amplitudes of the velocity time variations are also smaller. The profile asymmetry observed for HD 80077 is especially striking. Several spectra of this southern star were kindly provided to us by G.A. Galazutdinov. Even the weak absorption lines are clearly asymmetric in them. Characteristic profiles of deeper lines in the spectrum, taken with the FEROS spectrograph [69], are shown in Fig. 14. The resolution is close to our own, facilitating comparison of Fig. 14 to Figs. 11 and 13. The profile of the He I 5876 Å absorption in HD 80077 is distorted by both a depression in its blue wing and weak emission in its red wing.
Combined data on radial velocities measured for various lines in the spectra of star No. 12, HD 80077, and HD 168625 are collected in Table 6. To facilitate comparison, we substracted Vsys from all the velocities; i.e. the table presents the differences Vr = VrVsys. Column (2) contains velocity estimates derived from emission lines; only the first estimate for star No. 12 (2001.06.12) was made from the forementioned weak Fe II emission features near 7500 Å, while the later, less reliable estimates are based on the wide pedestals of the H emission profiles. However, averaging results in a velocity that is consistent with Vsys = km/s for the association as a whole, confirming that this value can be used as the radial velocity of the star’s center of mass. Column (3) presents the limiting values to which the velocity differences converge in the transition from the strongest absorption features to weaker and weaker ones (r ). The latter absorption features, mainly N II, S II, Al III, and Si III lines, appear symmetric in the spectra of star No. 12 and HD 168625; this means that their velocities were measured for the profile as a whole. In contrast, the velocities in columns (4) and (5) are based on the cores of the asymmetric lines Si II (2) and He I 5876 Å (the estimates in brackets are for the depressions in the blue wings). The Vr estimates for the depressions and peaks in the H profiles are given in columns (6) and (7).
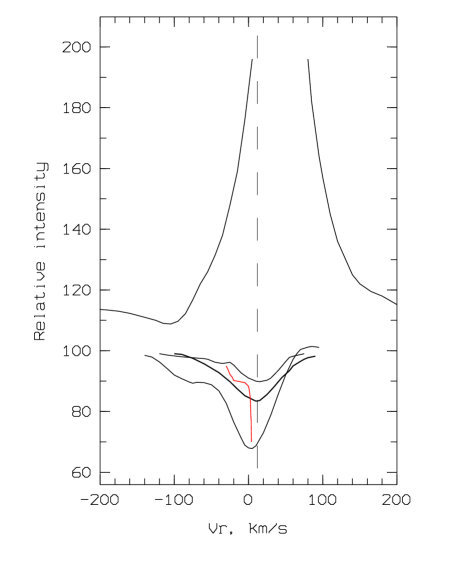
Figure 15 presents H profiles from 5 of our spectra. All of them, as well as the profiles presented in [65], are similar, and show strong bell–shaped emission lines with extended Thomson wings. The lower, symmetric part of the profile is more stable than the upper part. Variations are displayed mainly by the central region, at Vsys km/s. Intensity inversions are observed in this region in all the spectra, and only one of these clearly also shows a depression in the blue wing that is separated from the profile center by more than 100 km/s. An attempt was made in [65] to reproduce the observed H profile of star No. 12 using a model with a homogeneous, spherically symmetric wind. The model with a limiting expansion velocity of Vext = 400 km/s, which was considered to provide the best fit, yields a standard P Cygni profile that reproduces well only the broad wings and the red slope of the main emission, while the blue part with its typical absorption component is much lower than the blue slope of the observed profile. This is true even for the spectrum of April 12, 2003 reproduced in Fig. 11, in addition to the fact that the computed profile shows no central inversion.
The H profiles in the spectra of HD 80077 and HD 168625 are closer to the model ones; the absorption and emission extrema are separated by 150–250 km/s and are on opposite sides of the Vsys line. The extrema for star No. 12 are closer to each other, and both can occur on either side of the line. The wind is inhomogeneous: in addition to the continuously present, relatively high-velocity portion, it contains a variable, sometimes considerable, amount of matter that is almost stationary with respect to the star, or is even falling onto the star.
The presence of a slow component in the wind of star No. 12 is the only reliably detected phenomenon indicating that it is a member of the population of LBV stars, whose spectra (and even individual lines) can display the coexistence of direct and inverse P Cygni profiles.
Generally speaking, our data do not exclude the possibility that star No. 12 is a spectroscopic binary, but also do not confirm this hypothesis. Table 6 shows that the velocities change from epoch to epoch more strongly than the differential shifts of the absorption lines; at least partially, this could result from orbital motion. The broadened profile of the HeI 5876 line in Fig. 13 could be obtained from the superposition of the spectra of the components of a two-spectrum, low-amplitude binary (SB2), but its –velocity would be too far from Vsys. In addition, other absorption lines in the spectrum of December 8, 2006 are not broadened. So far, no traces of a second component have been detected in the spectrum, and it is reasonable to consider only the SB1 option — a single spectrum spectroscopic binary.
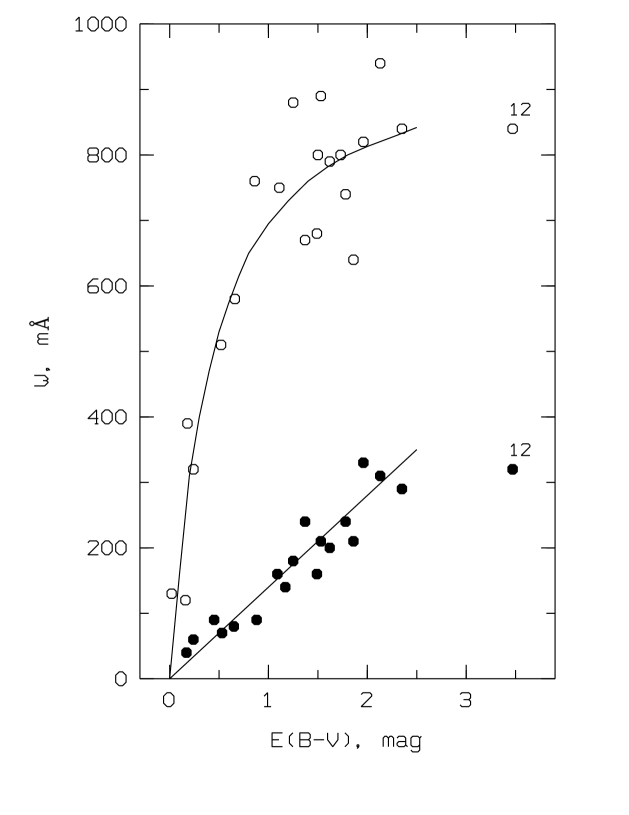
The anomalous reddening of star No. 12, in excess of that for neighboring association stars, could originate either in the line of sight relatively far from the star or in its envelope. The data collected in Table 5 tend to convince us in the second option. Figure 16 plots the equivalent widths of the D2 NaI line and 5797 Å DIB from this table versus the color excess E (B–V) for association stars, supplemented with analogous data for several foreground stars with E . Star No. 12 has repeatedly been included in studies of interstellar lines, probably in the hope of finding them abnormally strong. However, Fig. 16 shows that their intensities do not exceed the level reached in the spectra of the most reddened stars, and this is true not only for saturated Na I lines but also for DIBs remaining on the initial part of the curve of growth.
3 Conclusions
The high-spectral resolution of the observations considered here made it possible to use weak lines, enabling us to determine the main spatial and kinematic parameters of the association based on a small number of its members. Our estimates of the distance and systemic velocity (d = 1.7 kpc and Vsys = km/s) coincide, within the errors, with those derived from moderate resolution spectra using a much larger number of stars.
Moreover, we have spectroscopically confirmed age differences for stars representing different parts of the association. The stars of the northern group (No. 4, 6, 16, 21) are the oldest; from their positions in the HR–diagram, their ages are about 5 million years, and the available lines, including H, show no wind–related anomalies: they are symmetric absorption lines with minimal differential shifts. The stars towards the southern boundary of the association’s central part (No. 9, 22, 12, etc.) are at least half as old, the absorption lines in their spectra are asymmetric, and the strongest of these already display signatures of P Cygni profiles. Information on the distribution and motion of cool gas in the association’s center derived from our analysis of complex profiles of the Na I (1) doublet is likewise consistent with a scheme with cascade, possibly induced, star formation: the gas becomes denser from north to south, and the gas outflow becomes slower and is accompanied by accretion in the vicinity of the youngest stars.
Exploring this scheme in more detail for this scheme will require high-resolution spectroscopy for additional stars, first and foremost, in the region of the southern clusters. The possibility of comparing the spectra of stars located near each other in space is especially important for refinding our understanding of the structure of the interstellar medium using the weak side components of the Na I (1) lines; it is also possible to detect circumstellar features in this way (a transition from wind lines to interstellar lines).
Star No. 12 (B4 Ia) in the Cyg OB2 association is the only hypergiant, and the most evolved object among our program stars. Spectroscopic manifestations of its unstable wind are quite clear and characteristic of early B–hypergiants – not only the emission and absorption H profiles, but also the characteristic asymmetry of the He I, Si II, and other lines, as well as variations of their profiles with time and from line to line, up to a separation into photospheric and wind components for the strongest of them. At the same time, the H profile distinguishes star No. 12 from other known B hypergiants: it is formed in a slow wind that contains an accretion along with an excretion component. This last feature can be considered evidence that this star is an LBV object.
However, the characteristic features of this class of variable stars – a specific combination of brightness, color, and spectrum variations, an IR excess, and a dust circumstellar shell – remain to be searched for, as is also true of the star’s possible spectroscopic binarity. Such binarity could potentially reduce the extreme luminosity of the star by dividing it between the system components, but in a very artificial way: they would have to have very similar luminosities and also be virtually identical stars, since the spectrum does not allow a difference in their temperatures.
Another argument of LBV status would be a circumstellar origin for the anomalous reddening of star No. 12. However, thus far we have only indirect evidence for this: the interstellar Na I lines and DIBs in the line of sight of star No. 12 are not strong compared to the neighboring association members.
Having in mind the above findings, we will conclude by listing the main tasks for a further observational studies of Cyg OB2 and star No. 12:
-
•
Extending verified techniques to other association stars, beginning with those closest to already studied stars, and to nearby H II regions.
-
•
Obtaining higher resolution (R 100000) spectra for at least the brightest stars, to better trace their Na I(1) profiles and stellar absorption lines. On the other hand, spectra with R 2000 are needed to classify faint (V ) stars in the immediate vicinity of star No. 12.
-
•
The spectra we obtained are not sufficient to resolve the question of spectroscopic binarity for star No. 12, and thus monitoring is needed.
-
•
Speckle interferometry of star No. 12 in the visible and near–IR is needed.
Acknowledgements
This study was supported by the Russian Foundation for Basic Research (project 11–02–00319 a). The authors are grateful to G.A. Galazutdinov for providing spectra of the star HD 80077.
REFERENCES
-
1.
L. Münch and W. W. Morgan, Astrophys. J. 118 161 (1953).
-
2.
H. L. Johnson and W. W. Morgan, Astrophys. J. 119 344 (1954).
-
3.
D. H. Schulte, Astrophys. J. 124 530 (1956).
-
4.
D. H. Schulte, Astrophys. J. 128 41 (1958).
-
5.
V. C. Reddish, L. C. Lawrence, and N. M. Pratt, Publ. R. Observ. Edinburgh 5 111 (1966).
-
6.
P. Massey and A. B. Thompson. AJ 101 1408 (1991).
-
7.
J. Knodlseder, Astron. & Astrophys. 360 539 (2000).
-
8.
F. Comeron, A. Paqsuali, and G. Rodighiero, et al., Astron. & Astrophys. 389 874 (2002).
-
9.
M. M. Hanson, ApJ 597 957 (2003).
-
10.
D. C. Kiminki, H. A. Kobulnicky, K. Kinemuchi, et al., ApJ 664 1102 (2007).
-
11.
J. E. Drew, R. Greimel, M. J. Irwin, and S. E. Sale, MNRAS 386 1761 (2008).
-
12.
J. S. Vink, J. E. Drew, D. Steeghs, et al., MNRAS 387 308 (2008).
-
13.
F. Comeron, A. Paqsuali, F. Figueras, and J. Torra, Astron. & Astrophys. 486 453 (2008).
-
14.
I. Negueruela, A. Marco, A. Herrero, and J. S. Clark, Astron. & Astrophys. 487 575 (2008).
-
15.
N. J. Wright, J. J. Drake, J. E. Drew, and J. S. Vink, ApJ 713 871 (2010).
-
16.
C. Weidner, I. A. Bonnell, and H. Zinnecker, ApJ 724 1503 (2010).
-
17.
J. S. Clark, I. Negueruela, B. Ritchie, et al., Messenger, No. 142 31 (2010).
-
18.
E. Bica, Ch. Banatto, and C. M. Dutra, Astron. & Astrophys. 405 991 (2003).
-
19.
W. W. Morgan, H. L. Johnson, and N. G. Roman, PASP 66 85 (1954).
-
20.
W. A. Hiltner, ApJ Suppl. Ser. 2 389 (1956).
-
21.
S. Sharpless, PASP 69 239 (1957).
-
22.
C. Leitherer, O. Stahl, B. Wolf, and C. Bertout, Astron. & Astrophys. 140 199 (1984).
-
23.
R. M. Humphreys and K. Davidson, PASP 106 1025 (1994).
-
24.
A. M. van Genderen, Astron. & Astrophys. 366 508 (2001).
-
25.
J. S. Clark, V. M. Larionov, and A. Arkharov, Astron. & Astrophys. 435 239 (2005).
-
26.
E. W. Gottlieb and W. Liller, ApJ 225 488 (1978).
-
27.
P. R. Wozniak, W. T. Vestrand, C. W. Akerlof, et al., AJ 127 2436 (2004).
-
28.
C. Sterken, T. Arentoft, H. W. Duerbeck, and E. Borgt, Astron. & Astrophys. 349 532 (1999).
-
29.
H. J. Wendker and W. J. Altenhoff, Astron. & Astrophys. 92 L5 (1980).
-
30.
J. H. Bieging, D. C. Abbott, and E. B. Churchwell, ApJ 340 518 (1989).
-
31.
G. E. Bromage, Nature 230 172 (1971).
-
32.
S. P. Souza and B. L. Lutz, ApJ Lett. 235 L87 (1980).
-
33.
L. M. Hobbs, D. G. York, J. A. Thorburn, et al., ApJ 705 32 (2009).
-
34.
V. G. Klochkova and E. L. Chentsov, Astron. Rep. 48 1005 (2004).
-
35.
M. E. Contreras, G. Montes, and F. P. Wilkin, Rev. Mex. Astron. Astrofis. 40 53 (2004).
-
36.
L. Luud, T. Tuvikene, and M. Ruuzalepp, Astrofizika 29 97 (1988).
-
37.
A. Herrero, L. J. Corral, M. R. Villamariz, and E. L. Martin, Astron. & Astrophys. 348 542 (1999).
-
38.
A. Sota, J. Maiz Apellaniz, N. R. Walborn, et al., ApJ Suppl. Ser. 193 24 (2011).
-
39.
N. R. Walborn, A. Sota, J. Maiz Apellaniz, et al., ApJ Lett. 711 L143 (2010).
-
40.
Y. Naze, M. De Becker, G. Rauw, and C. Barbieri, Astron. & Astrophys. 483 543 (2008).
-
41.
A. Herrero, J. Puls, and M. R. Villamariz, Astron. & Astrophys. 354 193 (2000).
-
42.
V. E. Panchuk, V. G. Klochkova, M. V. Yushkin, and I. D. Najdenov, J. Optical Technology 76 42 (2009).
-
43.
F. A. Musaev, G. A. Galazutdinov, A. V. Sergeev, et al., Kinem. Fiz. Nebesn. Tel 15 282 (1999).
-
44.
V. E. Panchuk, I. D. Najdenov, V. G. Klochkova, et al., Bull. Spec. Astrophys. Observ. 44 127 (1997).
-
45.
M. V. Yushkin and V. G. Klochkova, Preprint Spets. Astrofiz. Observ. No.206 (2005).
-
46.
G. A. Galazutdinov, Preprint Spets. Astrofiz. observ. No.92 (1992).
-
47.
V. G. Klochkova, V. E. Panchuk, M. V. Yushkin, and D. S. Nasonov, Bull. Spec. Astrophys. Observ. 63 410 (2008).
-
48.
S. Bagnulo, E. Jehin, C. Ledoux, et al., Messenger No.114, 10 (2003).
-
49.
G. A. Galazutdinov, F. A. Musaev, J. Krelowski, and G. A. H. Walker, PASP 112 648 (2000).
-
50.
J. Maiz Apellaniz, Astron. & Astrophys. 518 A1 (2010).
-
51.
M. De Becker, G. Rauw, and J. Manfroid, Astron. & Astrophys. 424 L39 (2004).
-
52.
G. Rauw, J.-M. Vreux, and B. Bohannan, ApJ 517 416 (1999).
-
53.
F. Royer, J. Zorec, and A. E. Gomez, Astron. & Astrophys. 463 671 (2007).
-
54.
B. J. McCall, K. H. Hinkle, T. R. Geballe, et al., ApJ 567 391 (2002).
-
55.
F. H. Chaffee and R. E. White, ApJ Suppl. Ser. 50 169 (1982).
-
56.
R. Gredel and G. Münch, Astron. & Astrophys. 285 640 (1994).
-
57.
D. E. Welty and L. M. Hobbs, ApJ Suppl. Ser. 133 345 (2001).
-
58.
L. M. Hobbs, ApJ 157 135 (1969).
-
59.
S. E. Sale, J. E. Drew, Y. C. Unruh, et al., MNRAS 392 497 (2009).
-
60.
K. Dobashi, Publ. Astron. Soc. Japan. 63 1 (2011).
-
61.
N. Schneider, S. Bontemps, R. Simon, et al., Astron. & Astrophys. 529 A1 (2011).
-
62.
N. Schneider, S. Bontemps, R. Simon, et al., Astron. & Astrophys. 458 855 (2006).
-
63.
T. G. Sitnik, T. A. Lozinskaya, and V. V. Pravdikova, Astron. Lett. 33 814 (2007).
-
64.
Y. M. Butt, N. Schneider, T. M. Dame, and Ch. Brunt, ApJ Lett. 676 L123 (2008).
-
65.
J. S. Clark, F. Najarro, I. Negueruela, et al., ApJ 541 145 (2012).
-
66.
V. G. Klochkova, E. L. Chentsov, N. S. Tavolzhanskaya, and G. A. Proskurova, Preprint Spec. Astrophys. Observ. No.183 (2003).
-
67.
G. Knoechel and A. F. J. Moffat, Astron. & Astrophys. 110 263 (1982).
-
68.
E. L. Chentsov, Astron. Lett. 30 325 (2004).
-
69.
A. Kaufer, O. Stahl, S. Tubbesing, et al., Messenger 95 8 (1999).
| Star | Date | Spectrograph | R | , Å | Reference |
| Stars in Cyg OB2: | |||||
| No. 2 | 25.07.07 | NES | 60000 | 4555–6015 | [6] |
| No. 4 | 1.09.04 | NES | 60000 | 5275–6770 | [37, 38] |
| No. 5 | 31.08.97 | MAESTRO | 40000 | 3900–8630 | [38] |
| 14.11.97 | MAESTRO | 40000 | 3900–9240 | ||
| 14.09.11 | NES | 60000 | 4100–6900 | ||
| No. 21 | 18.11.10 | NES | 60000 | 5215–6690 | [10, 37] |
| No. 16 | 10.06.11 | NES | 60000 | 4850–6240 | [6] |
| No. 12 | 12.06.01 | PFES | 15000 | 4900–7780 | [10, 34] |
| 12.04.03 | NES | 60000 | 5270–6770 | ||
| 8.12.06 | NES | 60000 | 4470–5940 | ||
| 26.09.10 | NES | 60000 | 5210–6690 | ||
| 19.11.10 | NES | 60000 | 5210–6690 | ||
| 15.09.11 | NES | 60000 | 4900–6900 | ||
| No. 6 | 3.06.10 | NES | 60000 | 5300–6690 | [6] |
| 4.06.10 | NES | 60000 | 4465–5930 | ||
| No. 22 | 10.06.11 | NES | 60000 | 4850–6240 | [37, 38] |
| No. 9 | 3.08.09 | NES | 60000 | 4400–5860 | [37, 39, 49] |
| 31.07.10 | NES | 60000 | 4465–5930 | ||
| No. 7 | 9.06.11 | NES | 60000 | 4850–6240 | [38, 41] |
| No. 8А | 30.09.99 | MAESTRO | 40000 | 3800–9240 | [6, 39] |
| 30.08.04 | NES | 60000 | 5300–6710 | ||
| No. 18 | 24.07.07 | NES | 60000 | 4555–6015 | |
| No. 10 | 28.08.04 | NES | 60000 | 5300–6710 | [37] |
| Foreground star BD +41°3814 | |||||
| 12.01.11 | NES | 60000 | 5200–6680 | ||
| Note: The first column presents the star numbers from [4] | |||||
| Sp | Mv | V | B–V | Av | d | ||
| mag | mag | mag | mag | кпк | |||
| Stars in Cyg OB2 | |||||||
| No. 7 | 20h33m14s | O3 If | 10.55 | 1.45 | 5.3 | 2.0 | |
| 41°2022 | |||||||
| No. 22 | 20h33m08s | O3 I | : | 11.55 | 2.04 | 7.0 | 1.8: |
| 41°1318 | (+ O6 V) | ||||||
| No. 9 | 20h33m11s | O4.5 If | 10.96 | 1.81 | 6.4 | 1.7 | |
| 41°1508 | |||||||
| No. 8A | 20h33m15s | O5 III | 9.06 | 1.30 | 4.9 | 1.5 | |
| 41°1850 | |||||||
| No. 4 | 20h32m14s | O7 IIIf | 10.23 | 1.19 | 4.5 | 1.8 | |
| 41°2712 | |||||||
| No. 5 | 20h32m22s | O7 If | : | 9.21 | 1.43 | 5.2 | 1.6: |
| 41°1819 | |||||||
| No. 16 | 20h32m39s | O7.5 V | 10.84 | 1.19 | 4.5 | 1.8 | |
| 41°2514 | |||||||
| No. 6 | 20h32m45s | O8 V | 10.68 | 1.25 | 4.7 | 1.5 | |
| 41°2537 | |||||||
| No. 21 | 20h32m28s | B0 V | 11.42 | 1.00 | 3.9 | 1.8 | |
| 41°2852 | |||||||
| No. 12 | 20h32m41s | B5 Ia-0 | : | 11.46 | 3.30 | 10.0 | 1.6: |
| 41°1429 | |||||||
| Маловероятные члены Cyg OB2 | |||||||
| No. 10 | 20h33m46s | O9.5 Iab | 9.88 | 1.59 | 5.6 | 1.4 | |
| 41°3301 | |||||||
| No. 2 | 20h31m22s | B0.5 II | 10.64 | 1.20 | 4.3 | 2.0 | |
| 41°3128 | |||||||
| No. 18 | 20h33m31s | B1 Ib | 11.01 | 1.77 | 5.9 | 1.5 | |
| 41°1523 | |||||||
| BD +41°3814 | |||||||
| 20h34m57s | B8 V | +0.1 | 7.59 | 0.0 | 0.3 | ||
| 41°4304 | |||||||
| Notes: The number in the first column is from [4]. Star No. 22 | |||||||
| is a close visual double with a component separation of 1.5 arc.sec and | |||||||
| a component magnitude difference of 0.6m [50]. The fourth column | |||||||
| presents the spectral types of the primary (and, in one single case, | |||||||
| secondary) components according to [38]. The components were not resolved | |||||||
| in our spectra, but the contribution from the secondary is appreciable: | |||||||
| we clearly see N IV 5200-–5205 Å absorbtion and 6215, 6220 Å | |||||||
| emission lines, and the absorbtion and emission lines are weaker than in | |||||||
| the spectrum of star No. 7; the C IV 5801, 5812 Å lines appear in | |||||||
| emission in the spectrum of star No. 7 and are absent from the spectrum | |||||||
| of star No. 22; on the contrary, the C III 5696 Å emission is | |||||||
| not visible for the former star but is visible for the latter (Fig. 1. | |||||||
| Vr, km/s | |||||||||||
| Star | Vr | Emis | HeI | H | H | NaI (1) | DIB | systemic | other studies | Ref | |
| 1 | 2 | 3 | 4 | 5 | 6 | 7 | 8 | 9 | 10 | 11 | 12 |
| No. 7 | 90 | –13 | –10 | –12P | –13P | –7.4 | –11 | –11 | –28 | [10] | |
| No. 22 | 120: | –12 | –12 | –20: | –16P | –9.0 | –10 | –12 | |||
| No. 9 | 130 | –7 | –8 | –10P | –30P | –200P | –7.9 | –10 | –8 | –16 | [10, 40] |
| No. 8A | –56 | –55: | –65: | –60 | –67 | –9.0 | –11 | –68 | [51] | ||
| +40: | +40: | +40 | |||||||||
| No. 4 | 130 | –12 | –7 | –13 | –18 | –8.1 | –10 | –8 | –6 | [10] | |
| No. 5 | +42 | –8.6 | –11 | +40 | [52] | ||||||
| –250: | –265 | (31.08.97) | |||||||||
| No. 5 | –95 | –8.4 | –11 | –105 | (14.11.97) | ||||||
| +190: | +200 | ||||||||||
| No. 5 | –8.2 | –10 | (14.09.11) | ||||||||
| No. 16 | 220 | –11: | –13: | –19 | –9.4 | –10 | –11: | –15 | [10] | ||
| No. 6 | 230: | –11 | –11 | –19 | –17 | –5.7 | –10 | –11 | –12 | [10] | |
| No. 10 | 90 | –10 | –9 | –18 | –165P | –9.0 | –10 | –9 | –5: | [10] | |
| No. 21 | 30 | –14 | –16 | –16 | –8.0 | –11 | –14 | –14 | [10] | ||
| No. 2 | 55 | –6 | –6 | –4 | –8.6 | –8 | –6 | –5 | [10] | ||
| No. 18 | 95 | –5 | –5 | –2 | –8.2 | –9 | –5 | –6 | [10] | ||
| BD +41°3814 | |||||||||||
| 120 | –16 | –11 | –12 | –15.2 | –16: | –15 | |||||
| Note: The first column is the star number from [4] and the second column the line width Vr in km/s. | |||||||||||
| Star | l, degree | Vblue | Vr | Remarks | ||||
| b, degree | Vred | R | ||||||
| No. 12 | 80.10 | –19.3 | –33 | +21 | +34 | K I [54, 55] | ||
| 0.83 | +1.5 | 64 | 19 | 9 | C2 [54, 56] | |||
| CO [54] | ||||||||
| No. 5 | 80.12 | –17.8 | –34 | +30: | +41: | K I [54, 55] | ||
| 0.91 | +1.0 | 67 | 11: | 18: | C2 [54, 56] | |||
| CH [54] | ||||||||
| No. 22 | 80.14 | –19.0 | –32 | +19: | ||||
| 0.75 | +2.0 | 60: | 10 | |||||
| No. 9 | 80.17 | –18.5 | –31 | +12 | +27 | K I [55] | ||
| 0.76 | +2.0 | 73 | 66 | 19 | ||||
| No. 2 | 80.18 | –17.0 | –50 | –28: | +17 | |||
| 1.20 | –1.8 | 15 | 52: | 5 | ||||
| No. 18 | 80.21 | –18.3 | –51: | –38: | ||||
| 0.71 | +2.2 | 15 | 34: | |||||
| No. 8A | 80.22 | –19.1 | –49 | –29: | K I [55] | |||
| 0.79 | +2.0 | 17 | 52: | |||||
| No. 7 | 80.24 | –17.2 | –54: | –29: | +14: | |||
| 0.80 | +2.1 | 9 | 26: | 35 | ||||
| No. 16 | 80.24 | –18.7 | –47 | –29: | +19 | |||
| 0.94 | +0.6 | 18: | 44: | 19 | ||||
| No. 6 | 80.26 | –17.3 | –50 | –29: | +20 | |||
| 0.93 | +5.5 | 25 | 32: | 30 | ||||
| No. 4 | 80.22 | –18.1 | –49 | –33: | +18 | |||
| 1.02 | +1.2 | 11 | 16: | 27 | ||||
| No. 21 | 80.27 | –18: | –53 | –46 | –28: | +19 | ||
| 1.01 | +2: | 14 | 19 | 75: | 20 | |||
| No. 10 | 80.47 | –19.8 | –50: | –34: | K I [55] | |||
| 0.85 | +1.5 | 3: | 8 | |||||
| BD+41°3814 | ||||||||
| 80.74 | ||||||||
| 0.77 | ||||||||
| Note. The first column gives the star number from [4]. | ||||||||
| W(D2) | WR for DIB | ||||||||
| W(D1) | = | 5494 | 5780 | 5797 | 5849 | 6196 | 6379 | 6613 | |
| No. 12 | 0.84 | 0.06 | 0.88 | 0.32 | 0.13 | 0.11 | 0.16 | 0.38 | |
| 0.75 | 10 | 37 | 31 | 15 | 20 | 22 | 32 | ||
| No. 5 | 0.80 | 0.04 | 0.80 | 0.09: | 0.09 | 0.10 | 0.30 | ||
| 0.67 | 06 | 33 | 10: | 17 | 15 | 27 | |||
| No. 22 | 0.84 | 0.07 | 0.99 | 0.29 | 0.08 | 0.11 | |||
| 0.70 | 08 | 44 | 29: | 10: | 21 | ||||
| No. 9 | 0.94 | 0.07 | 1.02 | 0.31: | 0.14 | ||||
| 0.83 | 09: | 40 | 30: | 14 | |||||
| No. 2 | 0.67 | 0.04: | 0.79 | 0.24 | 0.09: | ||||
| 0.55 | 06 | 32 | 21 | 08 | |||||
| No. 18 | 0.82 | 0.06: | 1.03 | 0.33: | 0.12 | ||||
| 0.69 | 08: | 42 | 29 | 12 | |||||
| No. 8A | 0.79 | 0.06 | 0.85 | 0.20 | 0.09 | 0.10 | 0.12 | 0.34 | |
| 0.67 | 08 | 34 | 21 | 09 | 18 | 16 | 29 | ||
| No. 7 | 0.74 | 0.06: | 0.80 | 0.24 | 0.10 | 0.09 | |||
| 0.64 | 07 | 33 | 23 | 10 | 17 | ||||
| No. 16 | 0.80 | 0.03 | 0.78 | 0.07 | 0.09 | ||||
| 0.63 | 04 | 33 | 18: | 07: | 18 | ||||
| No. 6 | 0.89 | 0.04: | 0.79 | 0.21 | 0.06: | 0.09 | 0.07 | 0.30 | |
| 0.75: | 05 | 33 | 18 | 07 | 16 | 21 | 24 | ||
| No. 4 | 0.68: | 0.05: | 0.68: | 0.16: | 0.06: | 0.08 | 0.09: | 0.30 | |
| 0.61: | 07: | 30 | 19 | 08: | 15: | 13: | 25 | ||
| No. 21 | 0.89 | 0.05 | 0.78 | 0.18: | 0.07: | 0.08 | 0.08: | 0.28 | |
| 0.76 | 06 | 31 | 17 | 05 | 15 | 10 | 23 | ||
| No. 10 | 0.64 | 0.06: | 1.08 | 0.21 | 0.07: | 0.11 | 0.10 | 0.38 | |
| 0.57 | 07 | 45 | 19 | 07 | 20 | 14 | 31 | ||
| BD +41°3814 | |||||||||
| 0.13 | 0.04: | 0.01: | |||||||
| 0.07 | |||||||||
| Дата | Vr = (VrVsys), km/s | |||||
|---|---|---|---|---|---|---|
| Emis | r | SiII (2) | HeI | H–abs | H–emis | |
| CygOB2 No. 12 | ||||||
| 12.06.01 | 0 | :, 55 | ||||
| 12.04.03 | : | , | ||||
| 8.12.06 | 5() | |||||
| 26.09.10 | ||||||
| 19.11.10 | : | : | 13(): | :, : | ||
| 15.09.11 | : | :, | ||||
| HD 80077 | ||||||
| 2() | 34 | |||||
| HD 168625 | ||||||
| 2: | 2 | 50 | ||||