Optical signatures of the Charge of a Dielectric Particle in a Plasma
Abstract
With an eye on dust particles immersed into an ionized gas, we study the effect of a negative charge on the scattering of light by a dielectric particle with a strong transverse optical phonon resonance in the dielectric constant. Surplus electrons alter the scattering behavior of the particle by their phonon limited conductivity in the surface layer (negative electron affinity) or in the bulk of the particle (positive electron affinity). We identify a charge-dependent increase of the extinction efficiency for low frequencies, a shift of the extinction resonance above the transverse optical phonon frequency, and a rapid variation of the polarization angles over this resonance. These effects could be used for non-invasive optical measurements of the charge of the particle.
pacs:
42.25.Bs, 42.25.Fx, 52.27.LwI Introduction
Charged dust particles embedded in a plasma environment are an ubiquitous phenomenon in nature.Mendis (2002); Ishihara (2007) They are found in the interstellar medium,Spitzer (1982); Mann (2008) planetary magnetospheres,Grün et al. (1984) the upper atmosphere,Friedrich and Rapp (2009) and in industrial plasmas.Hollenstein (2000) Dusty laboratory plasmas,Piel and Melzer (2002) containing self-organized dust clouds, serve moreover as model systems for studying the dynamic behavior of strongly Coulomb-correlated systems of finite extent.
From the plasma physics point of view, the most important property of a dust particle is the charge it accumulates from the plasma. It controls the coupling to other dust particles and to external electromagnetic fields as well as the overall charge balance of the plasma. As a consequence various methods have been devised to measure the particle charge. They range from force balance methods for particles drifting in the plasma Khrapak et al. (2005) or trapped in the plasma sheath Tomme et al. (2000); Carstensen et al. (2011) to methods based on wave dispersion,Homann et al. (1997) normal mode analysis,Melzer (2003) and dust cluster rotation.Carstensen et al. (2010) Yet, the precise determination of the particle charge in a plasma environment remains a challenge. Methods independent of the plasma parameters,Homann et al. (1997); Melzer (2003); Carstensen et al. (2010) which are usually not precisely known, require specific experimental configurations, long measurement times or cannot yield the charge of individual dust particles. The phase-resolved resonance method,Carstensen et al. (2011) for instance, allows only a precise relative charge measurement. For an absolute charge measurement the potential profile in the vicinity of the particle has to be additionally obtained by Langmuir probe measurements which however are only about 20% accurate. Thus an optical measurement of the particle charge, independent of the plasma parameters, would be extremely useful.
The scattering of light by a small particle (Mie scattering Mie (1908)) encodes—at least in principle—the particle charge.Bohren and Hunt (1977); Bohren and Huffman (1983); Klačka and Kocifaj (2007, 2010); Heifetz et al. (2010); Heinisch et al. (2012a) It enters the scattering coefficients through the electrical conductivity of the surplus electrons which modifies either the boundary conditions for the electromagnetic fields or the polarizability of the particle. To assess how and at which frequencies charges are revealed by the Mie signal requires however not only a microscopic calculation of the surface and bulk conductivities but also a detailed analysis of the conductivities’ impact on the different scattering regimes the particle’s dielectric constant gives rise to.
So far, the dependence of the Mie signal on the particle charge has not been investigated systematically. In our previous work Heinisch et al. (2012a) we made a first step to clarify this issue which has also been raised by Rosenberg.Rosenberg (2012a) We identified the extinction at anomalous optical resonances of dielectric particles with a strong transverse optical (TO) phonon resonance in the dielectric constant to be sensitive to surplus electrons. In the present work we give a more comprehensive survey of Mie scattering by small negatively charged dielectric particles. Our aim is to identify over the whole frequency range, not only in the vicinity of anomalous resonances, features in the Mie signal which respond to surplus electrons. From these features the surplus electron density of the particle could be determined optically via light scattering.
After a brief outline of the Mie theory of light scattering by small charged particles in the next section, we present in Section III results for the four generic scattering features which occur for a charged dielectric particle with a strong resonance in the dielectric constant at the TO phonon frequency : low-frequency scattering, ordinary resonances below , anomalous resonances above , and high-frequency scattering. We investigate the intensity of the Mie signal and its polarization. Thereby we include ellipsometric techniques into our considerations. Section IV finally summarizes the results and points out possibilities for an optical measurement of the particle charge.
II Theory
The scattering behavior of an uncharged dielectric particle is determined by its radius and frequency-dependent dielectric constant . For a negatively charged dielectric particle light scattering is also influenced by the electric conductivity of the surplus electrons. Whether surplus electrons are trapped inside the particle or in a surface layer around it depends on the electron affinity of the particle.Heinisch et al. (2012a)
For , as it is the case for instance for MgO and LiF,Rohlfing et al. (2003) the conduction band inside the dielectric is above the potential outside the particle. Electrons do not penetrate into the dielectric. Instead they are trapped in the image potential in front of the surface.Heinisch et al. (2012b); Heinisch et al. (2011) The image potential is due to a surface mode associated with the TO phonon. The interaction of an electron with the surface mode comprises a static part, which induces the image potential,Evans and Mills (1973); Barton (1981) and a dynamic part, which enables momentum relaxation parallel to the surface limiting the surface conductivity.Kato and Ishii (1995) The phonon-limited surface conductivity , calculated in our previous work Heinisch et al. (2012a) using the memory function approach,Götze and Wölfle (1972) modifies the boundary condition for the magnetic field at the surface of the grain.Bohren and Hunt (1977)
For , as it is the case for instance for Al2O3, Cu2O and PbS, the conduction band inside the dielectric lies below the potential outside the particle. Electrons thus accumulate in the conduction band where they form an extended space charge.Heinisch et al. (2012b) Its width, limited by the screening in the dielectric, is typically larger than a micron. For micron-sized particles we can thus assume a homogeneous electron distribution in the bulk. The bulk conductivity is limited by scattering with a longitudinal optical (LO) phonon Mahan (1990) and can be also calculated Heinisch et al. (2012a) within the memory function approach. The bulk conductivity of the surplus electrons leads to an additional polarizability per volume which alters the refractive index.
The scattering behavior of the particle is controlled by the scattering coefficients. They are determined by expanding the incident () plane wave into spherical vector harmonics and matching the reflected () and transmitted () waves at the boundary of the sphere.Stratton (1941); Bohren and Huffman (1983) In the case of the boundary conditions at the surface are given by for . For the surface charges may sustain a surface current which is induced by the parallel component of the electric field and proportional to the surface conductivity. This changes the boundary condition for the magnetic field to , where is the velocity of light. The boundary condition for the electric field is still . The refractive index of the particle () or (). Matching the fields at the particle surface gives the scattering coefficients Bohren and Hunt (1977)
| (1) |
where
| (2) | ||||
| (3) | ||||
| (4) | ||||
| (5) |
with the dimensionless surface conductivity () or (). The size parameter where is the wavelength and , with the Bessel and the Neumann function. The efficiencies for extinction () and scattering () are
| (6) | ||||
| (7) |
from which the absorption efficiency can be also obtained.
An important special case is the scattering by small particles, for which . Inspired by the expressions used in Ref. Lykyanchuk et al., 2007 we write in this case and with
| (8) | ||||
| (9) |
and similarly and with
| (10) | ||||
| (11) |
The leading scattering coefficients for small uncharged particles are and . For them
| (12) |
| (13) | ||||
| (14) |
Keeping only the coefficient the extinction efficiency . Approximating (we have neglected compared to in the denominator) we obtain for the extinction efficiency
| (15) |
which is valid for small particles, that is, for .
III Results
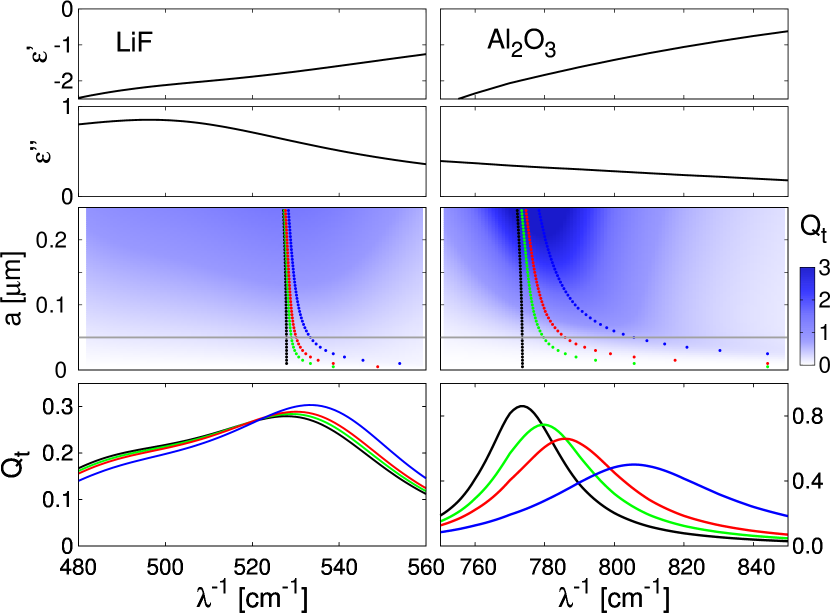
In the following we will discuss light scattering for a MgO () and an Al2O3 () particle (for material parameters see Ref. mat, ). The particle charge affects light scattering through the dimensionless surface conductivity (MgO) or the surplus electron polarizability (Al2O3). Both and are shown as a function of the inverse wavelength in the first row of Fig. 1. They are small even for a highly charged particle with cm-2 which corresponds to cm-3 for m. For K and except at very low frequencies. For the conductivities and tend to a real value so that and for very small . Both and decrease with increasing and vary smoothly over the considered frequencies. Shown for comparison are also and for where for cm-1, the inverse surface phonon wavelength ( for cm-1, the inverse LO phonon wavelength), since light absorption is possible only above (or ).
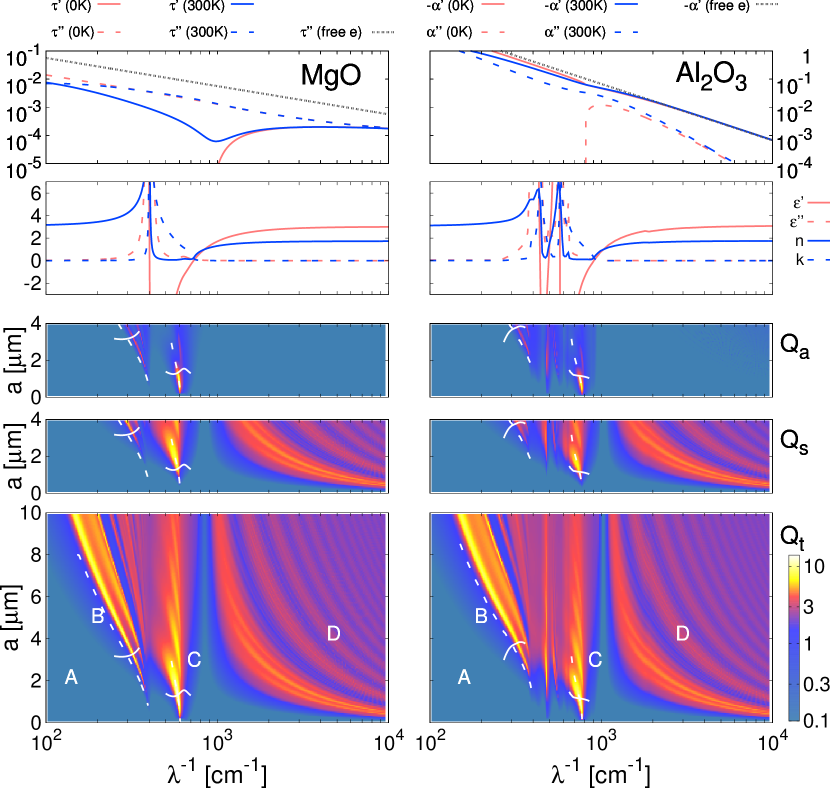
The scattering behavior of the uncharged particles is primarily determined by the dielectric constants (second row of Fig. 1). For MgO it is dominated by a TO phonon at cm-1. For Al2O3 two TO phonon modes at cm-1 and cm-1 dominate . At frequencies well below the TO phonon resonance the dielectric constant tends towards its real static value . In this regime (marker A in Fig. 1) . For constant radius , the extinction efficiency for . Just below the TO phonon resonance (for Al2O3 below the lower TO-phonon) is large and positive and (except in the immediate vicinity of the resonance). This gives rise to ordinary optical resonances (marker B in Fig. 1).van de Hulst (1957) Above the TO phonon resonance (for Al2O3 above the higher TO-phonon) and . This entails anomalous optical resonances (marker C in Fig.1).Fuchs and Kliewer (1968); Tribelsky and Lykyanchuk (2006); Tribelsky (2011) Far above the TO phonon resonance takes a small positive value and . This gives rise to an interference and ripple structure (marker D in Fig. 1).Bohren and Huffman (1983)
In the context of plasma physics dielectric particles with a strong TO phonon resonance have already been studied theoretically as wave-length selective infra-red absorbers.Rosenberg (2012a) In the following we explore the modification of the features A–D by surplus electrons. We are particularly interested in identifying dependencies in the optical signal which can be used as a charge diagnostic.
III.1 Low-Frequency Scattering
In the low frequency limit of scattering (marker A in Fig. 1) the extinction efficiency is relatively small. For cm-1 particles with a radius of a few microns are small compared to the wavelength. In this limit the dominant scattering coefficient is and the extinction efficiency is given approximately by Eq. (15). Extinction is due to absorption which is controlled by . As is small in this frequency range energy dissipation on the grain and thus extinction is inhibited. For , and hence .
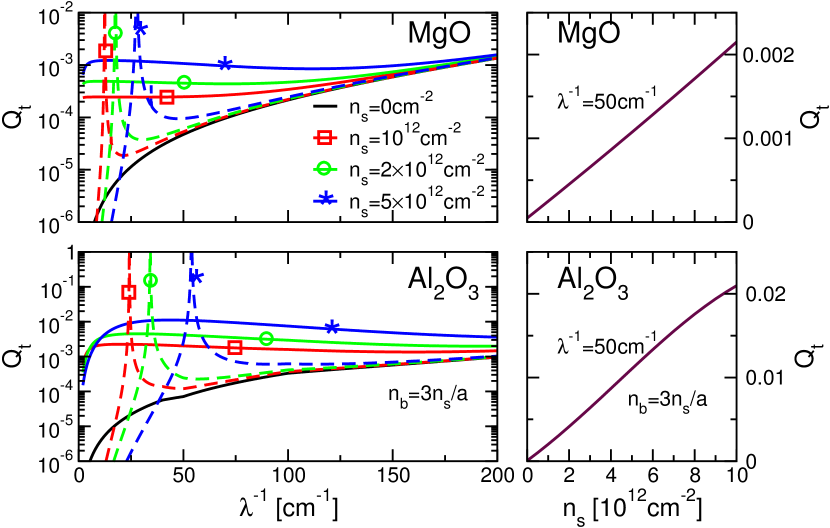
For charged dielectric particles light absorption is controlled not only by but also by for and by for which stem from the real part of the surface or bulk conductivity of the surplus electrons, respectively. For low frequency and are larger than for higher frequencies and for even outweigh and as the real parts of the surface and bulk conductivities tend to finite values whereas the imaginary parts vanish for . This allows increased energy dissipation on charged dust particles entailing increased light absorption. Figure 2 shows this saturation of the extinction efficiency for charged particles.
For comparison, we also show the results for free surface (MgO) or bulk electrons (Al2O3). In this case the conductivities are purely imaginary and the saturation of the extinction efficiency is not observed. Instead we find a plasmon resonance of the electron gas around or inside the particle. The resonance is located where (with given by Eq. (13)). This discrepancy with results from the phonon-limited conductivities shows that in the low-frequency limit the model of free surplus electrons cannot offer even a qualitative explanation.
The saturation of the extinction efficiency for low frequencies could be employed as a charge measurement. Performing an extinction measurement at fixed wavelength would give an approximately linear increase of with the surface density or bulk density of surplus electrons (see right panels of Fig. 2).
III.2 Ordinary Resonances
Below the TO phonon resonance at in the dielectric constant is large while is still comparatively small (except at ). The large positive (which entails a large positive real part of refractive index ) allows for ordinary optical resonances,van de Hulst (1957) which are clearly seen in Fig. 1. The lowest resonance is due to the mode. The contribution of this mode to the extinction efficiency is . More generally, the extinction efficiency due to one mode only reads where
| (16) |
with and (given for by Eqs. (8)-(II)). Note that we have neglected as . The resonance is approximately located where . This gives for the condition
| (17) |
The approximate resonance location for an uncharged sphere, obtained from is shown in Fig. 1 by the dashed line. It deviates somewhat from the true resonance location but captures its size dependence qualitatively. The contribution of one mode to absorption and scattering, respectively, is with
| (18) |
For scattering outweighs absorption while absorption outweighs scattering for . The boundary between the two regimes is given by . For this gives for an uncharged particle
| (19) |
which is shown in Fig. 1 by the solid line and agrees with the underlying contour.
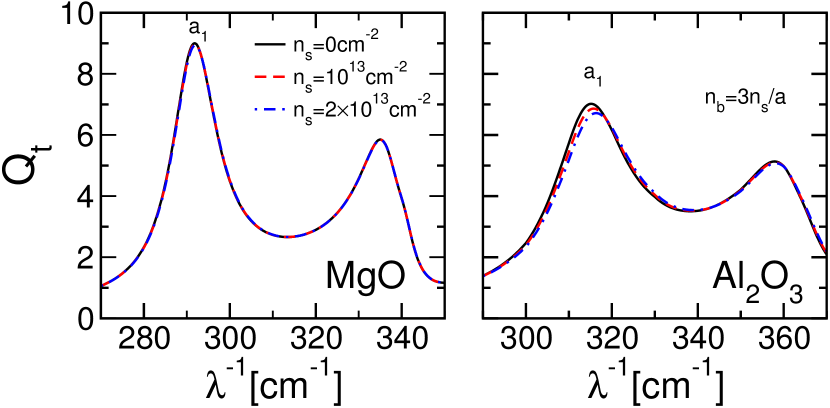
Fig. 3 shows that the resonance is not shifted significantly by surplus charges. As the charge enters or the shift cannot be increased by reducing the particle size. Ordinary resonances thus offer no possibility to measure the particle charge.
III.3 Ripple and Interference Structure
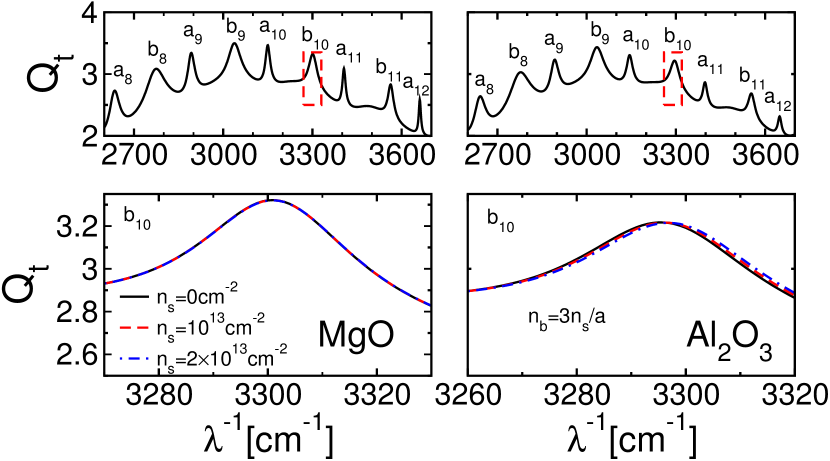
Far above the highest TO phonon frequency (that is, for MgO and Al2O3 for cm-1) the extinction efficiency shows the typical interference and ripple structure of Mie scattering (marker D in Fig. 1).Bohren and Huffman (1983) It consists of a broad interference pattern superseded by fine ripples which are due to individual modes. They become sharper for larger frequencies. Figure 4 shows the overall interference and ripple structure (top) and exemplifies the charge sensitivity of the ripple due to the mode (bottom). It is shifted only very slightly with increasing particle charge. This is due to the small values of the surface conductivity or the polarizability of the surplus electrons for cm-1. Thus the ripple structure is not a suitable candidate for a charge measurement either.
III.4 Anomalous Resonances
At the TO phonon resonance the real part of the dielectric constant changes sign. For and . This gives rise to a series of anomalous optical resonances, which can be seen in Fig. 1 (marker C). They correspond to the resonant excitation of transverse surface modes of the sphere.Fuchs and Kliewer (1968) For a metal particle they are tied to the plasmon resonance Tribelsky and Lykyanchuk (2006); Tribelsky (2011) whereas for a dielectric particle they are due to the TO-phonon. The resonances are associated with the scattering coefficients . The lowest resonance is due to the mode . The resonance location is approximately given by , which according to Eq. (II) gives for an uncharged sphere
| (20) |
This approximation, shown by the dashed line near marker C in Fig. 1, agrees well with the underlying Mie contour.
The higher resonances are scattering dominated, while the lowest resonance shows a cross-over from absorption to scattering dominance (see Fig. 1). This cross-over can be understood from the contribution of the mode to the scattering and absorption efficiencies (given by Eq. (18)). Absorption dominates for , while scattering dominates for . The boundary between the two regimes lies where . For this gives
| (21) |
which agrees well with the Mie contour (see Fig 1).
The anomalous resonances are sensitive to small changes in and or . Surplus electrons lead to a blue-shift of the resonances.Heinisch et al. (2012a) This effect is strongest for small particles with radius m. In the small particle limit the extinction efficiency is approximately given by Eq. (15). The resonance is located at
| (22) |
Compared to the resonance condition for ordinary resonances, Eq. (17), the charge sensitivity increases for small particles as surplus charges enter by (for ) or (for ). This shows that the resonance shift by the surplus electrons is primarily an electron density effect on the polarizability of the dust particle.Heinisch et al. (2012a)
Figure 5 shows the resonance shift for charged sub-micron-sized LiF mat and Al2O3 particles. For Al2O3 the resonance shift is relatively large and the extinction resonance has a Lorentzian shape. As is well approximated linearly close to and varies only slightly this follows form Eq. (15). For LiF the shift is smaller and the lineshape is not Lorentzian. The reason is the minor TO phonon at cm-1. This leads to a bump in disturbing the Lorentzian shape.
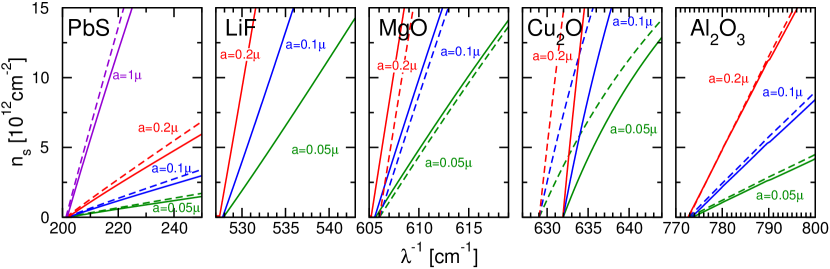
A comparison of the resonance shift for MgO and LiF () as well as Al2O3, PbS and Cu2O mat () is given by Fig. 6. The shift tends to be larger for bulk () than for surface () surplus electrons. Cu2O is an example for a dielectric where is too large for a well-resolved series of extinction resonances to form. Nevertheless a tail of the lowest resonance for small particles is discernible which is blue-shifted by surplus electrons, albeit by a lesser extent than for Al2O3 or PbS. PbS has a particularly strong resonance shift. Compared to the other materials the TO phonon resonance of PbS is located at a significantly lower frequency where is particularly large. Together with the small conduction band effective mass which benefits the electrons’ mobility this leads to the larger charge-induced blue-shift.
The blue-shift of the extinction resonance could be used as a charge measurement for particles with m. The resonance shift is found for particles with , e.g. MgO or LiF, and , e.g. PbS, Cu2O or Al2O3. The most promising candidates are particles made from Al2O3 or PbS. The latter may even allow a measurement for micron-sized particles.
III.5 Polarization Angles
So far we have considered charge effects in the extinction efficiency. In the following we will turn to the charge signatures in the polarization of the scattered light. While the extinction (or scattering) efficiency gives only access to the magnitude of the scattering coefficients the polarization of scattered light also reveals the phase of the scattering coefficients. The phase information is particularly useful close to the ordinary and anomalous optical resonances. They occur for where the sign change of leads to a rapid phase change around the resonances. For the functions and are real in the small particle limit (cf. Eqs. (12) -(14)). In this limit and while (for uncharged particles), which entails except very close to the resonance. As a consequence the phase of the scattering coefficients varies over the resonances by about .
For linearly polarized incident light () the electric field of the reflected light,
| (23) |
is in general elliptically polarized ( with a Legendre polynomial). Rewriting the reflected electric field as
| (24) |
where the amplitudes , and the phases , are given implicitly by the above equation, the ellipsometric angles are defined by
| (25) |
The angle gives the amplitude ratio and the phase difference characterizes the opening of the polarization ellipse. For the reflected light is linearly polarized while for the opening of the polarization ellipse is maximal.
Note that forward scattered light (),
| (26) |
is linearly polarized. The same applies to backscattered light () or light that is scattered perpendicularly to the incident wave and in plane or perpendicularly to the direction of polarization of the incident light ( and or ).
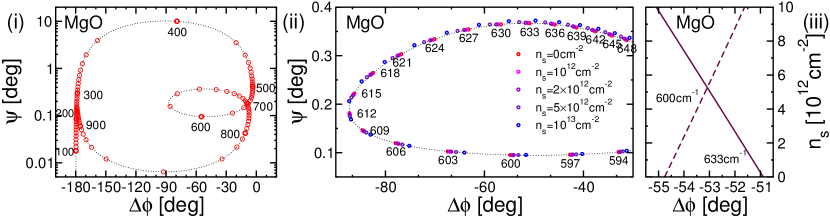
An important scattering angle where the scattered light is elliptically polarized is perpendicular to the incident wave and at 45∘ to the plane of polarization of the incident wave ( and ). This configuration is also used to determine from the Mie signal the particle size of nanodust.Greiner et al. (2012) Figure 7 shows the polarization angles and for this scattering direction for MgO and Al2O3 particles with radius m. Panels (i) (MgO) and (iv) (Al2O3) give an overview for an uncharged particle.
In the small particle limit only the scattering coefficients , , and are relevant. The reflected electric field is given by
| (27) |
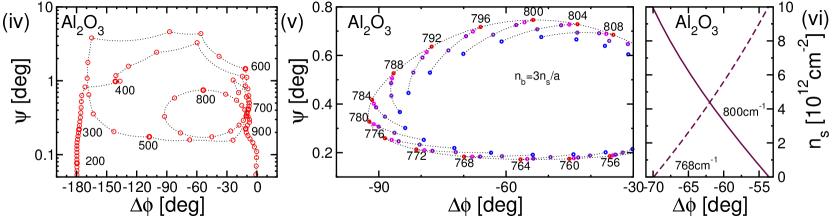
Figure 7 (i) shows a strong variation of for MgO as a function of which can be related to the variation of the phase of the scattering coefficients. For low frequencies cm-1 the reflected light is linearly polarized. Close to 400 cm-1 the rapid phase variation by of the coefficient increases by about . Above resonances appear in the coefficients and for and (for ), respectively. As these resonances are located very close to each other, the phase shifts by partly cancel and acquires and looses a phase of about at around cm-1. For Al2O3 the variation of is more complicated because two TO phonon modes dominate . Nevertheless the interplay of the and the mode above the higher TO phonon resonance leads to the rapid variation of from close to 0 to and back to close to 0 near cm-1.
Surplus charges alter the polarization angles very little except near the rapid opening and closing of the polarization ellipse at the anomalous resonances. Here surplus charges lead to a blue shift of the resonances in and . The shift is approximately given by Eq. (22) for the mode and by for the mode (in both cases ). The resonance blue-shift translates into a shift of . For a charged particle acquires and looses as for an uncharged particle but this takes place at higher than for an uncharged particle. This is shown in panels (ii) and (v) of Fig. 7. Panels (iii) and (vi) exemplify it for fixed where increases or decreases with the particle charge. This shift of by several degrees should also offer a possibility for a charge measurement.
IV Conclusions
We studied the scattering behavior of a charged dielectric particle with an eye on identifying a strategy for an optical charge measurement. Our focus lay on the four characteristic regimes of scattering for particles with a strong TO phonon resonance: (i) low-frequency scattering, (ii) ordinary resonances, (iii) anomalous resonances, and (iv) interference and ripple structure. Surplus charges enter into the scattering coefficients through their phonon-limited surface (for negative electron affinity) or bulk (positive electron affinity) conductivities.
No significant charge effects are found for the ordinary resonances and the interference and ripple structure. Surplus charges affect however the low-frequency regime and the anomalous optical resonances.
We have identified three charge-dependent features of light scattering: (i) a charge-induced increase in extinction for low-frequencies, (ii) a blue-shift of the anomalous extinction resonance, and (iii) a rapid variation of one of the two polarization angles at the anomalous extinction resonance. At low frequencies energy relaxation is inhibited for uncharged particles as the imaginary part of the dielectric constant is very small. Surplus charges enable energy relaxation on the grain through their electrical conductivity which has a significant real part at low frequencies. This leads to increased absorption at low frequencies. Above the TO phonon frequency the real part of the dielectric constant is negative which leads to anomalous optical resonances. Surplus charges enter into the resonance condition through the imaginary part of their electrical conductivity. They lead to a resonance blue-shift which is most significant for sub-micron-sized particles. Moreover, at the anomalous resonances the phase of the resonant scattering coefficients varies rapidly. This causes the opening and closing—characterized by the angle —of the polarization ellipse of the reflected light. Surplus charges lead to the rapid variation in being shifted to higher frequency.
We suggest to use these charge signatures in the Mie signal to measure the particle charge. For plasmonic particles charge-induced resonance shifts have already been detected experimentally for metallic nanorods which were charged by an electrolytic solution Mulvaney et al. (2006); Novo and Mulvaney (2007) and for an array of nanodiscs exposed to an argon plasma.Lapsley et al. (2012)
In order to detect the charge-sensitive effects of light scattering by dust particles in a dusty plasma would require to shine infra-red light through the plasma and to measure light attenuation or the polarization of reflected light. The low-frequency increase in extinction or the shift in the polarization angle could be observed with monochromatic light while the resonance shift would require a frequency dependent extinction measurement. This would not only allow a determination of the particle charge without knowing any plasma parameters but also of nanodust particles Greiner et al. (2012); Kovascevic et al. (2005); Berndt et al. (2009) where traditional techniques cannot be applied at all.
Eventually suitable particles with a strong charge sensitivity (e.g. Al2O3 or PbS particles) could even be employed as minimally invasive electric plasma probes. The particles would accumulate a charge depending on the local plasma environment. Performing simultaneously an optical charge measurement and a traditional force measurement Khrapak et al. (2005); Tomme et al. (2000); Carstensen et al. (2011) would then allow to infer the local electron density and temperature at the position of the probe particle.
Acknowledgement
This work was supported by the Deutsche Forschungsgemeinschaft through SFB-TR 24.
References
- Mendis (2002) D. A. Mendis, Plasma Sources Sci. Technol. 11, A219 (2002).
- Ishihara (2007) O. Ishihara, J. Phys. D: Appl. Phys 40, R121 (2007).
- Spitzer (1982) L. Spitzer, Processes in the Interstellar Medium (Wiley, 1982).
- Mann (2008) I. Mann, Adv. Space Res. 41, 160 (2008).
- Grün et al. (1984) E. Grün, G. Morfill, and D. A. Mendis, in Planetary Rings, edited by R. Greenberg and A. Brahic (University of Arizona Press, Tuscon, 1984), p. 275.
- Friedrich and Rapp (2009) M. Friedrich and M. Rapp, Surv. Geophys. 30, 525 (2009).
- Hollenstein (2000) C. Hollenstein, Plasma Phys. Control. Fusion 42, R93 (2000).
- Piel and Melzer (2002) A. Piel and A. Melzer, Plasma Phys. Control. Fusion 44, R1 (2002).
- Khrapak et al. (2005) S. A. Khrapak, S. V. Ratynskaia, A. V. Zobnin, A. D. Usachev, V. V. Yaroshenko, M. H. Thoma, M. Kretschmer, H. Hoefner, G. E. Morfill, O. F. Petrov, et al., Phys. Rev. E 72, 016406 (2005).
- Tomme et al. (2000) E. B. Tomme, D. A. Law, B. M. Annaratone, and J. E. Allen, Phys. Rev. Lett. 85, 2518 (2000).
- Carstensen et al. (2011) J. Carstensen, H. Jung, F. Greiner, and A. Piel, Phys. Plasmas 18, 033701 (2011).
- Homann et al. (1997) A. Homann, A. Melzer, S. Peters, and A. Piel, Phys. Rev. E 56, 7138 (1997).
- Melzer (2003) A. Melzer, Phys. Rev. E 67, 016411 (2003).
- Carstensen et al. (2010) J. Carstensen, F. Greiner, and A. Piel, Phys. Plasmas 17, 083703 (2010).
- Mie (1908) G. Mie, Ann. Phys. (Berlin) 330, 377 (1908).
- Bohren and Hunt (1977) C. F. Bohren and A. J. Hunt, Can. J. Phys. 55, 1930 (1977).
- Bohren and Huffman (1983) C. F. Bohren and D. R. Huffman, Absorption and Scattering of Light by Small Particles (Wiley, 1983).
- Klačka and Kocifaj (2007) J. Klačka and M. Kocifaj, J. Quant. Spectr. Rad. Transfer 106, 170 (2007).
- Klačka and Kocifaj (2010) J. Klačka and M. Kocifaj, Prog. Electromagn. Res. 109, 17 (2010).
- Heifetz et al. (2010) A. Heifetz, H. T. Chien, S. Liao, N. Gopalsami, and A. C. Raptis, J. Quant. Spectr. Rad. Transfer 111, 2550 (2010).
- Heinisch et al. (2012a) R. L. Heinisch, F. X. Bronold, and H. Fehske, Phys. Rev. Lett. 109, 243903 (2012a).
- Rosenberg (2012a) M. Rosenberg, IEEE Trans. Plasma Sci. 40, 1229 (2012a).
- Rohlfing et al. (2003) M. Rohlfing, N.-P. Wang, P. Kruger, and J. Pollmann, Phys. Rev. Lett. 91, 256802 (2003).
- Heinisch et al. (2012b) R. L. Heinisch, F. X. Bronold, and H. Fehske, Phys. Rev. B 85, 075323 (2012b).
- Heinisch et al. (2011) R. L. Heinisch, F. X. Bronold, and H. Fehske, Phys. Rev. B 83, 195407 (2011).
- Evans and Mills (1973) E. Evans and D. L. Mills, Phys. Rev. B 8, 4004 (1973).
- Barton (1981) G. Barton, J. Phys. C 14, 3975 (1981).
- Kato and Ishii (1995) M. Kato and A. Ishii, Appl. Surf. Sci. 85, 69 (1995).
- Götze and Wölfle (1972) W. Götze and P. Wölfle, Phys. Rev. B 6, 1226 (1972).
- Mahan (1990) G. D. Mahan, Many-Particle Physics (Plenum, 1990), p. 703-708.
- Stratton (1941) J. A. Stratton, Electromagnetic Theory (McGraw-Hill, 1941).
- Lykyanchuk et al. (2007) B. S. Lykyanchuk, M. I. Tribelsky, V. Ternovsky, Z. B. Wang, M. H. Hong, L. P. Shi, and T. C. Chong, J. Opt. A 9, S294 (2007).
- (33) We use for MgO ,Wintersgill et al. (1979) and from Ref. Jasperse et al., 1966, for LiF ,Dolling et al. (1968) ,Dolling et al. (1968) and from Ref. Hofmeister et al., 2003, for Al2O3 , , ,Schubert et al. (2000) ,Perevalov et al. (2007) and from Ref. Palik, 1985, for PbS , , ,Geick (1964) ,Walton et al. (1962) and from Ref. Geick, 1964, for Cu2O ,Dawson et al. (1973) , ,O’Keeffe (1963) ,Hodby et al. (1976) and from Ref. O’Keeffe, 1963.
- van de Hulst (1957) H. C. van de Hulst, Light Scattering by Small Particles (Wiley, 1957).
- Fuchs and Kliewer (1968) R. Fuchs and K. L. Kliewer, J. Opt. Soc. Am. 58, 319 (1968).
- Tribelsky and Lykyanchuk (2006) M. I. Tribelsky and B. S. Lykyanchuk, Phys. Rev. Lett. 97, 263902 (2006).
- Tribelsky (2011) M. I. Tribelsky, Europhys. Lett. 94, 14004 (2011).
- Greiner et al. (2012) F. Greiner, J. Carstensen, N. Koehler, I. Pilch, H. Ketelsen, S. Knist, and A. Piel, Plasma Sources Sci. Technol. 21, 065005 (2012).
- Mulvaney et al. (2006) P. Mulvaney, J. Perez-Juste, M. Giersig, L. M. Liz-Marzan, and C. Pecharroman, Plasmonics 1, 61 (2006).
- Novo and Mulvaney (2007) C. Novo and P. Mulvaney, Nano Lett. 7, 520 (2007).
- Lapsley et al. (2012) M. I. Lapsley, A. Shahravan, Q. Hao, B. K. Juluri, S. Giardinelli, M. Lu, Y. Zhao, I.-K. Chiang, T. Matsoukas, and T. J. Huang, Apl. Phys. Lett. 100, 101903 (2012).
- Kovascevic et al. (2005) E. Kovascevic, I. Stefanovic, J. Berndt, Y. J. Pendleton, and J. Winter, Astrophys. J. 623, 242 (2005).
- Berndt et al. (2009) J. Berndt, E. Kovacevic, I. Stefanovic, O. Stefanovic, S. H. Hong, L. Boufendi, and J. Winter, Contrib. Plasma Phys. 49, 107 (2009).
- Wintersgill et al. (1979) M. Wintersgill, J. Fontanella, C. Andeen, and D. Schuele, J. Appl. Phys. 50, 8259 (1979).
- Jasperse et al. (1966) J. R. Jasperse, A. Kahan, J. N. Plendl, and S. S. Mitra, Phys. Rev. 146, 526 (1966).
- Dolling et al. (1968) G. Dolling, H. G. Smith, R. M. Nicklow, P. R. Vijayaraghavan†, and M. K. Wilkinson, Phys. Rev. 168, 970 (1968).
- Hofmeister et al. (2003) A. M. Hofmeister, E. Keppel, and A. K. Speck, Mon. Not. R. Astron. Soc. 345, 16 (2003).
- Schubert et al. (2000) M. Schubert, T. E. Tiwald, and C. M. Herzinger, Phys. Rev. B 61, 8187 (2000).
- Perevalov et al. (2007) T. V. Perevalov, A. V. Shaposhnikov, V. A. Gritsenko, H. Wong, J. H. Han, and C. W. Kim, JETP Letters 85, 165 (2007).
- Palik (1985) E. D. Palik, Handbook of Optical Constants of Solids (Academic, 1985).
- Geick (1964) R. Geick, Phys. Lett. 10, 51 (1964).
- Walton et al. (1962) A. K. Walton, T. S. Moss, and B. Ellis, Proc. Phys. Soc. 79, 1065 (1962).
- Dawson et al. (1973) P. Dawson, M. M. Hargreave, and G. R. Wilson, J. Phys. Chem. Solids 34, 2201 (1973).
- O’Keeffe (1963) M. O’Keeffe, J. Chem. Phys. 39, 1789 (1963).
- Hodby et al. (1976) J. W. Hodby, T. E. Jenkins, C. Schwab, H. Tamura, and D. Trivich, J. Phys. C 9, 1429 (1976).