Survey of cometary CO2, CO, and particulate emissions using the Spitzer Space Telescope
Abstract
We surveyed 23 comets using the Infrared Array Camera on the Spitzer Space Telescope in wide filters centered at 3.6 and 4.5 m. Emission in the 3.6 m filter arises from sunlight scattered by dust grains; the 3.6 m images generally have a coma near the nucleus and a tail in the antisolar direction due to dust grains swept back by solar radiation pressure. The 4.5 m filter contains scattered sunlight by, and thermal emission from, the same dust grains, as well as strong emission lines from CO2 and CO gas. The 4.5 m images are often much brighter than could be explained by dust grains, and they show sometimes distinct morphologies, in which cases we infer they are dominated by gas. Based on the ratio of 4.5 to 3.6 m brightness, we classify the survey comets as CO2+CO ‘rich’ and ‘poor’. This classification is correlated with previous classifications by A’Hearn based on carbon-chain molecule abundance, in the sense that comets classified as ‘depleted’ in carbon-chain molecules are also ‘poor’ in CO2+CO. The gas emission in the IRAC 4.5 m images is characterized by a smooth morphology, typically a fan in the sunward hemisphere with a radial profile that varies approximately as the inverse of projected distance from the nucleus, as would apply for constant production and free expansion. There are very significant radial and azimuthal enhancements in many of the comets, and these are often distinct between the gas and dust, indicating that ejection of solid material may be driven either by H2O or CO2. Notable features in the images include the following. There is a prominent loop of gas emission from 103P/Hartley 2, offset toward the sunward direction; the loop could be due to an outburst of CO2 before the Spitzer image. Prominent, double jets are present in the image of 88P/Howell, with one directed nearly toward the Sun and the other closer to the terminator (but still on the daytime hemisphere). A prominent single jet is evident for C/2002 T7 (LINEAR), 22P/Kopff and 81P/Wild 2. Spirals are apparent in 29P/Schwassmann-Wachmann 1 and C/2006 W3 (Christensen); we measure a rotation rate of 21 hr for the latter comet. Arcs (possibly parts of a spiral) are apparent in the images of 10P/Tempel 2, and 2P/Encke.
1 Introduction
Comets are the leftover building blocks from formation of the planets beyond the frost line in the early Solar Nebula. Cometary materials comprise the cores of the ice giant planets Uranus and Neptune, and the organic- and ice-rich late veneer of planets and satellites throughout the Solar System (Chyba and Sagan, 1997). Comets from the Jupiter-Saturn region were ejected into the distant Oort cloud (or into interstellar space), and those from Neptune to the edge of the nebula reside in the present-day Kuiper belt (Wiegert and Tremaine, 1999). Observations of comets provide a unique opportunity to remotely sample primitive outer Solar System material. The only true sample return from a comet, the NASA Stardust mission, retrieved relatively robust refractory solid material from comet 81P/Wild 2, but it could not retrieve the more delicate and volatile materials that drive cometary activity and constitute much a comet s mass. The Rosetta spacecraft en route to comet 67P/Churyumov-Gerasimenko will measure properties of that comet directly, upon landing on its surface in 2014. To study a wide range of comets, and sample properties of the early solar nebula at a range of distances from the Sun, we must still rely on telescopic observations. Observing opportunities for comets are frequent, because gravitational perturbations (by passing stars, for Oort cloud comets, or by the outer planets, for Kuiper belt comets) send a flotilla of comets into the inner Solar System.
Comets are composed primarily of volatile ices and refractory solids, in comparable amounts by mass. Despite the seminal work by Whipple in explaining cometary activity based on the sublimation of water ice, many of the observed properties of cometary activity and composition remain unknown. The presence of water ice is well established through observations of OH. But water ice does not sublimate readily outside 2.5 AU from the Sun, while cometary activity is common at much greater distances, even at 20 AU (Meech and Svoren, 2004). Other molecules may dominate the activity of some comets. Observations of 9P/Tempel 1 by the Deep Impact spacecraft revealed a CO2 active region on the surface of that comet. Feaga et al. (2007) found that the particulate (dust) production of the CO2-enhanced active area was equivalent to the H2O-enhanced active area, even though overall the production rate of water was greater than the production rate of CO2. These observations were made when the comet was 1.5 AU from the Sun, where conventional knowledge predicts H2O outgassing would dominate dust production. Thus CO2 could be an important species for levitating solid material from this comet even close to the Sun where H2O sublimation is predicted to dominate.
The prevailing model for production and distribution of cometary ices defines two types of observable cometary species (Festou, 1981). Parent species are those of which the comet is actually composed. On cosmochemical grounds, abundant parent species are likely to include H2O, CO2, H2CO, CO, CH4, as well as more complicated molecules. Upon sublimation, the vapor is exposed to the solar radiation field and survives until dissociated; daughter species are the dissociation products. Most observable cometary molecules are daughter species. Examples include OH, measurement of which is a proxy for the most abundant species, H2O. Observations of the most abundant parent molecules provide direct measures of the composition of comets, but such measurements are rare. The observations described in this paper will address two abundant species, CO2 and CO, estimated to be the 2nd and 3rd most important species in terms of abundance and ability to drive cometary activity (especially at great distances from the Sun). Measurements of parent species are important because they directly trace the abundant species and they avoid the model dependence required to interpret daughter species. A growing number of results show important deviations from the standard model. The 1P/Halley encounter missions in 1986 and the C/Hale-Bopp apparition in 1995 provided some surprising results. The Neutral Mass Spectrometer on Giotto demonstrated that CO production from Halley is widespread in the coma, requiring an extended source rather than ejection from the nucleus (Eberhardt, 1999). The extended source could not be identified but was suggested to be photodissociation of H2CO, which was itself produced by an extended source, suggested to be a polymerized form on grains. A far-ultraviolet sounding rocket experiment showed that atomic carbon was also inconsistent with the standard comet model, leading to a ‘carbon puzzle,’ requiring an extended source of ‘identity unknown’ for P/Halley (Woods et al., 1987); however, this result could also be explained without an extended source (Rubin et al., 2011). The subject has been reviewed by Festou (1999). For comet C/Hale-Bopp, the radial profile of OCS relative to H2O indicated an extended emission source for OCS (Dello Russo et al., 1998). Based on evidence to date, it appears that CO may be both a parent (present not he nucleus) and daughter molecule.
Before the Akari mission (Murakami et al., 2007), very little was known about gas emission in the mid-infrared spectral range. Near-infrared images of comet Hale-Bopp in the CO band failed to reveal the expected bright, centrally-peaked CO emission for such an abundant parent species, suggesting CO production is very low or from a very extended source (Santos-Sanz et al., 1997). The CO and CO2 emission was very bright in the 2.5-5 m spectra taken with ISO, indicating a very high CO2 production rate(Crovisier et al., 1997). The spectrum of 103P/Hartley 2, obtained from the ISO archive, is shown in Figure 1 together with the bandpasses of the Spitzer/IRAC 3.6 and 4.5 m channels. A relatively definitive observational study of the 4.7 m emission in the fundamental CO lines (exceptionally difficult from the ground) showed that there is both a native source, varying as , and an extended source in the coma (DiSanti et al., 2001). The extended source of CO, C, OCS, and H2CO must be due to something that can survive relatively long in the coma and then thermally evaporates. Comparing the H2O and CO production rates for several comets, it appears that CO may be better-correlated with overall activity level in a comet (Feldman et al., 1997). CO was detected in the coma of 29P/Schwassmann-Wachmann 1 (Gunnarsson et al., 2002), with a much wider distribution than expected for a parent species in the Haser model, as noted above for Halley and Hale-Bopp. These results suggest that important volatile species are produced in the coma, not directly from the nucleus.

Mid-infrared imaging of the gaseous emission from comets is challenging due to their faint surface brightness and the challenge of observing extended sources. In particular, observations of cometary emission from gases present in the Earth’s atmosphere is exceptionally difficult from the ground. The Spitzer Space Telescope has made this possible due to its presence outside the Earth’s atmosphere and its ability to image extended emission in a broad filter near 4.5 m. There are two bright lines in this band: the CO fundamental vibrational band at 4.7 m and CO2 vibrational band at 4.3 m; no other important gas lines are present in the mid-infrared from Hale-Bopp or 103P/Hartley 2 observed by ISO (Crovisier et al., 1999). Evidence for strong contributions of cometary gas to the IRAC 4.5 m images has been found from Spitzer/IRAC imaging. For 21P/Giacobini-Zinner, the 4.5 m image was shown to be dominated by gas (Pittichová et al., 2008). For the split comet 73P/Schwassmann-Wachmann 3, we also found clear evidence for CO+CO2 (Reach et al., 2009). The IRAC 4.5 m image, with a dust contribution removed based on the adjacent 3.6 and 5.8 m images, shows the CO+CO2 emission is in a sunward fan with a scale length of km. The abundance of CO2 was high, requiring CO2/H2O to 0.1 in the major fragments B and C. For comparison, ground-based measurements found CO/H2O (Bockelée-Morvan et al., 2000). Combining the ground- and Spitzer-based data yields CO2/CO, making CO2 the second-most-abundant (by far) molecule in the ice exposed on 73P-C and indicating CO2 is abundant even in ice relatively freshly exposed by the major splitting event that transformed 73P into a string of fragments.
Now that comet 103P/Hartley 2 has been visited by the sensitive imaging and spectroscopic instruments as part of the EPOXI mission (A’Hearn et al., 2011), there is even more reason to pay attention to the role of CO2 in comets. In contrast to the expectation that H2O dominates cometary mass loss, for this comet at least it was evident that many active areas were dominated by CO2, and a new mass-loss mechanism was found: blocks of icy material large enough to be individually observed in a swarm around the nucleus. In this paper we present a survey of Spitzer/IRAC observations to image CO2 and CO production for a sample of Jupiter-family and long-period comets. Cometary CO has been studied with infrared spectroscopy by several groups (e.g. Disanti & Mumma 2009), atmospheric and instrumental constraints have limited these studies to the very brightest comets. The spectroscopic method obtains precise information on CO for these objects, but it cannot yet let us measure CO in a statistically significant sample of typical (i.e. intrinsically faint) comets. The abundance of CO2 has been almost completely unstudied in the JFC population due to the difficulty in observing that molecule from the ground. This changed with the Akari spectroscopic survey of 18 comets, which clearly showed CO2 emission at 4.3 m is a prominent feature of infrared spectra (Ootsubo et al., 2011). That survey also simultaneously covered H2O and CO, making it particularly valuable for assessing relative abundances and showing that in the Spitzer 4.5 m waveband, CO2 is the dominant emitter from JFCs while CO is important in Centaurs and some Oort cloud comets. The Spitzer survey described in this paper covers some of the same comets, and it allows for the first time a sensitive imaging of the distribution of extended CO2 emission from comets.
2 Observations
2.1 Target Selection
Table 1 summarizes the observations. The comets in this survey were selected based on their visibility from Spitzer during 2009-2010. Short-period comets with perihelion passage in 2009-2011 were included if they could be observed when bright (predicted visible total magnitude , solar elongation 85-115∘) and preferably in more than one Spitzer visibility window with heliocentric distance less than 5 AU. Long-period (Oort cloud) comets were selected from lists compiled by the well-known amateurs Seiichi Yoshida and the British Astronomical Association, and the Minor Planet Center, all of whom post predictions for bright comets in upcoming years. We did not include comets whose predicted visual magnitude is fainter than 18, since they are likely to be only a bare nucleus in the Spitzer observations. Two newly discovered comets were added during the survey, based on their potential to be bright and their visibility to Spitzer, these were P/2009 K5 (McNaught) and P/2010 H2 (Vales). The survey observations took place from 2009 Jul 28 to 2011 Feb 28. Some archival observations were added to the list from other programs due to their suitability; these were 65P/Gunn and 2P/Encke (observed during initial observatory check-out), and C/2002 T7 (LINEAR), 32P/Comas Sola, and 49P/Arend-Rigaux.
| Comet | Date | Solar | aaTotal brightness (in visible magnitudes) predicted by Horizons, ssd.jpl.nasa.gov. These values were used in planning observations but not for the interpretation of the results. | Apertureb | ||||
|---|---|---|---|---|---|---|---|---|
| (AU) | (AU) | Elong. | (mJy) | (mJy) | (′′) | |||
| C/2002 T7 (LINEAR) | 2003/12/28 | 2.18 | 1.55 | 116.5∘ | 10.6 | 215 | 482 | 30 |
| C/2006 W3 (Christensen) | 2009/08/06 | 3.14 | 2.67 | 108.5 | 12.3 | 138.5 | 294.7 | 30 |
| C/2006 W3 (Christensen) | 2010/06/09 | 4.45 | 4.26 | 94.6 | 14.7 | 18.2 | 30.6 | 30 |
| C/2007 N3 (Lulin) | 2009/11/20 | 4.20 | 4.02 | 92.9 | 16.2 | 0.19 | 0.21 | 6 |
| C/2007 Q3 (Siding Spring) | 2010/03/14 | 2.93 | 2.70 | 89.6 | 12.4 | 13.0 | 23.1 | 30 |
| C/2007 Q3 (Siding Spring) | 2010/08/26 | 4.12 | 4.00 | 89.5 | 14.6 | 1.0 | 1.1 | 30 |
| C/2009 K5 (McNaught) | 2009/09/21 | 3.20 | 2.78 | 104.9 | 14.7 | 2.7: | 2.4: | 6 |
| 2P/Encke | 2003/11/17 | 1.01 | 0.23 | 82.0 | 7.1 | 19 | 75 | 30 |
| 2P/Encke | 2009/12/24 | 2.93 | 2.31 | 118.1 | 19.3 | 0.04 | 1.2 | 30 |
| 2P/Encke | 2010/09/26 | 1.13 | 0.59 | 85.0 | 12.0 | 46.8 | 243.0 | 30 |
| 10P/Tempel 2 | 2009/07/29 | 3.16 | 3.11 | 83.1 | 19.7 | 0.05 | 0.4 | 6 |
| 10P/Tempel 2 | 2010/09/16 | 1.61 | 1.37 | 83.5 | 14.4 | 17.9 | 110.0 | 30 |
| 10P/Tempel 2 | 2011/02/28 | 2.66 | 2.17 | 117.2 | 18.0 | 0.22 | 4.6 | 30 |
| 19P/Borrelly | 2009/07/29 | 3.58 | 3.33 | 95.3 | 19.1 | 0.36 | 0.35 | 30 |
| 22P/Kopff | 2009/08/16 | 1.78 | 1.33 | 97.5 | 14.1 | 14.9 | 59.3 | 30 |
| 22P/Kopff | 2010/01/22 | 2.67 | 2.19 | 107.5 | 17.0 | 0.66 | 2.4 | 30 |
| 29P/Schwassmann-Wachmann 1 | 2010/01/25 | 6.19 | 5.82 | 107.8 | 14.9 | 3.5 | 18.1 | 84 |
| 32P/Comas Sola | 2005/01/19 | 1.96 | 1.31 | 114.8 | 14.5 | 42 | 133 | 84 |
| 49P/Arend-Rigaux | 2004/11/29 | 1.69 | 0.98 | 114.3 | 15.3 | 24 | 123 | 30 |
| 57P/duToit-Neujmin-Delporte | 2009/10/06 | 2.88 | 2.80 | 84.6 | 20.9 | 0.012: | 6 | |
| 65P/Gunn | 2003/09/21 | 2.58 | 3.25 | 101.3 | 14.5 | 6.8 | 24.2 | 30 |
| 65P/Gunn | 2009/08/06 | 2.74 | 2.50 | 92.8 | 15.2 | 7.1 | 26.8 | 30 |
| 65P/Gunn | 2010/07/30 | 2.61 | 2.08 | 110.0 | 14.7 | 3.6 | 18.4 | 30 |
| 77P/Longmore | 2009/08/13 | 2.32 | 2.00 | 94.4 | 16.0 | 2.7 | 5.3 | 30 |
| 77P/Longmore | 2010/08/16 | 3.34 | 2.69 | 122.2 | 19.2 | 0.02: | 0.04: | 6 |
| 81P/Wild 2 | 2010/04/12 | 1.68 | 1.33 | 89.2 | 12.1 | 80.4 | 322 | 40 |
| 81P/Wild 2 | 2010/09/26 | 2.63 | 2.24 | 114.5 | 16.1 | 1.3 | 4.8 | 6 |
| 88P/Howell | 2009/08/24 | 1.47 | 0.84 | 102.8 | 13.4 | 93.0 | 630 | 30 |
| 94P/Russell 4 | 2010/01/22 | 2.30 | 2.19 | 86.9 | 18.2 | 0.11 | 0.28 | 6 |
| 94P/Russell 4 | 2010/07/13 | 2.34 | 1.67 | 112.3 | 17.7 | 0.10 | 0.27 | 30 |
| 103P/Hartley 2 | 2009/09/09 | 3.98 | 3.38 | 118.4 | 20.2 | 0.39: | 0.35: | 6 |
| 103P/Hartley 2 | 2011/01/26 | 1.72 | 1.22 | 89.2 | 14.8 | 24 | 156 | 84 |
| 116P/Wild 4 | 2009/07/28 | 2.18 | 2.01 | 85.2 | 12.9 | 10.3 | 21.3 | 30 |
| 116P/Wild 4 | 2010/06/09 | 3.02 | 2.96 | 84.1 | 16.8 | 0.10 | 0.14 | 6 |
| 118P/Shoemaker-Levy 4 | 2009/11/28 | 2.01 | 1.80 | 90.8 | 13.3 | 3.9 | 20.1 | 30 |
| 118P/Shoemaker-Levy 4 | 2010/05/08 | 2.21 | 1.50 | 122.3 | 14.0 | 2.9 | 12.2 | 30 |
| 143P/Kowal-Mrkos | 2009/08/13 | 2.57 | 2.17 | 100.7 | 16.8 | 0.15 | 0.50 | 6 |
| P/2010 H2 (Vales) | 2010/08/16 | 3.18 | 2.63 | 113.2 | 14.0 | 0.3 | 0.47 | 30 |
2.2 Observing strategy
The observations were made using the Infrared Array Camera (IRAC, (Fazio et al., 2004)). The main survey was made after the cryogenic mission of Spitzer had completed, so that only the 3.6 and 4.5 m channels of IRAC were operational. Each array has a instantaneous field of view with 256256 pixels. The supplemental images in Table 1 with observing date prior to 2009 Jul were made during the cryogenic mission and additionally had 5.8 and 8 m channels. One of the observations, the first of 65P/Gunn, was made before the telescope was focused, but the effect of focus was negligible for the purpose of this project.
To measure the CO and CO2 emission, we made images of sufficient size to allow separation of the dust and gas (i.e. scaling the 3.6 m image and subtracting from the 4.5 m image) and to extend far enough into the coma that the flux measurement does not suffer from complicated velocity and density distributions in deviation from those of a steady outflow. If the production rate is , the expansion speed is and the timescale for dissociation by sunlight is , then the density of a parent species is predicted to have a spatial distribution
| (1) |
Images much larger than will contain all the material and accurately trace the mass regardless of details of the density distribution, allowing us to derive without assumptions on or . Practical limitations (observing time) constrain the largest images, but the size scales with . For CO and CO2, (1 AU)= 15.4 and 5.8 days, respectively at 1 AU (Cochran and Schleicher, 1993), and the expansion velocity for the gas is km s-1 for comets at AU from the Sun (Reach et al., 2000; Bockelee-Morvan et al., 1990), yielding scale lengths for the two molecules of and km, respectively, at 3 AU from the Sun. We computed the CO2 scale length for each comet s observing circumstances, yielding image size scale lengths of 4′ to 14′, very well suited to the IRAC field of view. Images smaller than can be used (as can photometry) if the dust and gas can be accurately separated. As we will show, the CO+CO2 is much brighter than dust for distant comets, so aperture photometry in the comet in one IRAC field of view in each of the 3.6 and 4.5 m channels is sufficient. For comets passing closer to Spitzer, maps were created from multiple pointings of the telescope to cover a scale out to .
To determine exposure times, the brightness of each comet was predicted using models for emission from the nucleus and from dust. Nuclear fluxes were predicted using the IAU standard model for reflected light plus the IRAS standard thermal model taking the diameter from the literature (or using 4 km if unknown). The dust coma flux was predicted using the from the literature (A’Hearn et al., 1995) or using 100 cm at 1 AU if unknown, and scaled by to account for heliocentric variation. To detect the CO+CO2 emission, we required that the signal-to-noise on the central coma be at least 10, to enable separation of the gas from the dust for relatively inactive comets, using their 3.6/4.5 m color. Instantaneous exposure times of 30 or 100 sec were used, and the observations were typically 1 hour per comet.
3 Flux measurements
For each image, the relevant comet was identified and verified either by its obvious morphology (for the bright comets, which dominate the images) or its motion during the interval of observation (for faint comets, which can be confused with stars or galaxies). In most cases this was straightforward. For 103P in 2009 Sep and for C/2009 K5 in 2009 Sep, there was significant confusion from the crowded field of unrelated objects, so the flux measurements are approximate and are indicated as such with a ‘:’ in Table 1. For 57P, it was not possible to locate the comet at 3.6 m so only an upper limit is given, and the identification at 4.5 m is tentative.
Fluxes were measured using the Aperture Photometry Tool developed by R. Laher111http://www.aperturephotometry.org/. For each comet, a circular aperture was centered on the brightest condensation around the nucleus, and a curve of growth computed, showing the enclosed flux as a function of aperture radius expanding from 3′′ to 120′′. The aperture radius was selected so as to include the entire rising portion of the curve of growth. Very extended emission continues beyond the aperture in some comets, but at a very low level and not following the same power-law deviled with the nucleus as the bulk of the emission. We estimate that the enclosed flux is at least 80% of the total flux in all cases. An aperture radius of was used for the large, extended comets, for which the radial profiles always indicate a strong central condensation and an extended component. The smaller comets were measured in an aperture radius of in order to avoid including nearby stars and galaxies. Those for which the compact aperture was used are indicated with a footnote in Table 1. The aperture sizes are generally smaller than the maximum extent of gaseous emission predicted by the dissociation lifetime and expansion speed mentioned above. For this reason, the measurements may underestimate the total fluxes. Inspecting the images generally shows that there is extended emission at least out to the edge of the aperture. The integrated flux continues to slowly rise as a function of aperture, at a rate that is less steep than linear. We truncate the aperture because further extent is too dependent upon the uncertain removal of interstellar and cosmic background radiation.
Figure 2 shows the flux densities versus heliocentric distance. Clearly, comets are fainter when further from the Sun, but the plot has a wide scatter due to the different gas and dust production rates for different comets. Figure 3 shows the ratio of 4.5 to 3.6 m flux for each comet, versus heliocentric distance. This ratio is now insensitive to the total production rate due to different amount of exposed surface ice and different nuclear size of the various comets. The change with heliocentric distance is due to the dust temperature and the dust-to-gas ratio of the material produced by the comet. For the dust, a variation with heliocentric distance is expected from the strong change in thermal emission on the Wien portion of the thermal emission spectrum. The transition between scattered light and thermal emission occurs around a wavelength of m for material at 1 AU. Scattered light decreases with the comet’s distance from the Sun as , while thermal emission decreases more steeply, being exponentially dependent upon (where is the Planck and is the Boltzmann constant and is the speed of light). Since the temperature varies as , the wavelength where scattering and thermal emission are equal moves to longer wavelengths as from 1 to 5 AU. Thus the nature of the dust emission changes as a function of heliocentric distance. For comets more distant than 3.5 AU from the sun, the dust contribution is dominated by scattered light, and for comets within 1.2 AU of the Sun it is mostly thermal emission. Between 1.2 and 3.5 AU from the Sun, the 3.6 m image is mostly scattered light while the 4.5 m image is mostly thermal emission.


These considerations lead to a simple model of comet dust that explains the general trends of the observed cometary fluxes. The model is based on the equations from Kelley and Wooden (2009). The data and three illustrative model curves are shown in in Figure 3. While the overall trend is explained, it is clear that there is still significant scatter, so that another effect, not related to the dust temperature and albedo, must be contributing to the colors. Comparing the shape of the predicted 4.5/3.6 m brightness ratio to the observations shows there are significant positive deviants: many comets are far brighter at 4.5 m than the trend versus heliocentric distance and the model predictions could explain. Many of the positive deviants are those comets for which we could clearly see that the morphology of the 4.5 m emission was different from that at 3.6 m. Thus the imaging alone already suggested that an emission mechanism other than dust was contributing. We show three model predictions in Figure 3, with each model having a different combination of dust albedo and dust temperature enhancement. The range of values that fit the observations for comets for which the images do not show a significant difference between the 3.6 and 4.5 m, i.e. for those comets whose images at both wavelengths may be dominated by dust, the range of parameters is and where is the dust albedo and is the temperature enhancement of the dust relative to that expected for rapidly-rotating isothermal grains.
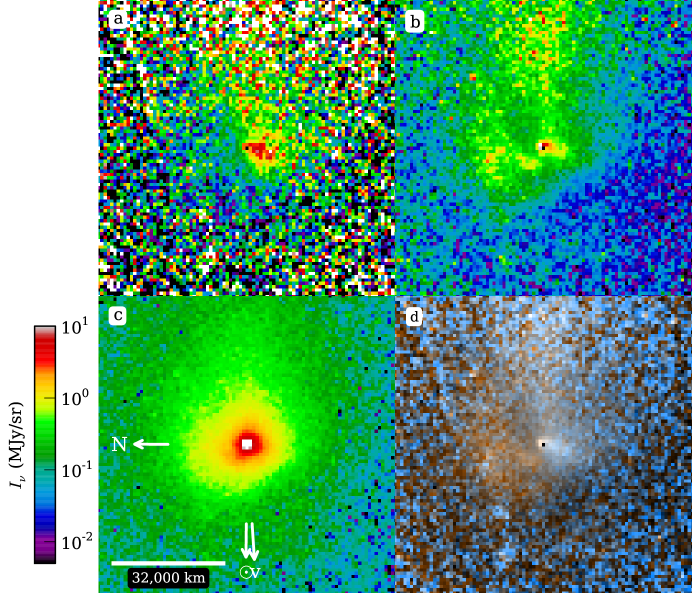
Inspecting the images for those comets that have excess flux at 4.5 m confirms that the distribution of material is different in the two IRAC bands. The most prominent outlier from the dust model is 10P/Tempel 2 observed at 3.2 AU from the Sun. The comet is relatively faint at this large heliocentric distance, but the distinction between the images at the two IRAC wavelengths is clear. At 3.6 m the comet is very compact and close to the point spread function of the telescope, with a FWHM of 2.0 pixels (2.4′′). Figure 4 shows the radial surface brightness profile. At 4.5 m the image is clearly extended, with a FWHM of 2.8 pixels (3.4′′) and comprising a compact core plus an extended component with an approximate 1/ profile where is the distance from the nucleus. The compact core in the images is the nucleus plus possibly an unresolved dust contribution. The extended emission, not from dust or the nucleus, contributes most to the flux at 4.5 m. The radius of the nucleus of 10P is relatively large, at 5.3 km (Lamy et al., 2004). Using a standard thermal model with beaming parameter 0.83 and emissivity 0.94 (Kelley et al., in preparation), the nuclear fluxes are 0.016 and 0.079 mJy, at 3.6 and 4.5 m, respectively. This suggests the compact core of the Spitzer image has comparable contributions from the nucleus and the coma, while the diffuse extended emission seen only at 4.5 m is almost entirely from gas.

The 3.6 m images are assumed to be entirely due to dust, to calculate the dust optical depth using the parameterization (A’Hearn et al., 1995; Kelley and Wooden, 2009). In this notation, is the 3.6 m albedo, is the fraction of the beam filled by dust, and is the distance from the nucleus. Table 2 shows the resulting values. These allow an assessment of the dust production rates for the comets; while not the focus of this paper, the values may be useful for other work. It is possible that the 3.6 m albedo has a contribution from the C–H stretch of hydrocarbons at 3.4 m wavelength. Spectra from Akari do clearly show this feature, with the amplitude of the feature relative to continuum being less than % in the spectra shown in Ootsubo et al. (2012).
| Comet | aa is the production rate from A’Hearn et al. (1995) supplemented by other sources for recent comets. The values of were scaled from the heliocentric distance of their observation to that at the time of each Spitzer observation as described in the text. is where the ratio of the dust production rate to the OH production rate is from A’Hearn et al. (1995). For C/2002 T7, here is for H2O in C/2007 T7 from Combi et al. (2009). For C/2006 W3, is based on OH from Bockelée-Morvan et al. (2010). For C/2007 N3, is based on OH from Carter et al. (2012). For 29P and 118P, is based on H2O from Ootsubo et al. (2012). | aa is the production rate from A’Hearn et al. (1995) supplemented by other sources for recent comets. The values of were scaled from the heliocentric distance of their observation to that at the time of each Spitzer observation as described in the text. is where the ratio of the dust production rate to the OH production rate is from A’Hearn et al. (1995). For C/2002 T7, here is for H2O in C/2007 T7 from Combi et al. (2009). For C/2006 W3, is based on OH from Bockelée-Morvan et al. (2010). For C/2007 N3, is based on OH from Carter et al. (2012). For 29P and 118P, is based on H2O from Ootsubo et al. (2012). | Classbbradius of the circular aperture centered on the nucleus that was used for measuring the flux. Inspection of the curves of growth indicate the flux does not increase more than 20% beyond these apertures, to the sensitivity of the Spitzer observations. | COccThis is the CO2 production rate under the assumption that the excess flux at 4.5 m above the dust continuum is due to CO2. In some cases (in particular, for 29P), this excess is almost certainly due to CO. In some other cases (for example, the long-period comets C/*) the production rate of CO2 is somewhat overestimated because part of the 4.5 m excess could be due to CO. | ddFraction of the 4.5 m flux in Table 1 that is attributed to CO2+CO | ||
|---|---|---|---|---|---|---|---|
| (AU) | (cm) | (s-1) | (cm) | (s-1) | |||
| C/2002 T7 (LINEAR) | 2.18 | 28.90 | 9500 | … | |||
| C/2006 W3 (Christensen) | 3.14 | 28.66 | 20000 | 28.18 0.20 | 0.47 | ||
| C/2006 W3 (Christensen) | 4.45 | 27.87 | 7600 | 27.47 0.20 | 0.52 | ||
| C/2007 N3 (Lulin) | 4.20 | 27.13 | 69 | 690 0.20 | 0.26 | ||
| C/2007 Q3 (Siding Spring) | 2.93 | 0 | 1720 | 26.78 0.20 | 0.27 | ||
| C/2007 Q3 (Siding Spring) | 4.12 | 27.11 | 350 | 25.65 0.20 | 0.24 | ||
| 2P/Encke | 2.93 | 2 | 26.55 | T | 43 | 26.05 0.20 | 0.96 |
| 2P/Encke | 1.13 | 17 | 27.58 | T | 250 | 27.11 0.20 | 0.35 |
| 10P/Tempel 2 | 3.16 | 6 | 26.32 | T | 86 | 25.58 0.20 | 0.86 |
| 10P/Tempel 2 | 2.66 | 9 | 26.58 | T | 17 | 26.53 0.20 | 0.92 |
| 10P/Tempel 2 | 1.61 | 25 | 27.14 | T | 430 | 26.78 0.20 | 0.29 |
| 19P/Borrelly | 3.58 | 101 | 27.07 | D | 82 | 24.25 0.57 | 0.04 |
| 22P/Kopff | 1.78 | 504 | 28.32 | T | 420 | 25.56 1.27 | 0.02 |
| 22P/Kopff | 2.67 | 220 | 28.68 | T | 60 | 26.04 0.20 | 0.56 |
| 29P/Schwassmann-Wachmann 1 | 6.19 | 27.64 | 5300 | 27.65 0.20 | 0.85 | ||
| 32P/Comas Sola | 1.96 | 220 | |||||
| 49P/Arend-Rigaux | 1.69 | 98 | 27.11 | T | 110 | 26.13 0.35 | 0.19 |
| 65P/Gunn | 2.58 | 35 | 27.35 | D | 870 | 26.97 0.20 | 0.51 |
| 65P/Gunn | 2.74 | 31 | 27.27 | D | 780 | 27.14 0.20 | 0.60 |
| 65P/Gunn | 2.61 | 34 | 27.33 | D | 300 | 26.98 0.20 | 0.69 |
| 77P/Longmore | 3.34 | 0 | 31 | … | |||
| 81P/Wild 2 | 1.68 | 65 | 27.73 | D | 1170 | … | |
| 88P/Howell | 1.47 | 201 | 27.48 | T | 1150 | 27.50 0.20 | 0.33 |
| 81P/Wild 2 | 2.63 | 191 | 27.44 | D | 120 | 26.32 0.20 | 0.42 |
| 94P/Russell 4 | 2.30 | 32 | 27.37 | D | 80 | 24.17 0.42 | 0.09 |
| 94P/Russell 4 | 2.34 | 100 | 27.04 | D | 5.5 | 24.47 0.20 | 0.17 |
| 103P/Hartley 2 | 3.98 | 17 | 26.61 | T | 1040 | 24.45 0.44 | 0.05 |
| 103P/Hartley 2 | 1.72 | 91 | 27.84 | T | 420 | 27.17 0.20 | 0.37 |
| 116P/Wild 4 | 2.18 | 75 | 27.30 | D | 620 | … | |
| 116P/Wild 4 | 3.02 | 39 | 26.87 | D | 150 | 24.27 0.20 | 0.13 |
| 118P/Shoemaker-Levy 4 | 2.21 | 27.06 | 120 | 26.41 0.20 | 0.38 | ||
| 118P/Shoemaker-Levy 4 | 2.01 | 27.16 | 180 | 26.52 0.20 | 0.39 | ||
| P/2010 H2 (Vales) | 3.18 | … |
4 Separating the Gas and Dust contributions to the 3.6 and 4.5 m images
Using the two IRAC images at 3.6 m and 4.5 m, a partial separation of the contributions of dust and gas can be made. This is possible because the 3.6 m filter is in a portion of the spectrum with no strong gas lines. The Akari spectral survey of 18 comets shows this clearly (Ootsubo et al., 2012). The only feature evident in the Akari spectra that would contribute to the 3.6 m IRAC band is the C-H stretching of organics which is at 3.3-3.5 m. This feature is weak in comets, and in any event may be due to organic dust grains rather than free-floating molecules. If we assume that the 3.6 m channel is due only to dust, then we can directly subtract a scaled 3.6 m image from the 4.5 m image to obtain an image only of the non-dust contribution to the 4.5 m. The simplest approach would be to scale the 3.6 m image as high as possible such that the subtracted image has no negative artifacts. This method works if the 3.6 m image has no gas, and if the dust color is the same throughout the coma. A constant dust color seems a plausible assumption. For the comets imaged during the cryogenic Spitzer mission, it was possible to better-characterize the 4.5 m excess by using three wavelengths that are dominated by dust (3.6, 5.8, and 8 m) to measure the color temperature and interpolate the dust contribution at 4.5 m. This was done for 21P/Giacobini-Zinner (Pittichová et al., 2008) and for 73P/Schwassmann-Wachmann 3 (Reach et al., 2009).
The gas production rates were estimated as follows. First, we estimate the dust contribution to the 4.5 m flux by scaling the observed 3.6 m flux. We use the model described above and shown in Figure 3 to predict the ratio of 4.5 to 3.6 m flux density at each heliocentric distance, then scale the observed 3.6 m flux by the predicted ratio and subtract from the 4.5 m flux. The remaining 4.5 m flux density is then converted to in-band flux by multiplying by the IRAC 4.5 m bandwidth (). To convert the in-band flux to CO2 production rate, we use the same scaling as was used in the Akari spectral survey (Ootsubo et al., 2012); specifically, we used their Tables to derive the ratio of production rate to flux as a function of heliocentric distance, and we scaled our fluxes by this ratio at the heliocentric distance of the Spitzer observation. Note that we are assuming that all of the 4.5 m excess is due to CO2 when making these calculations. For comets where the contribution from CO is important (e.g. C/2006 W3) or dominant (29P/Schwassmann-Wachmann 1), the CO2 production rates determined from this method are overestimates or irrelevant.
Table 2 shows the resulting CO2 production rates. The uncertainties in these values are relatively high because they result from subtraction of two comparable numbers. We used a 10% uncertainty for the fluxes, but also a minimum uncertainty in the production rate of 26% linear (0.1 in log) to account for systematics. Even in cases where the 4.5 m excess is clearly detected in the image, such as for 2P/Encke at 1.13 AU from the Sun, the ratio of 4.5 m to 3.6 m flux alone may not lead to a convincing detection because the precise dust temperature is not known, and the thermal emission is very sensitive to temperature in the Wien tail of the Planck function (see the 2P left-most circle in Fig. 3). In fact, it is only with detailed imaging or spectroscopy that any but the most extreme cases of CO2 brightness (relative to the dust continuum) can be detected convincingly.

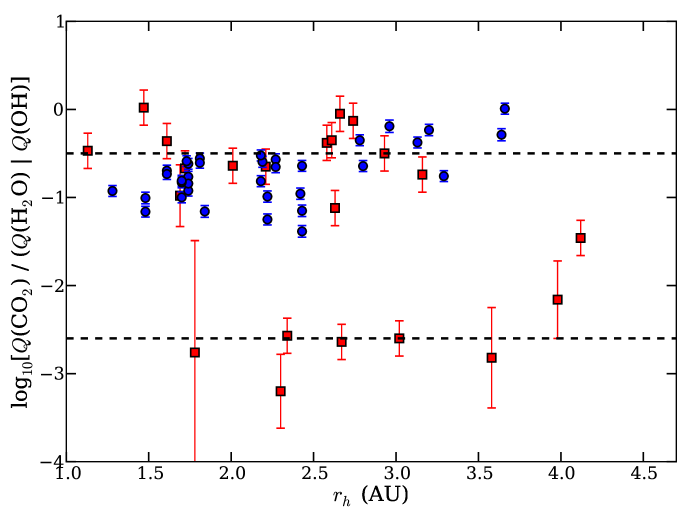
Figure 6 shows the CO2 production rate versus that of OH for direct comparison. The CO2 rates are from the IRAC data in this paper, assuming all the 4.5 m excess above dust is due to CO2 (though some of it is from CO in some comets). The OH production rates are from A’Hearn et al. (1995)222data from the Planetary Data System, Small Bodies Node, dataset EAR-C-PHOT-3-RDR-LOWELL-COMET-DB-PR-V1.0, after scaling to the heliocentric distances of the Spitzer observations. The heliocentric distance scaling was made using a simple fit
| (2) |
(where is the heliocentric distance in AU), which reproduces the heliocentric trend of the water production rate versus heliocentric distance calculated using the methods of Cowan and Ahearn (1979) and distributed by the Small Bodies Node of the Planetary Data System. A significant caveat to the OH production rates used here is that they were measured on previous apparitions of the comets, and given the changes in comets from one orbit to the next, they may not yield reliable estimates at the present time. We proceed to use them with the understanding that we are only looking for general trends in the survey, in hope that variations in some cases will be averaged out by the sample size.
It is notable that the CO2 production rates are as high as those of OH (and by inference, the parent molecule of OH, H2O) for three comets, and comparable for another 5. This indicates CO2 is a very significant component of the cometary ices and may drive a significant fraction of cometary activity. The production rate of CO2 is about 10 times lower than that of OH for 2 comets, and it is times lower for another 7 comets. The comparison between CO2 inferred from our imaging survey and that inferred from a spectroscopic survey (Fig. 6) shows that the two independent types of measurement are in statistical agreement. The spectroscopic survey is more precise, and even shows a mild trend of CO2/H2O versus heliocentric distance.
The wide spread in production rates testifies to the intrinsic diversity of comets. Figure 6 shows the ratio of CO2 to OH production rate versus heliocentric distance. If the variation in ratios were due to solar heating, e.g. because of the difference in temperatures at which CO2 or H2O ice sublimate, then there would be a trend versus . The Akari spectroscopic survey also measured the CO2 to water ratio, using the strengths of lines of each molecule in the same spectrum and having cleanly separating the gas-line emission from the dust continuum (Ootsubo et al., 2012). We include their data in Figure 6 for comparison to our results. The Ootsubo et al. (2011) show an increase in CO2/H2O for AU. For the CO2-rich comets in our survey, there are only a few measurements at AU. The lack of a trend similar to the Akari results can easily be obscured by low-number statistics, CO2/OH uncertainties, and the intrinsic scatter of the survey data. All of the comets detected by Akari would be classified as ‘CO2 rich’. There are discrepancies for individual comets when comparing in detail. We ascribe the discrepancies in the CO2 abundance estimates primarily to our use of the difference between two comparable numbers (the fluxes in the IRAC bands); the water abundances used in our survey are also just estimates (using scaled values from the A’Hearn et al. (1995) survey from previous apparitions of the comets), as opposed to direct measurements of the water line in the Akari spectra.
There is an apparent dichotomy of comets into two classes which we labeled as ‘CO2 rich’ and ‘poor’. The CO2 rich comets are 65P/Gunn (thrice), 49P/Arend-Rigaux, 10P/Tempel 2 (thrice), 88P/Howell, 2P/Encke (twice), 29P/Schwassmann-Wachmann 1, 118P/Shoemaker-Levy 4 (twice), and C/2006 W3 (twice). The ‘poor’ comets are 19P/Borrelly, 22P/Kopff (twice), 103P/Hartley 2 , 81P/Wild 2 (twice), 94P/Russell 4 (twice), 116P/Wild 4 (twice), C/2007 Q3, C/2007 N3, and C/2002 T7. In this classification 29P/Schwassmann-Wachmann 1 is called ‘CO2 rich’ but in fact from the spectroscopy survey we know that the 4.5 m excess for this comet is from CO , with abundance ratio CO/CO280 (Ootsubo et al., 2012) so it is actually ‘CO rich’ (with very little CO2). Also, in this classification C/2006 W3 (Christensen) is called ‘CO2 rich’ but the spectroscopic survey shows its proportions of H2O:CO2:CO were 10:10:36 and 10:4:10 in observations at 3.66 and 3.13 AU from the Sun, respectively; therefore C/2006 W3 is more properly ‘CO2+CO rich.’
It is noteworthy that many of the comets were observed more than once, and that, with one exception, each time the same comet was observed it was in the same class, despite the observations being at different heliocentric distance. The exception to this rule was 103P/Hartley 2, which was ‘CO2 poor’ when observed at 3.98 AU, but it was apparently ‘CO2 rich’ by the time it was observed at 1.72 AU from the Sun. For this comet, our characterization is consistent with the recent paper by Meech et al. (2011), who showed that early activity is driven by H2O, while CO2 becomes the dominant driver of activity closer to the Sun. Such behavior can be explained by seasonal effects, where some parts of the nucleus are more exposed to sunlight than others depending on their location relative to the rotational pole and the comet’s position in its orbit.
The class we infer from the infrared-derived CO2 production partially correlates with the taxonomic classes defined by A’Hearn et al. (1995) based on carbon-chain molecule depletions. Of the ‘CO2 rich’ class, there are 5 comets of ‘Typical’ carbon-chain abundance and 1 ‘Depleted’; the ‘Depleted’ but ‘CO2 rich’ comet is 65P/Gunn. Of the ‘CO2 poor’ class, there are 2 comets of ‘Typical’ carbon-chain abundance and 4 ‘Depleted’. While the correlation is far from one-to-one, it does appear that there are relatively more comets of the ‘CO2 poor’ class that are ‘Depleted’ in carbon-chain molecules. This makes some intuitive sense since both classifications involve carbon and the carbon-chain ‘Depleted’ and ‘CO2 poor’ classifications go in the same direction of having fewer carbon-bearing molecules.
5 Morphology of CO+CO2 Gas Emission from Comets
One value of the Spitzer/IRAC survey, in comparison to the recently completed Akari/IRC spectroscopic survey (Ootsubo et al., 2012), is that we can assess the spatial distribution of material from comets, including both the dust and, when present, the excess 4.5 m emission due to CO2 and CO gas. Many of the IRAC images show extended structure, including radial variations significantly deviating from and non-axisymmetric azimuthal distributions, that are distinct between 4.5 m and 3.6 m wavebands, indicating a significantly different distribution of gas and dust. In the remainder of this section we describe the features seen in some of the survey comets and present their images in such a way that readers can assess the distributions themselves.
5.1 Jupiter-family comets with distinct gas emission
5.1.1 10P/Tempel 2
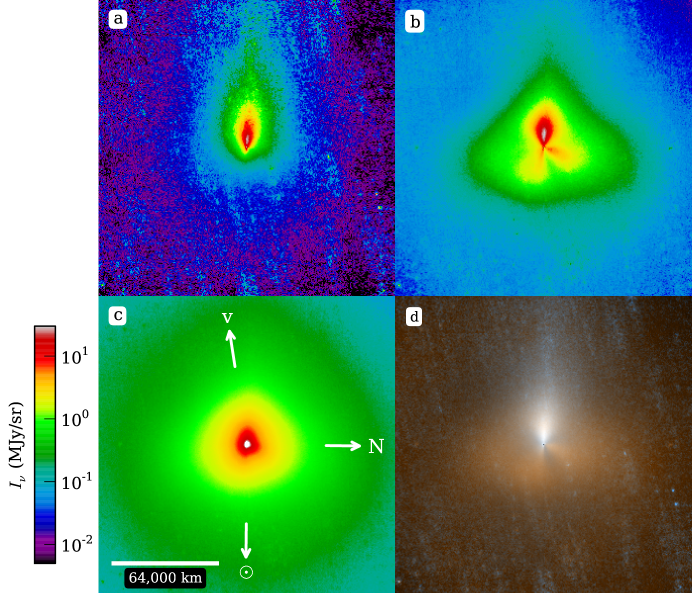
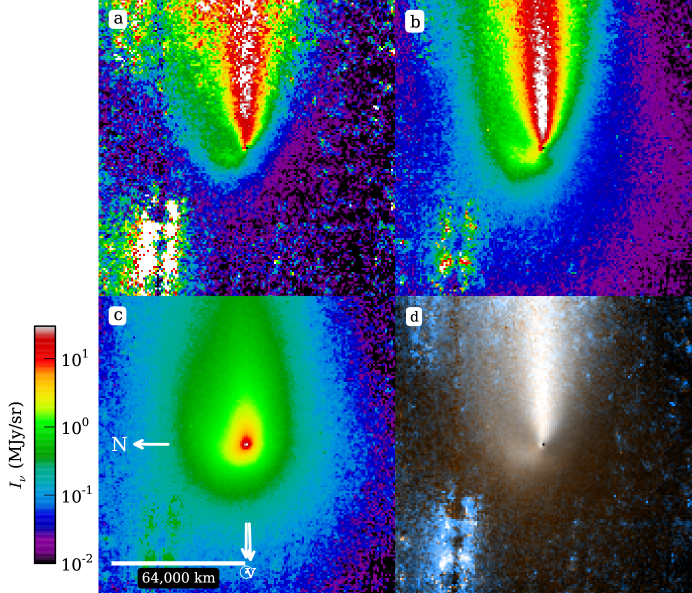
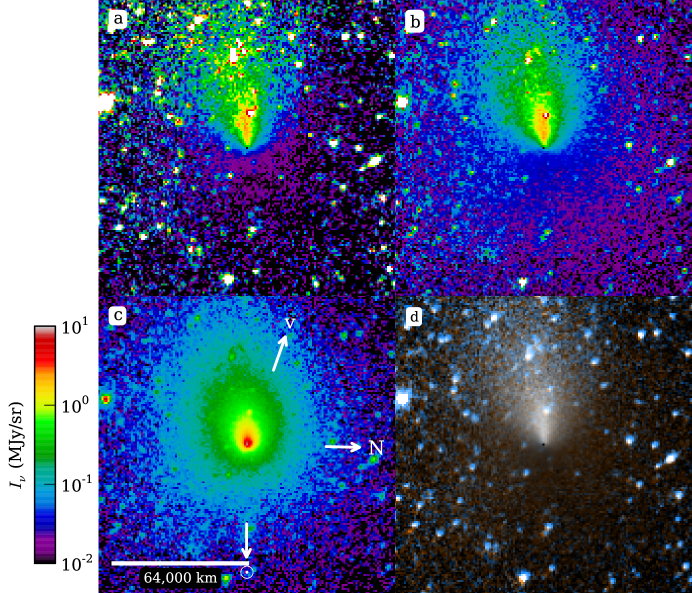
Comet 10P/Tempel 2 was observed three times during this survey. Each time, the 4.5 m emission was significantly brighter than would be expected for dust emission, based on the 3.6 m brightness. Figure 7 shows the images when observed at closest range in 2010 Sep. The image at 4.5 m showed a set of arcs, on the sunward side of the comet. The arcs and most of the emission occupy a fan-shaped region that has a full opening angle of width, and the center of the emission fan is directed East of North. We measure the sizes of the arcs by overlaying circles centered on the nucleus and quoting the radii of the circles. The closet such arc is from the nucleus (but is difficult to discern; the outer arcs are at , , and approximately from the nucleus. The pattern could be due to a strong active region on the rotating nucleus, or to a set of outbursts. If due to outbursts, and the expansion velocity is 1 km s-1, then they happened at , 3.3, 6.1, and 14 hr before the image. The pattern is not linear, and indicates either acceleration or nonuniformity (i.e. not all outbursts are of the same amplitude.
10P was covered in the Wide-Field Infrared Survey Explorer (WISE) (Wright et al., 2010) all-sky survey on 2010 Apr 27. We obtained the images from the Infrared Science Archive333http://irsa.ipac.caltech.edu/Missions/wise.html and measured the fluxes using the same aperture photometry procedure (including curve of growth analysis) that we had applied to the Spitzer data. The WISE images are substantially less sensitive than the Spitzer images, but the coma was clearly detected by WISE at all 4 of its wavelengths, with fluxes at 3.4, 4.6, 12, and 22 m of 5.0, 36, 500, and 2100 mJy, respectively. The 12 and 22 m images are clearly dominated by a dust tail, while at 3.4 and 4.6 m the images show only the coma. The relative fluxes are consistent with dust emission at 12 and 22 m; the estimated dust emission at 4.5 m based on the color temperature is less than 0.5 mJy. The 3.4 m flux is most likely scattered sunlight, from which we estimate the scattered sunlight at 4.6 m is 3 mJy. That means that the bulk (more than 85%) of the 4.6 m flux is not from dust, in agreement with our inference based on the Spitzer 2-band images.
5.1.2 2P/Encke
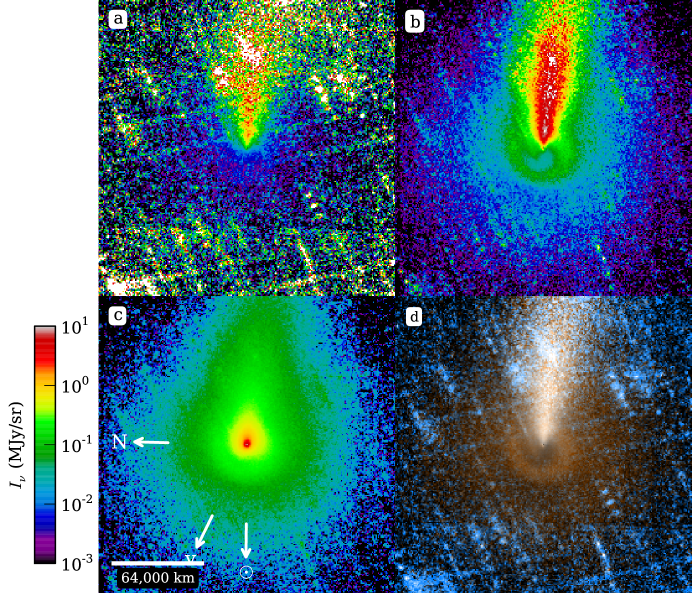
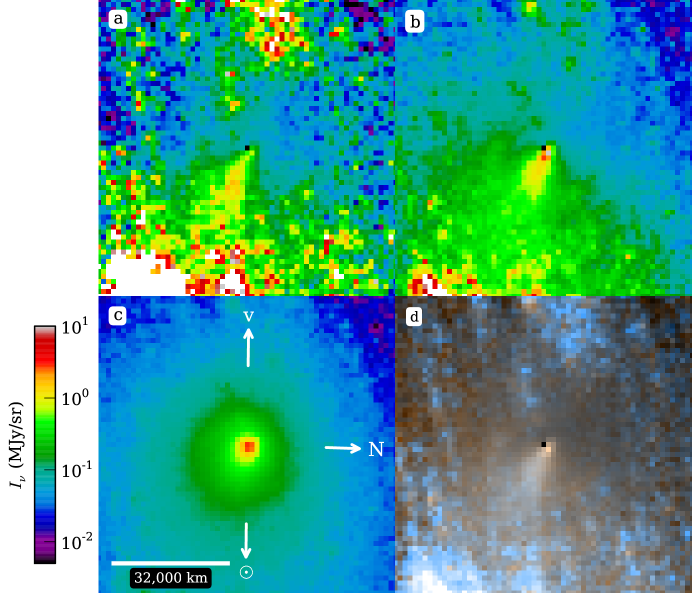
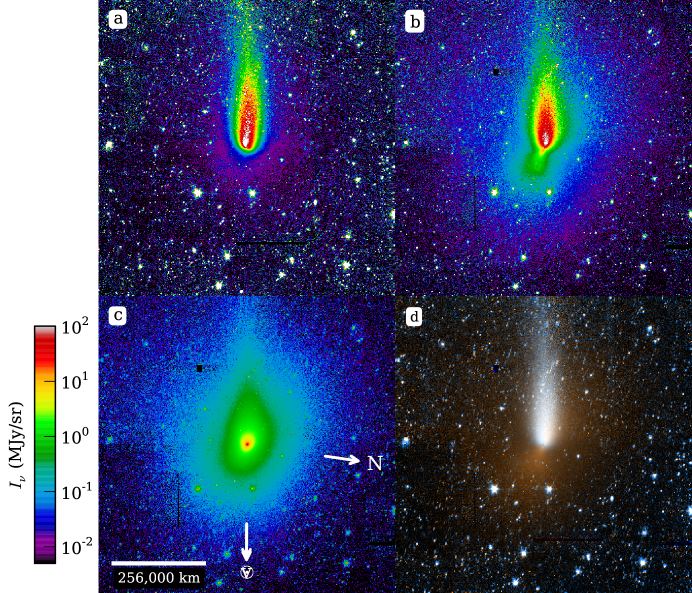
Figure 8 shows the images of 2P/Encke in 2010 Sep, when the comet was 1.1 AU from the Sun, 36 days after perihelion. This is the highest-resolution image from our deep survey, because the comet was only 0.59 AU from Spitzer at the time of observation. The arcs near the nucleus are present in both dust and gas and are due to the dominant active region that becomes active 25 days after perihelion (Reach et al., 2000). An outer arc is present at a distance (33,000 km) from the nucleus only in the gas image. The outer arc can be traced from approximately 82 near the top of the image (as displayed in Fig. 8) down to 73 near the bottom (3.5 to 3.1 km); this implies that the comet is rotating clockwise with respect to Spitzer’s vantage point. The 3.6 m and 4.5 m images are similar, especially when the lower signal-to-noise ratio of the 3.6 m image is taken into account. Encke’s debris trail is found along the projected orbital velocity vector in our 4.5 m images.
In 2003 Nov, 2P/Encke was observed as part of the cryogenic Spitzer mission, and the flux density was measured at 3.6, 4.5, 5.8, and 8 m. Figure 9 shows the spectral energy distribution together with a simple fit to the dust emission. It is evident that while dust contributes some of the 4.5 m brightness in the IRAC images, that channel is in excess of pure dust emission has a significant gas contribution. The presence of the excess was already suggested by the ratio of 4.5 to 3.6 m fluxes (Fig. 3, left-most data point), but it is even more clear from the images, which are at relatively high angular resolution with the comet at only 0.23 AU from the observatory. Figure 10 shows a gas-only image, generated by subtracting a weighted combination of the 3.6 and 5.8 m images, with the weights based on the extrapolated spectral energy distribution for scattered sunlight and thermal emission, respectively, using the model from Figure 9. The gas emission can be roughly described as a fan-shaped region in the sunward hemisphere (but not directly centered on the sunward vector). The brightness of the gas emission decreases approximately as where is the projected distance from the nucleus. This is somewhat steeper than the expected for constant and free expansion, suggesting that the gas production is not steady or the molecules are destroyed or otherwise lost as they travel further from the nucleus. The lifetime against photodissociation and ionization for CO and CO2 molecules at 1 AU from the Sun are days and days, respectively (Huebner et al., 1992). If dissociation occurs with constant probability during the time of flight from the nucleus, and the trajectories are relatively straight, then from the continuity equation the radial profile becomes
| (3) |
This radial profile of CO2 matches the observed projected profile if the gas expands from the nucleus with a speed km s-1.
The expansion velocity inferred from the Spitzer image of 2P/Encke can be compared to completely independent measurements. A compilation of observational measurements of OH line profiles velocities infers H2O expansion velocities in the 0.5–1 km s-1 range for a low-water-production-rate comet near 1 AU(Tseng et al., 2007). As a heavier molecule, CO2 would expand more slowly than H2O. The gas expansion velocity depends mainly on the physical properties of the gas, its sublimation temperature and the way it cools as it escapes the nucleus. The hydrodynamic model from Crifo and Rodionov (1997), using a gas temperature provided by Rodionov et al. (2002) applied to comet Encke in the circumstances of the observation, with nuclear radius 2.4 km (Fernández et al., 2005; Lowry and Weissman, 2007) and heliocentric distance 1.1 AU, provides a gas expansion terminal velocity of 0.56 km s-1 for pure water and 0.36 km s-1 for pure CO2. Thus the observed CO2 image size is in not quite in agreement with expectations from theory. The observed image size would require a lower expansion velocity than expected based on independent measurements.

5.1.3 22P/Kopff
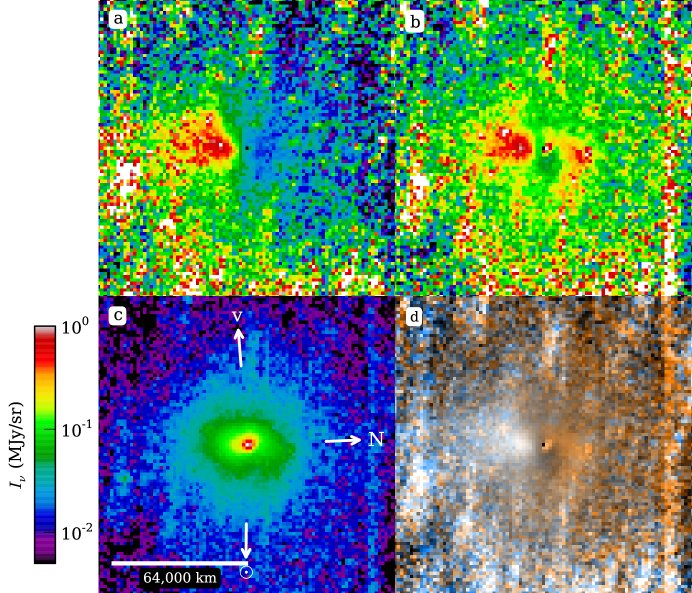
Figure 11 shows the images of 22P/Kopff in 2009 Aug, and Figure 12 shows the images of 22P/Kopff in 2010 Jan. In both cases, the 3.6 m and 4.5 m are significantly different. In 2009 Aug, there is apparent gas-only emission that is on the sunward side (but not directly toward the Sun, it is offset to the left in FIg. 11). In the 2010 Jan image, there is apparent gas-only emission roughly perpendicular to the sunward direction. This gas-only emission is as expected from an active region, possibly the same one at the two epochs (though we have not verified this with a pole orientation model), that is CO2 rich.
5.1.4 65P/Gunn
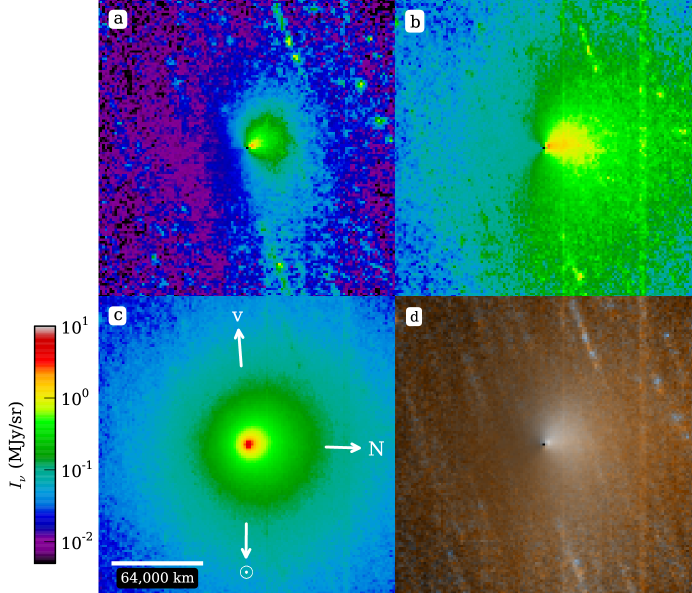
Figure 13 shows the images of 65P/Gunn in 2009 Aug, and Figure 14 shows the images of 65P/Gunn in 2010 Jul. In both images there is a dust feature that is present at both 3.6 and 4.5 m plus a larger, diffuse region that is present at 4.5 m only. The dust feature in 2009 Aug is fan-shaped and is not directed antisunward; indeed, it is almost perpendicular to the sunward vector. This leads us to suspect this is not a dust tail but rather is an active jet. In 2010 Jul, the dust feature is consistent with being a dust tail (narrow and directed antisunward). The gas feature is roughly a spherical region offset from the nucleus. In 2009 Aug, the gas feature is offset from the nucleus in the same direction as the dust feature though it is more diffuse. We suspect the emission in 2009 Aug is mostly from the same active region producing both dust and CO2.
65P was covered in the WISE all-sky survey on 2010 Apr 24. We obtained the images from the Infrared Science Archive and measured the fluxes using the same aperture photometry procedure (including curve of growth analysis) that we had applied to the Spitzer data. While the image is substantially less sensitive than the Spitzer image, the coma was clearly detected by WISE at all 4 of its wavelengths, with fluxes at 3.4, 4.6, 12, and 22 m of 9.4, 31, 810, and 5900 mJy, respectively. The 12 and 22 m images are clearly dominated by a dust tail, while at 3.4 and 4.6 m the images show only the coma. The relative fluxes are consistent with dust emission at 12 and 22 m; the estimated dust emission at 4.5 m based on the color temperature is less than 1 mJy. The 3.4 m flux is most likely scattered sunlight, from which we estimate the scattered sunlight at 4.6 m is 5 mJy. That means that the bulk (more than 80%) of the 4.6 m flux is not from dust, in agreement with the inference based on the Spitzer 2-band images.
5.1.5 88P/Howell
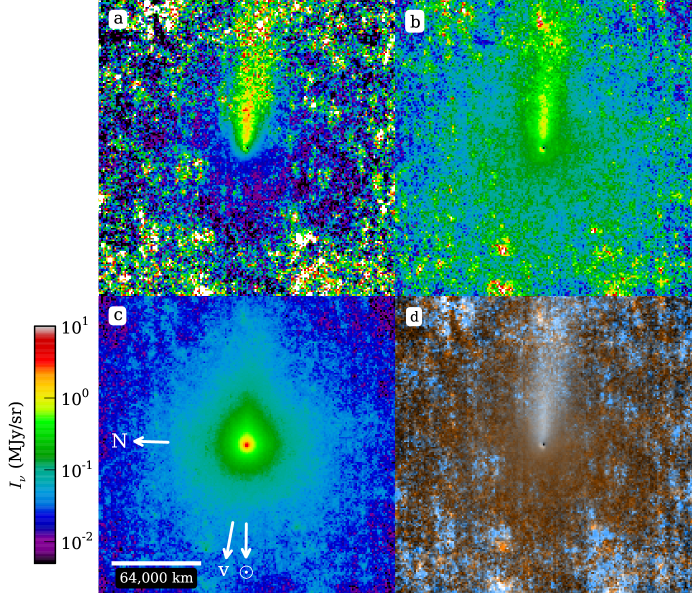
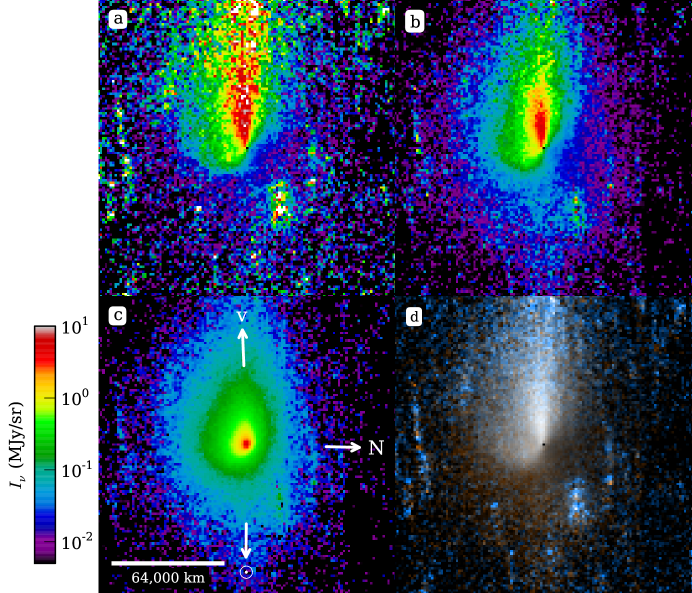
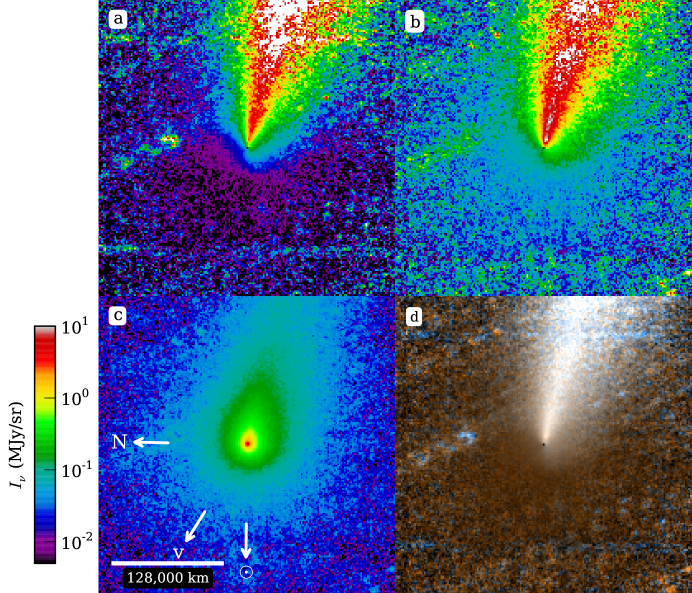
Figure 15 shows the images of 88P/Howell in 2009 Aug. The 4.5 m image has perhaps the most remarkable morphology of any of the images from the survey. While it is not as complicated as the high-quality images of 10P/Tempel 2 and 2P/Encke, the gas emission from 88P/Howell is clearly distinct and shows two very prominent jets that attach to the nucleus. A third ray emanating from the comet is the dust tail, present at both 3.5 and 4.5 m and directed away from the Sun. The two jets are at position angles and E of Celestial N. Based on its 4.5 m and 3.6 m fluxes, this comet had the highest CO+CO2 production rate among the short-period comets we observed, and it also had the highest CO+CO2 abundance relative to H2O (approximately 1:1). For comparison, the comet was observed by Akari on 2009 Jul 3 (52 days before the Spitzer observation), and the CO2 production rate was lower, with proportions 4:1 of H2O:CO2 (Ootsubo et al., 2012). It is likely that the comet’s activity actually changed significantly during the 52 days between the two observations. We suspect that the two prominent jets evident in the Spitzer images are CO2 rich, and they may be only activated between the times when the two space telescopes observed them.
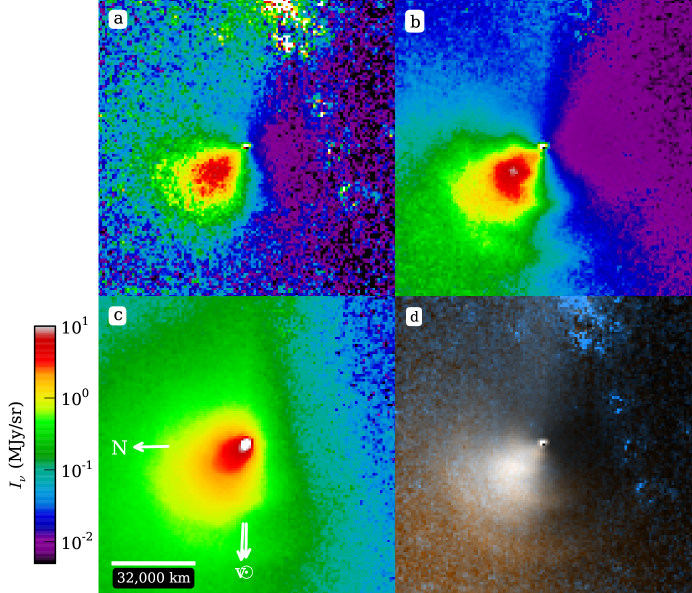
5.1.6 103P/Hartley 2
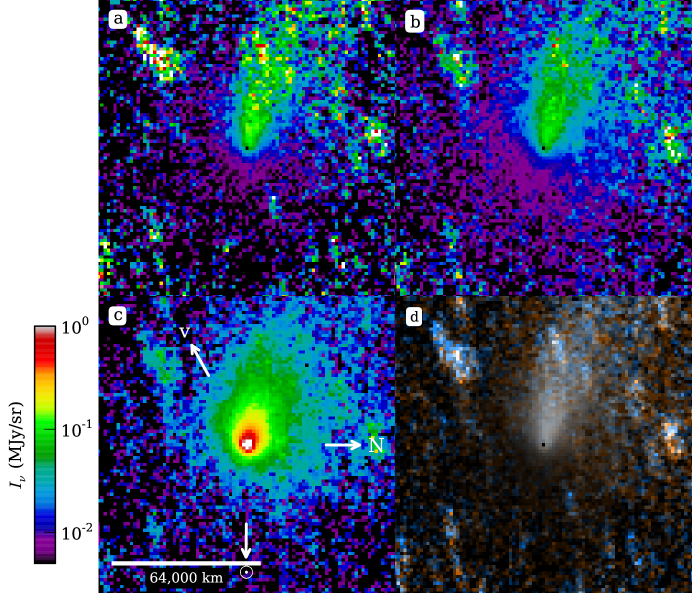
Figure 16 shows the post-perihelion image of 103P/Hartley 2. The comet is significantly brighter at 4.5 m than at 3.6 m, and it shows an unusual loop-like feature on the sunward side that is apparently gas-only (not present at 3.5 m). As the EPOXI mission target, 103P is one of the few comets with detailed nucleus images; the near-infrared instruments also discovered that the surface activity of this comet is driven by CO2, in particular from the jets, with a more distributed source of H2O from ice chunks that form a swarm around the nucleus (A’Hearn et al., 2011; Kelley et al., 2013). The Spitzer images support a strong CO2 presence, and furthermore shed some light on the wider spatial distribution of the CO2 around the nucleus. The morphology of a loop is unique among comets surveyed. In addition to the loop, there is a lower-amplitude, wide distribution of 4.5 m emission with an approximate distribution. This wider skirt of emission is consistent with a steady free expansion of CO2, with the loop superposed as an enhancement. The loop could be an edge-brightened shell form an impulsive event (outburst). If so, and the ejecta velocity is in km s-1, then the outburst occurred approximately hr before the image was taken. The loop could also be part of a spiral (seen at an angle) from the dominant active region at the end of one of the two lobes of the nucleus that was found to be extremely active during the EPOXI encounter on 2010 Nov 4. The Spitzer image was taken 83 days later than the EPOXI flyby.
5.1.7 118P/Shoemaker-Levy 4
Figure 17 shows the images of 118P/Shoemaker Levy 4 in 2009 Nov. The images are uncannily similar to those of 65P/Gunn in 2010 Jul, with a dust tail (seen at both 3.6 and 4.5 m and directed antisunward) and roughly spherical diffuse gas coma (seen only at 4.5 m).
5.2 Centaur
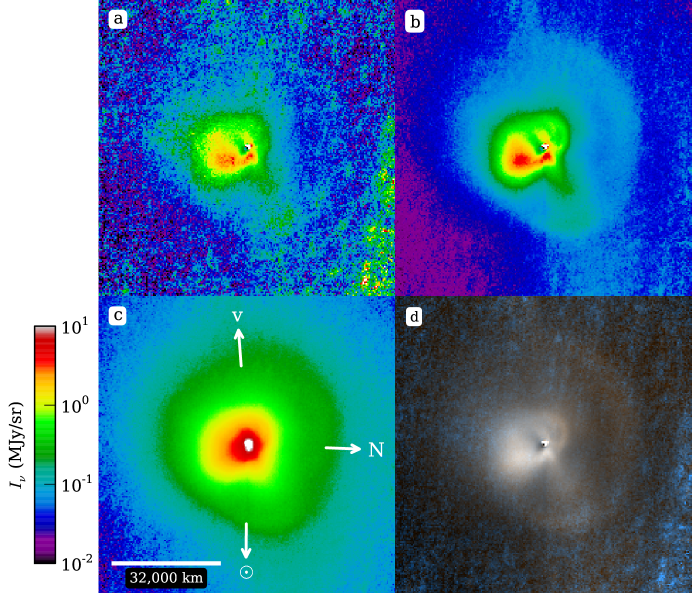
5.2.1 29P/Schwassmann-Wachmann 1
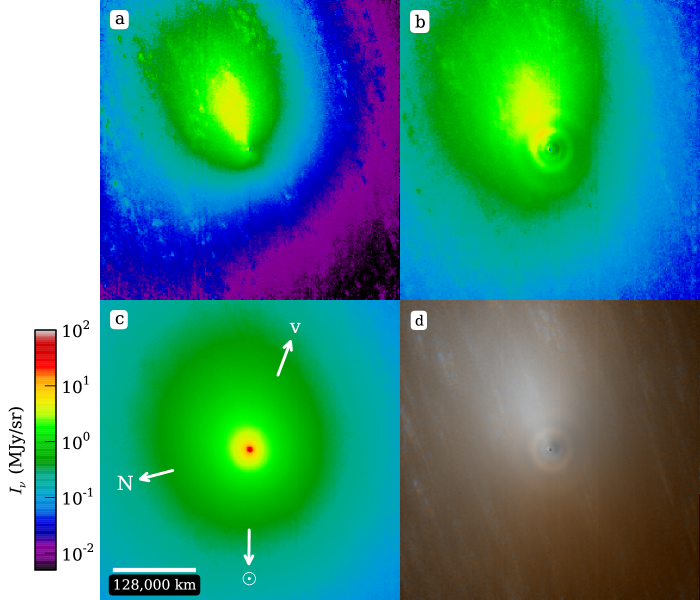
Figure 18 shows the images of 29P/Schwassmann-Wachmann 1 in 2010 Jan. The most obvious feature is a set of arcs in the 4.5 m image. These can be seen with effort even in the raw image (Fig. 18a), and they are seen easily in the image that was flattened by multiplication by distance to the nucleus (Fig. 18b) and the color combination image (Fig. 18d). The arcs appear to form an Archimedean spiral. For a single jet to generate the spiral, if we assume constant expansion at velocity , then the distance of a particle from the nucleus at time since its launch is , and the azimuthal angle (if the jet is perpendicular to the plane of the sky) is where is the period. The spiral is then
| (4) |
which we can compare to the image to measure the product of expansion speed and rotation period. We find the jet is best fit if it is inclined by from the plane of the sky. Taking this into account, a combination of km s-2 and hr works. An equally good fit using the rotation period of 14 hr from Meech et al. (1993) , and an expansion velocity of 0.5 km s-1. The observing strategy repeated the images three times, with the second and third epochs separated by 7.83 and 48.63 hr, respectively, from the first epoch. A spiral can fit all three epochs with the rotational phase of the nucleus being -30∘, and -131∘ at the second and third epochs, relative to an assumed zero phase at the first epoch.
5.3 Jupiter-family comets whose 4.5 m emission is dominated by dust
5.3.1 81P/Wild 2
Comet 81P was observed twice in this survey. The total flux was consistent with dust emission and no need for significant amounts of CO2. Even in the closer-range images taken on 2010 Apr 12, there was no distinct gas emission evident morphologically. The image at 4.5 m is much higher contrast compared to the crowded field of stars and galaxies, making it possible to detect the tail all the way to the edge of the image, from the nucleus. The brightness of the tail more than from the nucleus is at least 4 times greater at 4.5 m than at 3.6 m. But this increased brightness at 4.5 m is explained for this observation by dust emission. Referring to Figure 3, at 1.7 AU, the dust emission is predicted to be more than 5 times greater at 4.5 than at 3.6 m, a consequence of the steep Wien portion of the blackbody curve. The images at the two IRAC wavelengths are similar, which further supports the idea that the infrared emission from this comet can be explained by dust alone.
The images from 2010 Apr and 2010 Sep are shown in Figures 19 and 20. The 2010 Apr image clearly shows an antisolar dust tail due to small dust grains. That tail is not present in the 2010 Sep image. In both images, there is a jet-like feature extending from near the nucleus out to at least 30,000 km. While this feature looks like a dust tail in morphology and from the fact that it is similar at both 3.6 and 4.5 m, in fact it cannot be a dust tail. This is obvious from the 2010 Apr image, where the actual dust tail is clearly seen in the antisunward direction. Radiation pressure drives dust particles to the antisunward direction, which is labeled in each image. The jet-like feature is at a position angle E of N, which nearly toward the Sun (the sunward direction is E of N). It is remarkable that the jet-like structure has approximately the same position angle relative to the sunward direction in the 2010 Sep image. The jet is somewhat brighter at 4.5 m (compared the expectation for dust) and may be CO2-rich. It is notable that while the tail is only present in the 2010 Apr image at 1.7 AU from the Sun, the jet is present in both that image and the one at 2.5 AU from the Sun. Therefore the driver of activity for the small grains in the tail may have been activated only close to the Sun, possibly due to water ice sublimation that was subsiding by the time the comet had reached 2.5 AU. The driver of the jet, on the other hand, may have more CO2.
5.3.2 77P/Longmore
Figure 21 shows the images of comet 77P/Longmore in 2009 Aug. The 3.6 and 4.5 m images are similar, with a roughly antisolar dust tail.
5.3.3 116P/Wild 4
Figure 22 shows the images of comet 116P/Wild 4 in 2009 Jul. The 3.6 and 4.5 m images are similar, with a roughly antisolar dust tail plus a jet-like feature more on the sunward side. The images are very similar to those if 81P/Wild 2 in 2010 Apr, with the jet-like feature at nearly the same position angle relative to the sunward direction.
5.3.4 32P/Comas Sola
Figure 23 shows the images of comet 32P/Comas Sola in 2005 Jan. The 3.6 and 4.5 m images are similar, with a roughly antisolar dust tail.
5.4 Oort cloud comets
5.4.1 C/2002 T7 (LINEAR)
Figure 24 shows the images of C/2002 T7 in 203 Dec, pre-perihelion. The images are dominated by a dust tail and coma, in terms of total brightness, but there is a prominent gas jet (4.5 m only) on the sunward side of the comet.
5.4.2 C/2007 Q3 (Siding Spring)
Figure 25 shows the images of C/2007 Q3 in 2010 Mar. The images are dominated by a dust tail. However, the peak of the normalized image is significantly offset from the center of the comet. This indicates dust production is occurring within the tail. The cause appears to be a fragmentation event. On 2010 Mar 13, the day before our first observation of this comet, a fragment was discovered approximately 6′′ from the primary nucleus (Colas et al., 2010). This fragment, and any other smaller fragments produced in the preceding fragmentation event, would cause the observed offset between the tail peak and the nucleus in the normalized images.
5.4.3 C/2006 W3 (Christensen)
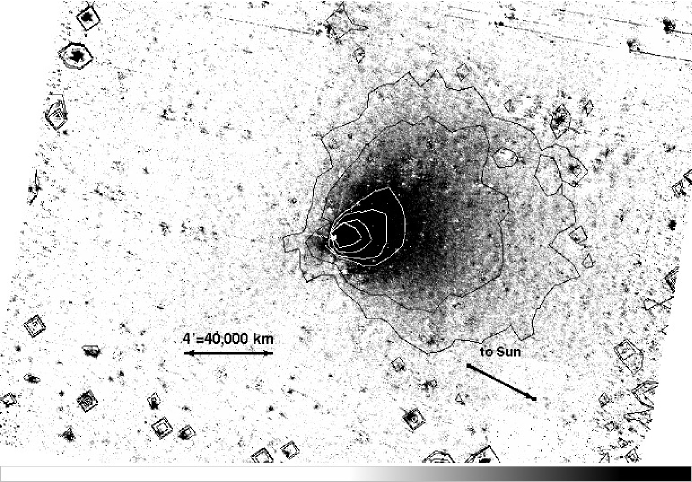
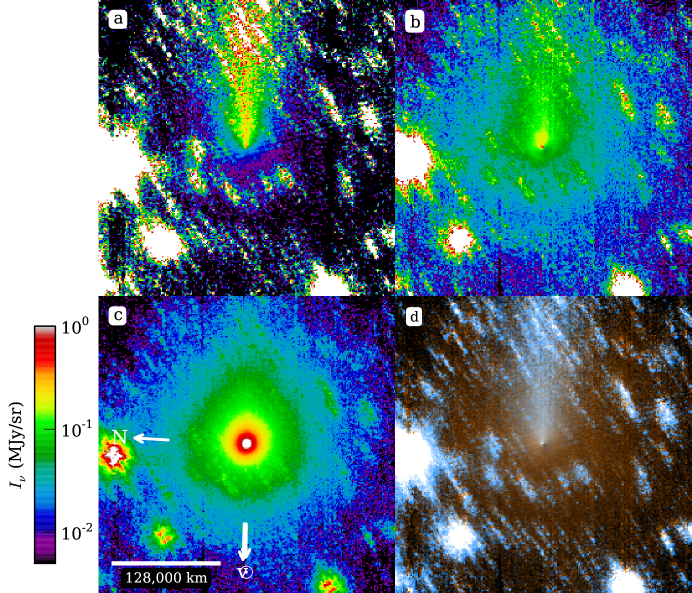
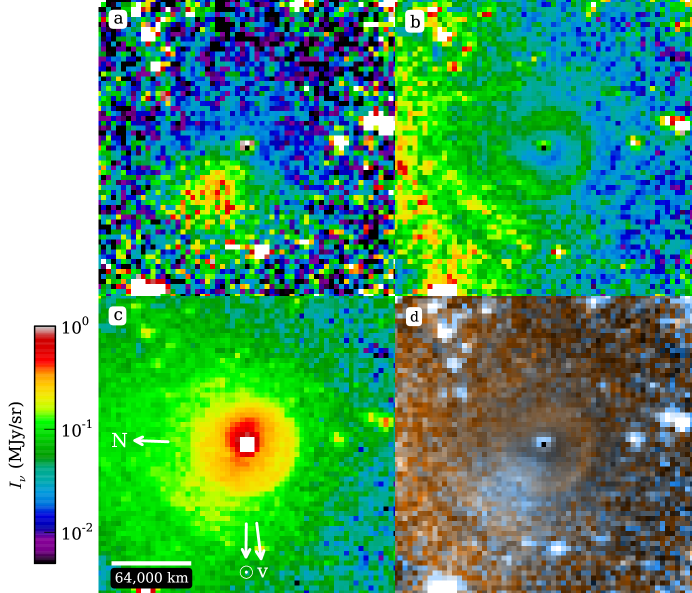
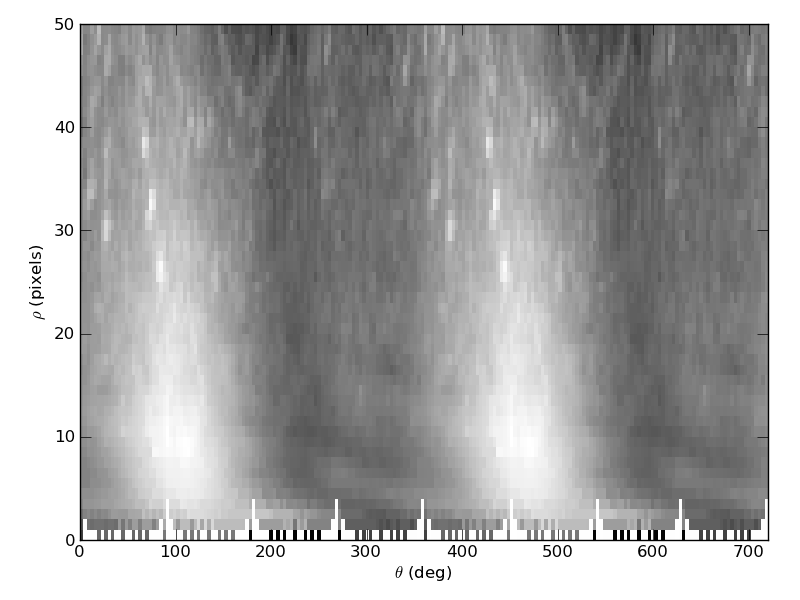
Figure 26 show the images of C/2006 W3 in 2009 Aug, when the comet was 3.1 AU from the Sun. The images show clear arc-like asymmetries, approximately as rings with centers slightly offset from the nucleus. These rings are far too distant and from the nucleus, and too high in brightness, to be diffraction rings from the central condensation (which is, in any event, an extended source due to the dust coma and not the nucleus itself). The observing sequence was repeated three times. The rings appear in each of the three images, at approximately the same locations, but with a perceptible motion away from the nucleus in sequence from the first to second to third epoch. Using the images taken 155 min apart, for the arc at 35,300 km from the nucleus, the measured projected expansion velocity is km s-1. The inferred rotation rate for the nucleus is 21 hr.
The shell-like (or spiral) features from C/2006 W3 images are only in the 4.5 m images, not at 3.6 m. This suggests that they are only present from CO2 (or possibly CO) gas and not from dust. The segregation between the gas and dust could have occurred post-ejection (and post decoupling), when the gas and dust feel different dynamical influences of solar radiation pressure; the dust, specifically, gets swept back into the anti-solar tail.
Figure 27 shows an (, ) cylindrical projection of the image taken in 2010 Jun, when the comet was at 4.5 AU from the Sun. It appears that the faint extended asymmetries in the image may be more consistent with a spiral than with spherical shells. From the measured slope of the spiral feature, an expansion velocity of km s-1 is inferred; this is in excellent agreement with the velocity from the observation taken at 3.1 AU.
Rotation periods are difficult to obtain for comets, in particular for dynamically new comets. A short period could indicate a recent (off-axis) collision or non-axisymmetric outgassing. In their review, Samarasinha et al. (2004)444data from the Planetary Data System, Small Bodies Node, dataset EAR-C-COMPIL-5-COMET-NUC-ROTATION-V1.0 show 24 comets with rotation periods measured. Of these, four are dynamically new: C/Hyakutake has a period of 6.2 hr; C/Hale-Bopp has a period of 11 hr; C/Levy is reported twice, with periods of 17 and 8.4 hr; and C/IRAS-Araki-Alcock has a period of 51 hr. The period we measure for C/Christensen is in the range of these values.
6 Conclusions
We imaged 23 comets, some at 2 or 3 epochs, using Spitzer/IRAC at 3.6 and 4.5 m wavelengths, allowing a distinction between dust and CO+CO2 gas. We assume CO2 is the dominant source of the observed 4.5 m excess flux seen in many comets, based on previous spectroscopic observations including much higher abundance of CO2 than CO; however, in some cases including 29P/Schwassmann-Wachmann 1 and C/2006 W3, CO is the more abundant molecule. The dust grains are ejected from the nucleus largely by H2O sublimation for comets in the inner Solar System, but in many cases the CO2 abundance is comparable to that of H2O. With higher volatility, CO2 and CO it can dominate at larger distances from the Sun (Meech et al., 2009).
Our survey results do not show a simple transition between H2O and CO2 as a function of heliocentric distance, suggesting any such transition occurs at AU or farther, consistent with an Akari survey of CO2 and H2O in comets. Instead, we find that some comets are ‘CO2-rich’ even at small heliocentric distance. It appears that cometary composition is heterogeneous, with marked differences between comets. The close-up images of 103P/Hartley 2 from the Deep Impact spacecraft further show that CO2-rich comet to have both types of volatiles, and it is easy to imagine that if the CO2-rich jets were inactive (as happens for 2P/Encke’s primary jet due to its ‘winter’ location on the surface relative to the comet’s the pole orientation until close to perihelion), that same comet would be H2O dominated. Some of the observations we attribute to comets being ‘CO2-rich’ could possibly be due to enhanced CO. A possibility is that CO, for example could be episodic, such as being enhanced during outbursts, and the observations we call ‘CO2-rich’ could be transient CO enhancements. This hypothesis is not supported by our results because we observed a large number of comets at random times (not triggered by optical brightness of the comets), and amateur observations did not report significant outbursts. The Akari results also show CO2 is the dominant emitter in the wavelength range of our survey (Ootsubo et al., 2011). Only 3 comets were actually detected in CO emission with Akari; in addition to the two mentioned in the previous paragraph, the third was C/2007 Q3, which we did not classify as ‘CO2 rich’. The upper limits from the Akari survey combined with our results further demonstrate that CO2 is the most likely origin for the enhanced 4.5 m brightness in the comets we classify as ‘CO2-rich’. Comets with COCO2 from the Akari survey are classified as ‘CO2-rich’; these include 118P and 88P. Additionally, 81P has 4.5 m excess (an intermediate amount that we did not classify as ‘CO2-rich’ but which is evident in a jet), despite having COCO2.
The CO2 images show several jets and spirals indicative of localized active areas on rotating nuclei. We find significantly different morphologies between the dust and gas emission in many of the survey comets. The morphologies are reminiscent of CN-jets as observed at ground-based telescopes. In some cases, gas jets are present with little or no dust; while in other cases the jets are prominent at both wavelengths and dominated by dust. The wide range of morphologies and implied compositional variations testify to a significant diversity of the nuclear properties and also heterogeneity of the individual nuclei.
Acknowledgements
This work is based on observations made with the Spitzer Space Telescope, which is operated by the Jet Propulsion Laboratory, California Institute of Technology under a contract with NASA. Support for this work was provided by NASA through an award issued by JPL/Caltech.
References
- A’Hearn et al. (2011) A’Hearn, M. F., Belton, M. J. S., Delamere, W. A., Feaga, L. M., Hampton, D., Kissel, J., Klaasen, K. P., McFadden, L. A., Meech, K. J., Melosh, H. J., Schultz, P. H., Sunshine, J. M., Thomas, P. C., Veverka, J., Wellnitz, D. D., Yeomans, D. K., Besse, S., Bodewits, D., Bowling, T. J., Carcich, B. T., Collins, S. M., Farnham, T. L., Groussin, O., Hermalyn, B., Kelley, M. S., Kelley, M. S., Li, J.-Y., Lindler, D. J., Lisse, C. M., McLaughlin, S. A., Merlin, F., Protopapa, S., Richardson, J. E., Williams, J. L., Jun. 2011. EPOXI at Comet Hartley 2. Science 332, 1396–.
- A’Hearn et al. (1995) A’Hearn, M. F., Millis, R. L., Schleicher, D. G., Osip, D. J., Birch, P. V., Dec. 1995. The ensemble properties of comets: Results from narrowband photometry of 85 comets, 1976-1992. Icarus118, 223–270.
- Bockelee-Morvan et al. (1990) Bockelee-Morvan, D., Crovisier, J., Gerard, E., Nov. 1990. Retrieving the coma gas expansion velocity in P/Halley, Wilson (1987 VII) and several other comets from the 18-cm OH line shapes. Astron. Astrophys.238, 382–400.
- Bockelée-Morvan et al. (2010) Bockelée-Morvan, D., Hartogh, P., Crovisier, J., Vandenbussche, B., Swinyard, B. M., Biver, N., Lis, D. C., Jarchow, C., Moreno, R., Hutsemékers, D., Jehin, E., Küppers, M., Lara, L. M., Lellouch, E., Manfroid, J., de Val-Borro, M., Szutowicz, S., Banaszkiewicz, M., Bensch, F., Blecka, M. I., Emprechtinger, M., Encrenaz, T., Fulton, T., Kidger, M., Rengel, M., Waelkens, C., Bergin, E., Blake, G. A., Blommaert, J. A. D. L., Cernicharo, J., Decin, L., Encrenaz, P., de Graauw, T., Leeks, S., Medvedev, A. S., Naylor, D., Schieder, R., Thomas, N., Jul. 2010. A study of the distant activity of comet C/2006 W3 (Christensen) with Herschel and ground-based radio telescopes. Astron. Astrophys.518, L149.
- Bockelée-Morvan et al. (2000) Bockelée-Morvan, D., Lis, D. C., Wink, J. E., Despois, D., Crovisier, J., Bachiller, R., Benford, D. J., Biver, N., Colom, P., Davies, J. K., Gérard, E., Germain, B., Houde, M., Mehringer, D., Moreno, R., Paubert, G., Phillips, T. G., Rauer, H., Jan. 2000. New molecules found in comet C/1995 O1 (Hale-Bopp). Investigating the link between cometary and interstellar material. Astron. Astrophys.353, 1101–1114.
- Carter et al. (2012) Carter, J. A., Bodewits, D., Read, A. M., Immler, S., May 2012. Simultaneous Swift X-ray and UV views of comet C/2007 N3 (Lulin). Astron. Astrophys.541, A70.
- Chyba and Sagan (1997) Chyba, C. F., Sagan, C., 1997. Comets as a source of prebiotic organic molecules for the early Earth. In: P. J. Thomas, C. F. Chyba, & C. P. McKay (Ed.), Comets and the Origin and Evolution of Life. pp. 147–173.
- Cochran and Schleicher (1993) Cochran, A. L., Schleicher, D. G., Sep. 1993. Observational Constraints on the Lifetime of Cometary H2O. Icarus 105, 235–253.
- Colangeli et al. (1999) Colangeli, L., Epifani, E., Brucato, J. R., Bussoletti, E., de Sanctis, C., Fulle, M., Mennella, V., Palomba, E., Palumbo, P., Rotundi, A., 1999. Infrared spectral observations of comet 103P/Hartley 2 by ISOPHOT. Astron. Astrophys. 343, L87–L90.
- Colas et al. (2010) Colas, F., Manzini, F., Howes, N. J., Bryssinck, E., Apr. 2010. Comet C/2007 Q3 (Siding Spring). IAU Circ.9135, 2.
- Combi et al. (2009) Combi, M. R., Mäkinen, J. T. T., Bertaux, J.-L., Lee, Y., Quémerais, E., Jun. 2009. Water Production in Comets 2001 Q4 (NEAT) and 2002 T7 (LINEAR) Determined from SOHO/SWAN Observations. Astron. J.137, 4734–4743.
- Cowan and Ahearn (1979) Cowan, J. J., Ahearn, M. F., Oct. 1979. Vaporization of comet nuclei - Light curves and life times. Moon and Planets 21, 155–171.
- Crifo and Rodionov (1997) Crifo, J. F., Rodionov, A. V., Sep. 1997. The Dependence of the Circumnuclear Coma Structure on the Properties of the Nucleus. Icarus129, 72–93.
- Crovisier et al. (1999) Crovisier, J., Encrenaz, T., Lellouch, E., Bockelée-Morvan, D., Altieri, B., Leech, K., Salama, A., Griffin, M. J., de Graauw, T., van Dishoeck, E. F., Knacke, R., Brooke, T. Y., Mar. 1999. ISO spectroscopic observations of short-period comets. In: P. Cox & M. Kessler (Ed.), The Universe as Seen by ISO. Vol. 427 of ESA Special Publication. pp. 161–+.
- Crovisier et al. (1997) Crovisier, J., Leech, K., Bockelée-Morvan, D., Brooke, T. Y., Hanner, M. S., Altieri, B., Keller, H. U., Lellouch, E., 1997. The spectrum of comet Hale-Bopp (C/1995 O1) observed with the Infrared Space Observatory at 2.9 AU from the Sun. Science 275, 1905–1907.
- Dello Russo et al. (1998) Dello Russo, N., DiSanti, M. A., Mumma, M. J., Magee-Sauer, K., Rettig, T. W., Oct. 1998. Carbonyl Sulfide in Comets C/1996 B2 (Hyakutake) and C/1995 O1 (Hale-Bopp): Evidence for an Extended Source in Hale-Bopp. Icarus135, 377–388.
- DiSanti et al. (2001) DiSanti, M. A., Mumma, M. J., Dello Russo, N., Magee-Sauer, K., Oct. 2001. Carbon Monoxide Production and Excitation in Comet C/1995 O1 (Hale-Bopp): Isolation of Native and Distributed CO Sources. Icarus153, 361–390.
- Eberhardt (1999) Eberhardt, P., Oct. 1999. Comet Halley’s Gas Composition and Extended Sources: Results from the Neutral Mass Spectrometer on Giotto. Space Sci. Rev.90, 45–52.
- Fazio et al. (2004) Fazio, G. G., Hora, J. L., Allen, L. E., Ashby, M. L. N., Barmby, P., Deutsch, L. K., Huang, J.-S., Kleiner, S., Marengo, M., Megeath, S. T., Melnick, G. J., Pahre, M. A., Patten, B. M., Polizotti, J., Smith, H. A., Taylor, R. S., Wang, Z., Willner, S. P., Hoffmann, W. F., Pipher, J. L., Forrest, W. J., McMurty, C. W., McCreight, C. R., McKelvey, M. E., McMurray, R. E., Koch, D. G., Moseley, S. H., Arendt, R. G., Mentzell, J. E., Marx, C. T., Losch, P., Mayman, P., Eichhorn, W., Krebs, D., Jhabvala, M., Gezari, D. Y., Fixsen, D. J., Flores, J., Shakoorzadeh, K., Jungo, R., Hakun, C., Workman, L., Karpati, G., Kichak, R., Whitley, R., Mann, S., Tollestrup, E. V., Eisenhardt, P., Stern, D., Gorjian, V., Bhattacharya, B., Carey, S., Nelson, B. O., Glaccum, W. J., Lacy, M., Lowrance, P. J., Laine, S., Reach, W. T., Stauffer, J. A., Surace, J. A., Wilson, G., Wright, E. L., Hoffman, A., Domingo, G., Cohen, M., Sep. 2004. The Infrared Array Camera (IRAC) for the Spitzer Space Telescope. Astrophys. J. (Suppl. Ser.)154, 10–17.
- Feaga et al. (2007) Feaga, L. M., A’Hearn, M. F., Sunshine, J. M., Groussin, O., Farnham, T. L., 2007. Asymmetries in the distribution of H2O and CO2 in the inner coma of Comet 9P/Tempel 1 as observed by Deep Impact. Icarus191, 134–145.
- Feldman et al. (1997) Feldman, P. D., Festou, M. C., Tozzi, G. P., Weaver, H. A., Feb. 1997. The CO 2/CO Abundance Ratio in 1P/Halley and Several Other Comets Observed by IUE and HST. Astrophys. J.475, 829–+.
- Fernández et al. (2005) Fernández, Y. R., Lowry, S. C., Weissman, P. R., Mueller, B. E. A., Samarasinha, N. H., Belton, M. J. S., Meech, K. J., May 2005. New near-aphelion light curves of Comet 2P/Encke. Icarus175, 194–214.
- Festou (1981) Festou, M. C., Feb. 1981. The density distribution of neutral compounds in cometary atmospheres. I - Models and equations. Astron. Astrophys.95, 69–79.
- Festou (1999) Festou, M. C., Oct. 1999. On the Existence of Distributed Sources in Comet Comae. Space Sci. Rev.90, 53–67.
- Gunnarsson et al. (2002) Gunnarsson, M., Rickman, H., Festou, M. C., Winnberg, A., Tancredi, G., Jun. 2002. An Extended CO Source around Comet 29P/Schwassmann-Wachmann 1. Icarus157, 309–322.
- Huebner et al. (1992) Huebner, W. F., Keady, J. J., Lyon, S. P., Sep. 1992. Solar photo rates for planetary atmospheres and atmospheric pollutants. Astrophys. Space Sci.195, 1–289.
- Kelley et al. (2013) Kelley, M. S., Lindler, D. J., Bodewits, D., A’Hearn, M. F., Lisse, C. M., Kolokolova, L., Kissel, J., Hermalyn, B., Feb. 2013. A distribution of large particles in the coma of Comet 103P/Hartley 2. Icarus222, 634–652.
- Kelley and Wooden (2009) Kelley, M. S., Wooden, D. H., Aug. 2009. The composition of dust in Jupiter-family comets inferred from infrared spectroscopy. Planet. Space Sci.57, 1133–1145.
- Lamy et al. (2004) Lamy, P. L., Toth, I., Fernandez, Y. R., Weaver, H. A., 2004. The sizes, shapes, albedos, and colors of cometary nuclei. In: Festou, M. C., Keller, H. U., Weaver, H. A. (Eds.), Comets II. Tucson: Univ. of Arizona Press, pp. 223–264.
- Lowry and Weissman (2007) Lowry, S. C., Weissman, P. R., May 2007. Rotation and color properties of the nucleus of Comet 2P/Encke. Icarus188, 212–223.
- Meech et al. (2011) Meech, K. J., A’Hearn, M. F., Adams, J. A., Bacci, P., Bai, J., Barrera, L., Battelino, M., Bauer, J. M., Becklin, E., Bhatt, B., Biver, N., Bockelée-Morvan, D., Bodewits, D., Böhnhardt, H., Boissier, J., Bonev, B. P., Borghini, W., Brucato, J. R., Bryssinck, E., Buie, M. W., Canovas, H., Castellano, D., Charnley, S. B., Chen, W. P., Chiang, P., Choi, Y.-J., Christian, D. J., Chuang, Y.-L., Cochran, A. L., Colom, P., Combi, M. R., Coulson, I. M., Crovisier, J., Dello Russo, N., Dennerl, K., DeWahl, K., DiSanti, M. A., Facchini, M., Farnham, T. L., Fernández, Y., Florén, H. G., Frisk, U., Fujiyoshi, T., Furusho, R., Fuse, T., Galli, G., García-Hernández, D. A., Gersch, A., Getu, Z., Gibb, E. L., Gillon, M., Guido, E., Guillermo, R. A., Hadamcik, E., Hainaut, O., Hammel, H. B., Harker, D. E., Harmon, J. K., Harris, W. M., Hartogh, P., Hashimoto, M., Häusler, B., Herter, T., Hjalmarson, A., Holland, S. T., Honda, M., Hosseini, S., Howell, E. S., Howes, N., Hsieh, H. H., Hsiao, H.-Y., Hutsemékers, D., Immler, S. M., Jackson, W. M., Jeffers, S. V., Jehin, E., Jones, T. J., Ovelar, M. d. J., Kaluna, H. M., Karlsson, T., Kawakita, H., Keane, J. V., Keller, L. D., Kelley, M. S., Kinoshita, D., Kiselev, N. N., Kleyna, J., Knight, M. M., Kobayashi, H., Kobulnicky, H. A., Kolokolova, L., Kreiny, M., Kuan, Y.-J., Küppers, M., Lacruz, J. M., Landsman, W. B., Lara, L. M., Lecacheux, A., Levasseur-Regourd, A. C., Li, B., Licandro, J., Ligustri, R., Lin, Z.-Y., Lippi, M., Lis, D. C., Lisse, C. M., Lovell, A. J., Lowry, S. C., Lu, H., Lundin, S., Magee-Sauer, K., Magain, P., Manfroid, J., Mazzotta Epifani, E., McKay, A., Melita, M. D., Mikuz, H., Milam, S. N., Milani, G., Min, M., Moreno, R., Mueller, B. E. A., Mumma, M. J., Nicolini, M., Nolan, M. C., Nordh, H. L., Nowajewski, P. B., Odin Team, Ootsubo, T., Paganini, L., Perrella, C., Pittichová, J., Prosperi, E., Radeva, Y. L., Reach, W. T., Remijan, A. J., Rengel, M., Riesen, T. E., Rodenhuis, M., Rodríguez, D. P., Russell, R. W., Sahu, D. K., Samarasinha, N. H., Sánchez Caso, A., Sandqvist, A., Sarid, G., Sato, M., Schleicher, D. G., Schwieterman, E. W., Sen, A. K., Shenoy, D., Shi, J.-C., Shinnaka, Y., Skvarc, J., Snodgrass, C., Sitko, M. L., Sonnett, S., Sosseini, S., Sostero, G., Sugita, S., Swinyard, B. M., Szutowicz, S., Takato, N., Tanga, P., Taylor, P. A., Tozzi, G.-P., Trabatti, R., Trigo-Rodríguez, J. M., Tubiana, C., de Val-Borro, M., Vacca, W., Vandenbussche, B., Vaubaillion, J., Velichko, F. P., Velichko, S. F., Vervack, Jr., R. J., Vidal-Nunez, M. J., Villanueva, G. L., Vinante, C., Vincent, J.-B., Wang, M., Wasserman, L. H., Watanabe, J., Weaver, H. A., Weissman, P. R., Wolk, S., Wooden, D. H., Woodward, C. E., Yamaguchi, M., Yamashita, T., Yanamandra-Fischer, P. A., Yang, B., Yao, J.-S., Yeomans, D. K., Zenn, T., Zhao, H., Ziffer, J. E., Jun. 2011. EPOXI: Comet 103P/Hartley 2 Observations from a Worldwide Campaign. Astrophys. J. (Letters)734, L1+.
- Meech et al. (1993) Meech, K. J., Belton, M. J. S., Mueller, B. E. A., Dicksion, M. W., Li, H. R., Sep. 1993. Nucleus properties of P/Schwassmann-Wachmann 1. Astron. J.106, 1222–1236.
- Meech et al. (2009) Meech, K. J., Pittichová, J., Bar-Nun, A., Notesco, G., Laufer, D., Hainaut, O. R., Lowry, S. C., Yeomans, D. K., Pitts, M., Jun. 2009. Activity of comets at large heliocentric distances pre-perihelion. Icarus 201, 719–739.
- Meech and Svoren (2004) Meech, K. J., Svoren, J., 2004. Using cometary activity to trace the physical and chemical evolution of cometary nuclei. In: Festou, M. C., Keller, H. U., & Weaver, H. A. (Ed.), Comets II. pp. 317–335.
- Murakami et al. (2007) Murakami, H., Baba, H., Barthel, P., Clements, D. L., Cohen, M., Doi, Y., Enya, K., Figueredo, E., Fujishiro, N., Fujiwara, H., Fujiwara, M., Garcia-Lario, P., Goto, T., Hasegawa, S., Hibi, Y., Hirao, T., Hiromoto, N., Hong, S. S., Imai, K., Ishigaki, M., Ishiguro, M., Ishihara, D., Ita, Y., Jeong, W.-S., Jeong, K. S., Kaneda, H., Kataza, H., Kawada, M., Kawai, T., Kawamura, A., Kessler, M. F., Kester, D., Kii, T., Kim, D. C., Kim, W., Kobayashi, H., Koo, B. C., Kwon, S. M., Lee, H. M., Lorente, R., Makiuti, S., Matsuhara, H., Matsumoto, T., Matsuo, H., Matsuura, S., Müller, T. G., Murakami, N., Nagata, H., Nakagawa, T., Naoi, T., Narita, M., Noda, M., Oh, S. H., Ohnishi, A., Ohyama, Y., Okada, Y., Okuda, H., Oliver, S., Onaka, T., Ootsubo, T., Oyabu, S., Pak, S., Park, Y.-S., Pearson, C. P., Rowan-Robinson, M., Saito, T., Sakon, I., Salama, A., Sato, S., Savage, R. S., Serjeant, S., Shibai, H., Shirahata, M., Sohn, J., Suzuki, T., Takagi, T., Takahashi, H., Tanabé, T., Takeuchi, T. T., Takita, S., Thomson, M., Uemizu, K., Ueno, M., Usui, F., Verdugo, E., Wada, T., Wang, L., Watabe, T., Watarai, H., White, G. J., Yamamura, I., Yamauchi, C., Yasuda, A., Oct. 2007. The Infrared Astronomical Mission AKARI. Publ. Astron. Soc. Japan59, 369.
- Ootsubo et al. (2011) Ootsubo, T., Kawakita, H., Hamada, S., Kobayashi, H., Yamaguchi, M., Usui, F., Oct. 2011. Survey of CO2 in 18 comets with the Japanese Infrared Satellite AKARI. In: EPSC-DPS Joint Meeting 2011. p. 369.
- Ootsubo et al. (2012) Ootsubo, T., Kawakita, H., Hamada, S., Kobayashi, H., Yamaguchi, M., Usui, F., Nakagawa, T., Ueno, M., Ishiguro, M., Sekiguchi, T., Watanabe, J.-i., Sakon, I., Shimonishi, T., Onaka, T., Jun. 2012. AKARI Near-infrared Spectroscopic Survey for CO2 in 18 Comets. Astrophys. J.752, 15.
- Pittichová et al. (2008) Pittichová, J., Woodward, C. E., Kelley, M. S., Reach, W. T., Sep. 2008. Ground-Based Optical and Spitzer Infrared Imaging Observations of Comet 21P/GIACOBINI-ZINNER. Astron. J.136, 1127–1136.
- Reach et al. (2000) Reach, W. T., Sykes, M. V., Lien, D., Davies, J. K., 2000. The formation of Encke meteoroids and dust trail. Icarus 148, 80–94.
- Reach et al. (2009) Reach, W. T., Vaubaillon, J., Kelley, M. S., Lisse, C. M., Sykes, M. V., Oct. 2009. Distribution and properties of fragments and debris from the split Comet 73P/Schwassmann-Wachmann 3 as revealed by Spitzer Space Telescope. Icarus 203, 571–588.
- Rodionov et al. (2002) Rodionov, A. V., Crifo, J.-F., Szegő, K., Lagerros, J., Fulle, M., Aug. 2002. An advanced physical model of cometary activity. Planet. Space Sci.50, 983–1024.
- Rubin et al. (2011) Rubin, M., Tenishev, V. M., Combi, M. R., Hansen, K. C., Gombosi, T. I., Altwegg, K., Balsiger, H., Jun. 2011. Monte Carlo modeling of neutral gas and dust in the coma of Comet 1P/Halley. Icarus213, 655–677.
- Samarasinha et al. (2004) Samarasinha, N. H., Mueller, B. E. A., Belton, M. J. S., Jorda, L., 2004. Rotation of cometary nuclei. In: Festou, M. C., Keller, H. U., Weaver, H. A. (Eds.), Comets II. pp. 281–299.
- Santos-Sanz et al. (1997) Santos-Sanz, P., Sabalisck, N., Kidger, M. R., Licandro, J., Serra-Ricart, M., Bellot Rubio, L. R., Casas, R., Gómez, A., Sánchez Portero, J., Osip, D., Jul. 1997. A Comparison Between Near-Infrared And Visible Imaging Of The Inner Coma Of Comet Hale-Bopp At Perihelion. Earth Moon and Planets 78, 235–241.
- Tseng et al. (2007) Tseng, W.-L., Bockelée-Morvan, D., Crovisier, J., Colom, P., Ip, W.-H., May 2007. Cometary water expansion velocity from OH line shapes. Astron. Astrophys.467, 729–735.
- Wiegert and Tremaine (1999) Wiegert, P., Tremaine, S., Jan. 1999. The Evolution of Long-Period Comets. Icarus137, 84–121.
- Woods et al. (1987) Woods, T. N., Feldman, P. D., Dymond, K. F., Nov. 1987. The Atomic Carbon Distribution in the Coma of Comet p/ Halley. Astron. Astrophys.187, 380–+.
- Wright et al. (2010) Wright, E. L., Eisenhardt, P. R. M., Mainzer, A. K., Ressler, M. E., Cutri, R. M., Jarrett, T., Kirkpatrick, J. D., Padgett, D., McMillan, R. S., Skrutskie, M., Stanford, S. A., Cohen, M., Walker, R. G., Mather, J. C., Leisawitz, D., Gautier, III, T. N., McLean, I., Benford, D., Lonsdale, C. J., Blain, A., Mendez, B., Irace, W. R., Duval, V., Liu, F., Royer, D., Heinrichsen, I., Howard, J., Shannon, M., Kendall, M., Walsh, A. L., Larsen, M., Cardon, J. G., Schick, S., Schwalm, M., Abid, M., Fabinsky, B., Naes, L., Tsai, C.-W., Dec. 2010. The Wide-field Infrared Survey Explorer (WISE): Mission Description and Initial On-orbit Performance. Astron. J.140, 1868–1881.