Effect of pressure cycling on Iron: Signatures of an electronic instability and unconventional superconductivity
Abstract
High pressure electrical resistivity and x-ray diffraction experiments have been performed on Fe single crystals. The crystallographic investigation provides direct evidence that in the martensitic transition at 14 GPa the become the directions. During a pressure cycle, resistivity shows a broad hysteresis of 6.5 GPa, whereas superconductivity, observed between 13 and 31 GPa, remains unaffected. Upon increasing pressure an electronic instability, probably a quantum critical point, is observed at around 19 GPa and, close to this pressure, the superconducting and the isothermal resistivity (K) attain maximum values. In the superconducting pressure domain, the exponent of the temperature power law of resistivity and its prefactor, which mimics , indicate that ferromagnetic fluctuations may provide the glue for the Cooper pairs, yielding unconventional superconductivity.
pacs:
74.70.Ad, 62.50.-p, 74.25.F-,74.20.MnI Introduction
The advent of superconductivity in the hexagonal phase of iron between 13 and 31 GPa, described by Shimizu et al. in 2001, was a surprise for the scientific community.Shimizu Despite the interest in this discovery, little experimental work has been done so far.Jaccard ; Alex ; Pablo ; Koshik Given the difficulties in obtaining good quality crystals and the requirement of high pressure, the detailed study of the nature of superconductivity remains a thrilling challenge.
Low pressure -Fe has a body center cubic (bcc) structure and undergoes a martensitic transition to hexagonal (hcp) -Fe for pressures higher than 12 GPa.Bancroft ; Bassett ; Wang According to Ref 9 and 10, the -Fe phase is non-magnetic.Taylor ; Nasu Besides, it has been reported that under pressure Fe loses its ferromagnetic character due to the widening of the d band (i.e. a reduction in the density of states), and then transforms into the hcp -Fe phase, emphasizing the driving role of magnetism.Ekman ; Mathon The superconducting state emerges in this hexagonal phase above 13 GPa and reaches a maximum of 2.2 K around 20 GPa before disappearing at 31 GPa.Shimizu ; Jaccard ; Alex ; Pablo
The origin of Cooper pairing, whether it is mediated by phonons or by magnetic fluctuations still needs to be unveiled. Although there has been no direct proof yet, the possibility of electron-phonon (el-ph) coupling is highly unlikely. The rapid disappearance of superconductivity (SC) at 31 GPa compared to the slower change of elastic properties (i.e. the el-ph coupling), and the presence of magnetic fluctuations do not support this conjecture.Mazin Theoretical studies by Jarlborg et al. have also questioned the el-ph coupling mechanism.Jarlborg Density functional theory calculations have predicted the existence of the ordered antiferromagnetic (incommensurate spin density wave) state in a small pressure region.Thakor Recently, evidence for weak magnetism, presumably antiferromagnetic fluctuations, at pressures greater than 20 GPa has been provided by x-ray emission spectroscopy.Monza
The low temperature resistivity of -Fe has an unusual temperature dependence up to at least , with a large value of coefficient , which exhibits a similar pressure dependence as the one of the superconducting .Alex ; Pablo SC is highly sensitive to crystal disorder and the upper critical field Hc2 ( 0.7 T) is enhanced compared to the low superconducting value.Alex These observations point towards an unconventional nature of SC, mediated by spin fluctuations, possibly of ferromagnetic nature.
In this paper, we report high pressure x-ray diffraction and electric transport measurements on good quality Fe single crystals. In order to address the question of the role of pressure conditions (hydrostaticity) on the transition of Fe, which was reported to be very sensitive to the pressure medium,Taylor the present resistivity investigation was performed in a different pressure medium (pyrophyllite) and is compared to previous studies. Furthermore, pressure cycling (increasing and decreasing) has been implemented to check the effect on the transport properties near the superconducting and magnetic/martensitic transitions. A broad hysteresis is observed on pressure cycling in the room temperature resistivity (in agreement with x-ray diffraction) as well as in low temperature transport parameters. Amazingly the superconducting does not show a similar effect on pressure cycling. This qualitative discrepancy is consistent with the existence of a threshold residual resistivity for the occurrence of the superconducting state, which is a hallmark of unconventional SC. The transport parameters are analyzed in the light of weakly ferromagnetic compound like ZrZn2 Smith or the triplet superconductor Sr2RuO4 Mackenzie .
II Experiments
The single crystal diffraction study at high pressure was performed on I15, the Extreme Condition Beamline at Diamond Light Source, UK. A monochromatic beam ( keV) was focussed onto a thin (24 m) single crystal (whisker) placed in a diamond anvil cell (DAC). The faces of the whisker were the 100 and the largest sample surface (5034 m2) was perpendicular to the incident wave vector. An area detectorATLAS inclined by with respect to the incoming wave vector was used to collect the single crystal images (exposure time of 1 second) while scanning the axis. Daphne oil 7373 was used as a pressure medium and the pressure was measured by the ruby fluorescence technique.
Resistivity measurements were performed on a Fe whisker with a residual resistivity ratio RRR. Our previous transport measurements were initially made using steatite Alex ; Pablo and subsequently Daphne oil Koshik as pressure transmitting media. From the width of the superconducting transition of the Pb manometer the pressure gradients () in both media were estimated to be about 5 and 3, respectively. In the literature, the width () of the transition of Fe was reported to be very sensitive to the pressure medium, ranging from in helium to more than 10 GPa in a medium of very poor hydrostaticity, like aluminium oxide. In spite of many efforts, we could not succeed to increase sufficiently the maximum pressure of our helium DAC for resistivity measurements.Holmes ; Thesis Therefore we decided to try the opposite way and deliberately chose to measure in pyrophyllite, a pressure medium with a relatively low hydrostaticity. This modification was found to be quite compatible with our standard technique where samples and the Pb manometer are inserted in between two soft solid disks.Jaccard2 Furthermore with the replacement of steatite by pyrophyllite the pressure cell remained stable while releasing the load, allowing us to cycle the pressure. In pyrophyllite, we obtained . Pressure was changed at room temperature and the resistivity of Fe was normalized to cm at ambient conditions.Serway Given that the sintered diamond anvils of the Bridgman pressure cell are slightly magnetic, special care was taken to obtain the correct superconducting transition temperature of Pb and thus the corresponding pressure inside the cell. An external low field coil was used to compensate any remanent magnetic field of the anvil cell.
III Results
III.1 X-ray diffraction
Figure 1a and 1b are single crystal diffraction patterns of iron just below and almost above its martensitic transition around 14 GPa. Each pattern is the sum of 40 raw images corresponding to a scan of 20∘ in the steps of . With increasing pressure there is a clear change in diffraction pattern and the single crystal spots tend to become powder arcs. After two pressure cycles (5 - 20 GPa) the patterns are almost completely dominated by powder rings (not shown). The images shown in figure 1 correspond to the first pressurization.
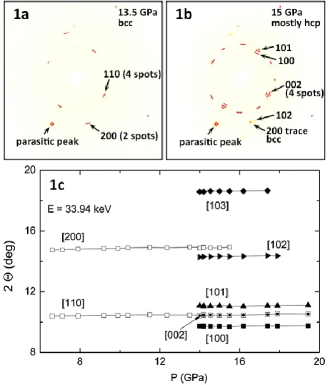
As expected in the bcc phase (Fig. 1a) there are four 110 and two 200 diffraction spots. The most interesting point in Fig. 1b is that each 110bcc reflection changes into a 002hcp reflection. In addition, each 002hcp reflection is followed by one 100hcp and one 101hcp reflection, and additionally eight 101hcp reflections appear (Fig. 1b). Thus the bcc whisker transforms into four hcp domains related by the four-fold rotation along [100]bcc axis. To our knowledge this is the first direct evidence of this well admitted microscopic path of the martensitic transformation.Wang Fig. 1c shows the Bragg angles of the diffraction spots or powder rings vs. . It shows that the bcchcp transition starts a bit below 14 GPa. From the spot intensities, it appears that qualitatively a large fraction of the iron sample transforms in a narrow pressure interval ( 1 GPa) in agreement with the first order character of the structural transition.Jephcoat However, there are weak traces of the 200bcc reflection up to 15.5 GPa and this allows us to roughly estimate the total transition width GPa in agreement with the literature.Mathon ; Monza The pressure dependence of the 110bcc reflection shows a smooth variation with and becomes the 002hcp reflection. The 102 and 103 reflections of the hcp phase are very weak and undetectable beyond 17.4 or 17.9 GPa, respectively. For decreasing pressure the hcp phase is observed down to pressures much lower than 14 GPa, and the hcpbcc transition occurs around 7 GPa with a similar width as for increasing p. Accordingly our results confirm the large pressure hysteresis of 7 GPa observed in previous studies.Taylor For the second pressure cycle we obtained the same values for the transition pressure and width.
III.2 Resistivity
Following our previous studies on Fe in Daphne oil and steatite media,Alex ; Pablo we performed electrical resistivity measurements from room temperature down to 50 mK and up to 21 GPa using pyrophyllite as pressure medium. The normal state as well as the superconducting properties in pyrophyllite were found to be almost identical to those measured in other media. The resistivity of -Fe is weakly pressure dependent. As a function of temperature, exhibits the typical properties of a long-range ferromagnetic metal with large Curie temperature and then varies superlinearly due to the addition of the el-ph and electron-magnon scattering terms. In comparison, of -Fe is strongly enhanced and more pressure dependent. The residual resistivity is increased by one order of magnitude and with up to about 30 K, and an enhanced value of . At higher temperatures evolves towards a nearly linear temperature dependence. We do not show these data here in order to avoid repetition. However we have combined the results from previous measurements with the new data to bring forth a consistent picture of the transport properties of Fe.
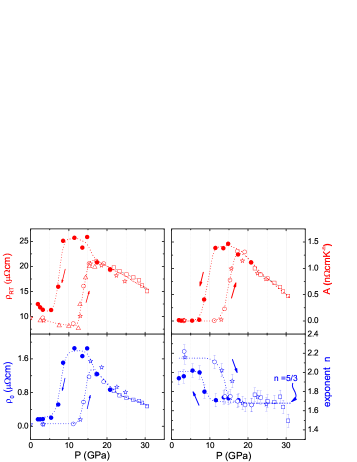
Figure 2 shows the pressure variation of the room temperature resistivity , as well as the low temperature parameters , and up to 30.5 GPa. Upon increasing , our recent measurements (GPa) match quite well with the data obtained in steatite (GPa) Pablo as well as with previous data Jaccard ; Alex ; Koshik . The important point is that the pressure cell remained quite stable when using the pyrophyllite medium and thus enabled us to cycle the pressure. There are two main new results. First, the resistivity as parameterized by , , and shows a broad hysteresis of roughly GPa around the martensitic transition, in agreement with the x-ray diffraction data. Second, with decreasing , the hysteresis starts at about 19 GPa which is the pressure of the maximum of the superconducting transition temperature .
Concerning , enhanced magnetic scattering when transiting from ferromagnetic -Fe to non-magnetic -Fe leads to the increase in resistivity. The width of the transition GPa, as observed in steatite is slightly broader in pyrophyllite and narrower in Daphne oil. With decreasing pressure, the -Fe phase persists with a continuous rise in resistivity down to roughly GPa, before collapsing to -Fe. Similar to , also shows a broad hysteresis and recovers low values for GPa. The can be influenced by the change in the el-ph coupling, thus the hysteresis seen in is a better signature of an intrinsic hysteresis at the magnetic (martensitic) transition. This result is the first indication of a hysteresis in the low temperature properties of iron.
The coefficient follows a similar trend as that of and , showing a large increase at the transition and then slowly decreasing in the -Fe phase. The increase in can be associated with the enhanced spin fluctuations upon the transition to the -Fe phase. Its large value evidences a strongly correlated phase and supposedly the maximum observed at GPa signals the location of a quantum critical point (QCP). The extended -Fe phase upon decreasing pressure leads to the increase in the value down to 12 GPa. The exponent also shows a hysteresis with pressure cycling, going from 2.1, characteristic of a long-range ferromagnet like -Fe, to the more exotic value in the -Fe phase. The exponent indicates the ferromagnetic nature of the spin fluctuations.Lonzarich The variation in near the low pressure regime could be related to the ferromagnetic domain wall scattering.
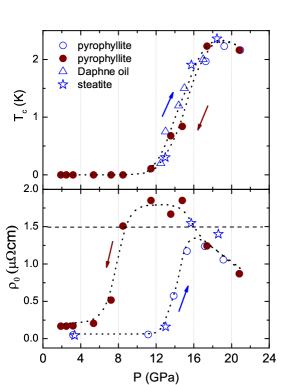
The top panel of Fig. 3 exhibits the pressure dependence of the onset of the superconducting transition , where drops by of its lowest normal state value just before transiting. With increasing pressure is first detected at GPa, reaching a maximum value of K at GPa, in good agreement with previous reports.Shimizu ; Jaccard ; Alex ; Pablo However, does not show a large hysteresis while decreasing pressure and it is even lower around GPa in comparison to the increasing pressure data. Although the -Fe phase exists prominently down to GPa with a notably large coefficient, decreases sharply and vanishes at the same pressure at which it had initially appeared. This behavior is unexpected and at first sight it seems to contradict the view that SC evolves concomitantly with the coefficient, suspected to reflect the strength of the superconducting coupling in a spin fluctuation scenario.Alex ; Pablo Nevertheless, such an argument neglects the pair breaking effect due to the increase of beyond cm while decreasing pressure, as shown in the lower panel of Fig. 3.Alex ; Thesis The absence of a hysteresis in due to the increase of beyond cm is consistent with the notion of unconventional SC in -Fe.
The temperature dependent part of the resistivity is plotted in Fig. 4 against for increasing pressures between 15.3 and GPa. Excellent fits (dashed lines) are obtained up to a temperature , where data start to deviate upwards due to the rapid rise of the el-ph resistivity term. The slopes of the fits are the coefficients shown in Fig. 2. In fact, the law is accurately followed already from temperatures just above (see different plots in Ref. Alex, and Pablo, ) and then extends over more than an order of magnitude up to . It is also noteworthy that the law is observed for pressures that cover almost the entire superconducting domain, GPa. Moreover, as shown in the inset of Fig. 4, finds its maximum around 21 GPa, i.e. close to the maxima of , and . Usually, one expects A-1/2 for a normal Fermi liquid (n = 2), while in this case the higher , the higher . Such a correlation, also observed in heavy fermions or Fabre salts can be considered as an indication of a QCP in -Fe in the vicinity of 20 GPa.Jaccard3 ; Sabina In addition it seems unlikely that the maximum might be due to an artefact of the el-ph term given that its pressure dependence is expected to be monotone (see the discussion section).
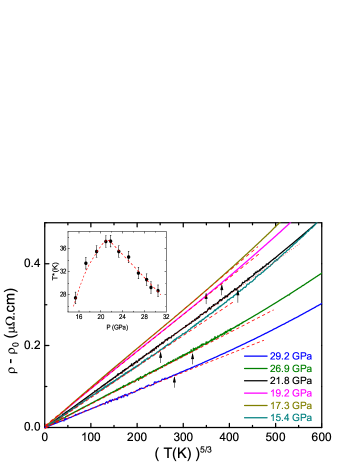
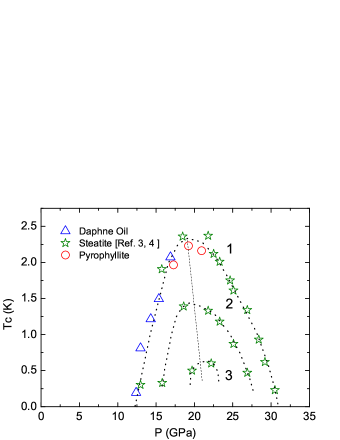
Figure 5 shows the pressure dependence of the superconducting , estimated from three different criteria corresponding to the resistivity drop of 1, 10, and 100. To draw a comprehensive phase diagram for Fe, the recent data obtained in pyrophyllite are completed by previous measurements done in steatiteAlex ; Pablo and Daphne oilKoshik . Using the drop criterion (), our results confirm the bell-shape of , originally discovered by Shimizu et al.Shimizu The pressure domain and the maximum K are similar. For good samples (RRR at ) of different origins, all our results agree without exception. Moreover, the values observed in Daphne oil, steatite and pyrophyllite are in good agreement with each other. A slight difference seems that the drop is somewhat more rapid in the best medium which is Daphne oilKoshik . The superconducting transition is very broad in temperature and most often partial for all these media. Considering a more restrictive criterion like , the superconducting region shrinks in and , whereas the complete () transitions are limited to a narrow pressure domain between 19 and GPa with maximum of only K. In fact, the curve exhibits a small asymmetry and its maximum in depends slightly on the resistivity criteria (dashed line in Fig. 5). Both and have maxima around GPa. The detection of complete resistive transitions strongly depends on the measuring current or on the applied magnetic field, suggesting the existence of superconducting islands with weak links. SC starts to be suppressed for current densities as low as A/cm2 or in magnetic fields of a few Gauss. Conversely with the criterion, SC is much more robust. No decrease of was detected for A/cm2 and a relatively high upper critical field T was observed for such a low metal. Let us add that small Meissner signals have been reportedShimizu , but we did not find any bulk signature of SC by ac-calorimetry. The independence of results from the pressure conditions strongly suggests that the curve and in particular its rise above 12 GPa is intrinsic in nature. Presumably, similar results would be obtained in solid helium (i.e. in the pressure medium with the highest hydrostaticity) because the very broad superconducting transition comes mainly from the sample limitation and is not an experimental artefact.
IV Discussion
The x-ray diffraction measurements performed at room temperature in Daphne oil pressure medium give a width GPa for the transition of Fe. The order of the structural transition is not yet established since it is a displacive transformation.Dupe In comparison, the transport measurements which probably reflect principally the magnetic collapse indicate a larger width. For any K, the resistivity (see Fig. 2) dramatically increases in the pressure interval 12.5 - 15.5 GPa. Most likely only a small part of this increase is due to the change of the el-ph couplingAlex , as inferred from investigation of metastable non-magnetic -Fe.Bohnenkamp The width of the transition GPa agrees with the value GPa observed by x-ray magnetic circular dichroism.Mathon Moreover, we find that is nearly the same in Daphne oil, steatite or pyrophyllite media, i.e. weakly dependent on the pressure conditions, in disagreement with Taylor et al.Taylor who reported different for different pressure media. Our observations are consistent with a width considerably larger than the respective inside the pressure cell (in the range ), and indicate that is intrinsic to the structural and magnetic transition. Thus the growth of anomalous scattering up to a hypothetical QCP located around 19 GPa is a genuine property of -Fe.
Interestingly, the room temperature resistivity has a cusp at GPa in steatite as shown by studies with small pressure incrementsJaccard , and an even bigger cusp ( jump) in Daphne oil. This sharp anomaly marks the start of the breakdown of the long-range ferromagnetic order which slightly precedes the structural transition by about GPa.Mathon Moreover, as the emergence of SC coincides with the cusp in , the coexistence of SC with ferromagnetic clusters seems clear at least up to GPa. At that pressure the exponent of the temperature power law of resistivity is already locked to = 5/3, reflecting the presence of ferromagnetic spin fluctuations. Aside from that it is instructive to compare the behavior of Fe with Pb (our manometer), which undergoes a martensitic transformation between 13 and GPa.Kuznetsov In this pressure window, increases smoothly by around without any cusp. At low temperature the superconducting resistive transition at remains narrow and does not deviate from its slow decrease with increasing . Apparently the phonon modes responsible for the conventional SC in Pb are not affected by the structural transition.
The most interesting result of the pressure cycling is that the increasing and decreasing data merge only at GPa, suggesting that the magnetic transition has a tail and that non-magnetic -Fe is realized only for . This is true for the four quantities shown in Fig. 2, but not for presumably due to a sharp pair breaking effect. For instance considering the coefficient, above 12.5 GPa where the transition starts, the difference between the decreasing and increasing values can be viewed as directly linked to the amount of magnetic clusters, remnant of the ferromagnetic -Fe. The scenario is that these magnetically unstable clusters induce ferromagnetic fluctuations which grow up to a QCP marked by the vanishing of at . As a result at the QCP the resistivity is maximum and in particular the coefficient as well as the superconducting . Furthermore the = 5/3 temperature power law of resistivity extends up to a maximum at almost the same . It is noteworthy that, at a pressure close to , a cusp has been reported in the weak magnetic signal detected by x-ray emission spectroscopy.Monza However, such a feature could also be related to other types of electronic instabilities like an electronic topological transition.Glazyrin With decreasing , the strength of the interaction between the electrons and spin fluctuations is maximum at about 13 GPa where takes its maximum, indicating that the electronic instability has the same hysteresis as the structural transition. This electronic instability appears to be a precursor sign of the long range ferromagnetic order which becomes stable around 7 GPa below the instability. The decrease of at lower would be due to the progressive growth of ferromagnetically stable clusters on approaching the bcc phase. Up to now it is not clear why the total width of the magnetic transition including its tail corresponds to the observed broad hysteresis of 7 GPa, but our observation supports the driving role of magnetism in the transition of Fe. With increasing , the value of the coefficient appears to track , implying that the same ferromagnetic fluctuations responsible for the non-Fermi liquid behavior in resistivity may also be responsible for the superconducting pairing interaction. Moreover, reaching 31 GPa, the coefficient seems to fall below a certain minimum threshold value, necessary for SC. However, this point is less clear for the emergence of around 13 GPa, simply because the and variations are too rapid and likely to be smeared by the gradient.
The absence of hysteresis in (Fig. 3) suggests the existence of a certain value, beyond which SC is suppressed. Indeed a strong enhancement of is observed in the hcp phase, mimicking the one seen in . As to its origin, pressure cycling may induce some micro-structural changes leading to a slow decline of the single crystallinity, as can be inferred from the x-ray diffraction data. However, these changes are not very significant, at least in affecting , since it finally recovers to low values at low pressure. As an alternative explanation, we suggest that the effect of lattice disorder on gets substantially amplified by spin fluctuations in this particular pressure region, hence leading to the observed enhancement in . Coming back to an eventual threshold value of for SC, such a phenomenon is also found for example in in the pressure-induced superconductor CePd2Si2.Raymond Actually, the best documented case is the spin triplet superconductor Sr2RuO4 for which non-magnetic impurities kill the superconducting state when the carrier mean free path falls below the superconducting coherence-length . Mackenzie et al. have shown that the generalized theoretical model for non-magnetic impurities in an unconventional superconductor (which is based on the pair breaking Abrikosov-Gorkov theory for magnetic impurities in BCS superconductors), fits very well with the dependence of .Mackenzie A threshold of = 1.1 cm was established for Sr2RuO4 samples of different chemical purities. For Fe, when the impurity level is below ppm the crucial parameter is not the chemical purity but the metallurgical state of the sample.Alex The threshold cm was estimated by controlling the intrinsic sample disorder, either by rolling (cold work induces dislocation defects) or by annealing. The electronic mean free path l has a threshold value around 10 nm for SC. According to the critical field data, the coherence length appears to be close to l, i.e. the clean limit is required which supports an unconventional nature for the paring mechanism. For Sr2RuO4 a narrow transition is observed at when is much lower than the threshold value. This condition is never satisfied in Fe and thus only broad transitions are observed. Moreover, when decreases, the criterion introduces further limitations because . Obtaining narrow resistive transitions would be essential in order to progress in the study of SC of Fe. However, there is little hope for that as the enhancement when entering the -Fe is in a large part intrinsic, i.e. only a small decrease is observed with improving sample quality. Also, the in-situ annealing of the sample seems impossible. Iron samples with a sufficiently low should exhibit bulk SC in the pressure domain GPa with a maximum value higher than K.
The power law has been reported for some weakly ferromagnetic metals including ZrZn2,Smith Ni3Al,Niklowitz and PdxNi1-x.Nicklas In the case of the alloy PdxNi1-x, a ferromagnetic quantum critical point clearly occurs for where is minimum while is maximum, culminating at a value a bit larger than that of Fe at GPa. For ZrZn2 the picture is less standard: surprisingly and are almost independent up to pressures close to GPa, where the ferromagnetism is suppressed completely and the exponent drops to . Moreover, there is a change of slope at the Curie temperature in the plot of the resistivity. These anomalies have been considered to be compatible with the marginal Fermi liquid state expected in weakly ferromagnetic metals. In the case of Fe the situation is still different as is fixed on a broad range outside the ferromagnetic phase while varies strongly.
The subtraction of a phonon term to the total resistivity (data from Ref. Pablo, ) suggests that the temperature dependence might hold up to K, i.e. a temperature much higher than as defined in Fig. 4. However, extension of such an analysis to pressures below the superconducting maximum leads to an unlikely pressure dependence of . Furthermore, the data treatment assumes a strict validity of Matthiessen’s rule considering that is only about 30 of and that the pressure in our cell is sufficiently temperature independent, which seems not to be the case. Indeed, the deviation from linearity of the resistivity of Pb points to a slight increase of pressure above 80 K (by about 5 up to 300 K) and can be considered as constant only below 50 K. Therefore the simple plot of Fig. 4 is the most reliable analysis, showing the occurrence of the maximum. Nevertheless, the resistivity term ascribed to spin fluctuations persists up to 300 K with an unknown dependence that is not far from . It is also noteworthy that we did not observe any anomaly which could mark a Curie temperature similar to ZrZn2. Accordingly, resistivity measurements above 300 K are desirable in order to evaluate the spin fluctuation temperature which sets the overall scale for spin mediated SC. For Fe a huge seems not to be excluded, explaining qualitatively the relatively high superconducting value.
V Conclusions
X-ray diffraction and electric transport measurements have been carried out under high pressure on high quality Fe single crystals. The x-ray data yield the first direct experimental evidence of the microscopic path of the martensitic transformation. Combining this study with previous ones, only a very weak dependence on the pressure conditions is revealed. As a main outcome, it is now evident that the superconducting pocket observed at the border of ferromagnetic bcc-Fe is intrinsic to the hcp-Fe phase. As to its origin, new insight comes from the unprecedented pressure cycling of electric transport, and its analysis in terms of . Indeed, maxima in and are observed (as well as ) slightly above the structural transformation (i.e. within the hcp phase), with a similar hysteresis in pressure. These features likely signal a region of strong ferromagnetic fluctuations, which may as well be responsible for superconductivity, since culminates in the same pressure range. As a synoptic scenario, we suggest that the magnetic transition has a tail (of a yet unknown nature) ending at a QCP or another type of electronic instability, precisely where the ferromagnetic spin fluctuations are maximum. Given the proximity to long-range ferromagnetic order, it may act as its precursor sign. The striking absence of hysteresis in may be explained by the high sensitivity of on and the electronic mean free path, which additionally points to an unconventional nature of the superconducting state. Further experimental and theoretical progress is still necessary to understand in detail the microscopic interplay between the structural and magnetic transitions in elementary Fe, in particular in order to unveil the nature of the electronic instability inside the hcp phase. Concerning superconductivity, experimental improvements (such as narrow resistive transitions) seem however compromised by the intrinsic rise of and still represent an enormous challenge.
Acknowledgements: We thank I. Ynada, H. Kohara and Y. Onuki for providing Fe whiskers, J. Flouquet for useful discussions, M. Lopes for technical assistance, and the Swiss National Science Foundation for financial support.
References
- (1) K. Shimizu, T. Kimura, S. Furomoto, K. Takeda, K. Kontani, Y. Onuki, and K. Amaya, Nature 412, 316 (2001).
- (2) D. Jaccard, A.T. Holmes, G. Behr, Y. Inada, and Y. Onuki, Phys. Lett. A 299, 282 (2002).
- (3) A.T. Holmes, D. Jaccard, G. Behr, Y. Inada, and Y. Onuki, J. Phys.: Condens. Matter 16, S1121 (2004).
- (4) P. Pedrazzini, D. Jaccard, G. Lapertot, J. Flouquet, Y. Inada, H. Kohara, and Y. Onuki, Physica B 378-380, 165 (2006).
- (5) K. Sengupta, P. Pedrazzini, and D. Jaccard, J. Phys: Conf. Series 200, 012180 (2010).
- (6) D. Bancroft, E.L. Peterson, and S. Minshall, J. Appl. Phys. 27, 291 (1956).
- (7) W.A. Bassett, and E. Huang, Science 238, 780 (1987).
- (8) F.M. Wang, and R. Ingalls, Phys. Rev. B 57, 5647 (1998).
- (9) R.D. Taylor, M.P. Pasternak, and R. Jeanloz, J. Appl. Phys. 69, 6126 (1991).
- (10) S. Nasu, T. Sasaki, T. Kawakami, T. Tsutsui, and S. Endo, J. Phys.: Condens. Matter 14, 11167 (2002).
- (11) M. Ekman, B. Sadigh, and K. Einarsdotter, P. Blaha, Phys. Rev. B 58, 5296 (1998).
- (12) O. Mathon, F. Baudelet, J.P. Itie, A. Polian, M. d’Astuto, J.C. Chervin, and S. Pascarelli, Phys. Rev. Lett. 93, 255503 (2004).
- (13) I.I. Mazin, D.A. Papaconstantopoulos, and M.J. Mehl, Phys. Rev. B (R) 65, 100511 (2002).
- (14) T. Jarlborg, Phys. Lett. A 300, 518 (2002).
- (15) V. Thakor, J.B. Staunton, J. Poulter, S. Ostanin, B. Ginatempo, and E. Bruno, Phys. Rev. B 67, 180405R (2003).
- (16) A. Monza, A. Meffre, F. Baudelet, J.P. Rueff, M. d’Astuto, P. Munsch, S. Huotari, S.Lachaize, B. Chaudret, and A. Shukla, Phys. Rev. Lett. 106, 247201 (2011).
- (17) R.P. Smith, M. Sutherland, G.G. Lonzarich, S.S. Saxena, N. Kimura, S. Takashima, M. Nohara, and H. Takagi, Nature 455, 1220 (2008).
- (18) A.P. Mackenzie, R.K.W. Haselwimmer, A.W. Tyler, G.G. Lonzarich, Y. Mori, S. Nishizaki, and Y. Maeno, Phys. Rev. Lett. 80, 161 (1998).
- (19) ATLAS CCD from Agilent Technologies.
- (20) A.T. Holmes, D. Jaccard, and K. Miyake, Phys. Rev. B 69, 024508 (2004).
- (21) A.T. Holmes, PhD Thesis, University of Geneva, Switzerland (2004). http://archive-ouverte.unige.ch/unige:284
- (22) D. Jaccard, E. Vargoz, K. Alamis-Yadri, and H. Wilhelm, Rev. High Pressure Sci. Technol. 7, 412 (1998).
- (23) R.A. Serway, in Principle of Physics, 2nd ed. (Saunders College Pub., p.602, 1998).
- (24) A.P. Jephcoat, H.K. Mao, and M. Bell, J. Geophys. Res.:Solid Earth 91, 4677 (1987).
- (25) G.G. Lonzarich in Electrons, edited by M. Springford (Cambridge University Press, Cambridge, England, 1997).
- (26) D. Jaccard, and A.T. Holmes, Physica B 359-361, 333 (2005).
- (27) A.-S. Rüetschi, and D. Jaccard, Euro Phys. J. B 67, 43 (2009).
- (28) B. Dupé, B. Amadon, Y-P. Pellegrini, and C. Denoual, Phys. Rev. B 87, 024103 (2013).
- (29) U. Bohnenkamp, R. Sandstrom, G. Grimvall, J. Appl. Phys. 92, 4402 (2002).
- (30) A. Kuznetsov, V. Dmitriev, L. Dubrovinsky, V. Prakapenka, and H.-P. Weber, Solid State Comm. 122, 125 (2002).
- (31) K. Glazyrin, L.V. Pourovskii, L. Dubrovinsky, O. Narygina, C. McCammon, B. Hewener, V. Schunemann, J. Wolny, K. Muffler, A.I. Chumakov, W. Crichton, M. Hanfland, V.B. Prakapenka, F. Tasnadi, M. Ekholm, M. Aichhorn, V. Vildosola, A.V. Ruban, M.I. Katsnelson, and I.A. Abrikosov, Phys. Rev. Lett. 110, 117206 (2013).
- (32) S. Raymond, D. Jaccard, H. Wilhelm, and R. Černý, Solid State Commun. 112, 617 (1999).
- (33) P.G. Niklowitz, F. Beckers, G.G. Lonzarich, G. Knebel, B. Salce, J. Thomasson, N. Bernhoeft, D. Braithwaite, and J. Flouquet, Phys. Rev. B 72, 024424 (2005).
- (34) M. Nicklas, M. Brando, G. Knebel, F. Mayr, W. Trinkl, and A. Loidl, Phys. Rev. Lett. 82, 4268 (1999).