Effects of Publications in Proceedings on the Measure of the Core Size of Coauthors
Abstract
Coauthors (CA) of a ”lead investigator” (LI) can receive a rank () according to their ”importance” in having published joint publications with the LI. It is commonly accepted, without any proof, that publications in peer review journals and e.g. conference proceedings do not have the same ”value” in a CV. Same for papers contributed to encyclopedia and book chapters. It is here examined whether the relationship between the number () of publications of some scientist with her/his coauthors, ranked according to their decreasing importance, i.e. , as found by Ausloos [1], still holds if the overall publication list is broken into such specific types of publications. Several authors, with different careers, but mainly having worked in the field of statistical mechanics, are studied here to sort out answers to the questions. The exponent turns out to be weakly scientist dependent, only if the maximum value of and is large and is then. The core value, i.e. the core number of CAs, for proceedings only is about half of the total one, i.e. when all publications are counted. Contributions to the numerical values from both encyclopedia and book chapters are marginal. The role of a time span on is also examined in two cases in relation to career activity considerations. It can considered that the findings serve as a contrasting point of view on how to quantify an individual (publication) career as recently done by Petersen et al. [2, 3, 4], here emphasizing the collaboration size and evolution, rather than a citation count, moreover specifying the type of publication. Through the various ’s one can distinguish different behavior patterns of a scientist publication with CAs.
keywords:
scientometrics , coauthorship1 Introduction
In order to justify and/or promote a young researcher work, he/she is often sent to present his/her research at scientific meetings, and publish the research results in proceedings. It is also somewhat commonly accepted, without any proof, that proceedings papers contain more coauthors than peer review journals. One does not question here whether one should be considering the publications in proceedings and those in peer review journals with an equal weight to measure the value of some scientific report. In favor of publishing contributions in proceedings, it seems to be one way to justify more quickly the time spent by a visitor in a team or in a laboratory, - because conference proceedings are thought to be less strict or take less time at the reviewer level than well established peer review journals. Necessarily, the team leader or laboratory coordinator is associated to such publications, justifying his/her principal investigator (PI) status. Of course, the PI number of publications is then increased much. One basic question which would seem to be raised on such aspects of scientific life concerns the number of relevant coauthors for the set of publications of a PI. One may wonder about their quantitative role for a PI or the team.
Ausloos ”coauthor core” definition and its subsequent measure [1] tackle such considerations in a constructive way, through the relationship between the number () of (joint) publications with coauthors ranked according to rank () importance. The approach presents great differences with respect to the recent Petersen et al. career life time, growth and/or decay considerations [2] later expanded in [3, 4]. These emphasize the citation count within some Hirsch index idea [5, 6], taking into account some normalization based on the group size and its time evolution, yet mainly testing the popularity of a . Ausloos’ approach emphasizes the role of in a team scientific production, in relation with a PI, rather than citations.
In fact, the PI behind and in a publication is sometimes hard to define. It is known that the notion of PI arises from administrative considerations. Sometimes a coauthor (CA), not necessarily receiving the first place in a coauthor list on a publication, has played an important role in the scientific investigations. However, without a criterion, one cannot write that such a CA has done ”more work” than a PI, - or conversely. That is one of the main reasons why the wording PI will be thereafter abandoned and replaced by LI standing for ”leading investigator”, e.g., as someone accepted by the community as a well known leader for some investigation.
Usually the position on a CA list in a publication hints toward some responsability, but not always. Expected emphasis on the position of a scientist on a publication list is a delicate matter when quantifying a contribution. The more so because it is thought that abusive coauthorship and publication parasitism exist, as emphasized by Kwok [7], i.e. the ”White Bull effect”. Sometimes indeed, a large quantity of so called proceedings papers or invited lectures have many coauthors, - usually in order to take into account various contributions on the reviewed subject and/or to promote team size visibility, among likely many other reasons.
On the other hand, recall that the -index [1] measures the core of coauthors in a research team, as if centered on a researcher, a LI, who can be anyone. The -index is deduced from a plot of the number () of joint publications of this LI with CAs ranked according to their rank () of importance; being the most prolific CA with the LI.
Ausloos [1] has found a simple power law relating and
| (1) |
The power law exponent is not exactly +1. It depends on the examined data range, – as usual; this is well known [8]. One may also conjecture that irregularities and deviations from such a simple analytic law, Eq. (1), maybe due to: publication inflation, proceedings counting, coauthorship inflation, for whatever reason [9], - even considering that all counts are made on a reliable data basis. Nevertheless, from this point of view, one can derive the -index, giving the core of coauthors range, through a condition similar to that defining the -index of a scientist [5, 6], i.e.
| (2) |
Most likely, Ausloos law, Eq. (1), seems to be best for large teams, and/or for authors having many publications and many coauthors. Indeed, as pointed out already in [1], when an author has not many publications, or has few coauthors, the law might be a statistically poor description of the (rare) empirical data. On the other hand, deviations in presence of a large set of publications and a large set of coauthors might be due to several causes.
So called ”intrinsic causes” might arise from a large productivity of the group based on a high turnover of young and junior researchers, with , but having few with the LI. On the other range, i.e., for small , many contributions may arise from stable partners who provide visibility of the team by going to conferences and summer schools. Among ”extrinsic causes”, one can simply also mention funding conditions or applications for funding constraints requesting to show the rather large size of the LI team. Indeed, public and private research funding agencies to search for and to promote such collaborations. Again, to estimate the quality of such CA is far from obvious, nor to measure their internal impact for the team and LI.
Therefore it is of interest to examine the generality of Eq. (1). This is made here by breaking the overall publication list into specific types of publications, like in peer reviewed journals, proceedings, invited chapters of books or encyclopedia, … . Several LI cases are studied here. As examples, two well known LI in statistical physics: (i) H.E. Stanley (HES), the most prolific of such authors (with the highest -index known for physicists, , though this is irrelevant for the present purpose); and (ii) D. Stauffer (DS), an accepted leader in theoretical and numerical statistical physics. Moreover, (iii) M. Ausloos (MA), who invented the -index [1] is included, due to his large publication list with CAs, in the same quantitative range as DS, but with papers much less quoted than those of HES or DS.
For comparison, the publication lists by 6 scientists having worked or still working in statistical mechanics, in Wroclaw, PL are included, though it is not claimed that any is a PI, - at the anglo-saxon or even USA status111The present author does not even claim to be called a LI. Since the publication list for several of them, being ”rather short” as compared to that of HES, DS and MA, it is emphasized that the data is mainly given for covering a large range of and . Yet, its analysis supports Ausloos’ claim that there is something else that the -index for measuring the quality or usefulness of a scientific author, i.e. his/her capacity in building a research team with relevant CAs.
The methodology, about separating and counting different types of publications, is briefly explained in Sect. 2. The data analysis of the coauthorship features is reported in Sect. 3, distinguishing between all publications, Sect. 3.1, and those in proceedings, Sect. 3.2. In Sect. 3.3, some discussion on the statistical (mechanics) aspects of these illustrative cases are presented in line with general considerations on ”subcores” of coauthors for a LI. Moreover, it is studied whether one should consider any time dependence of the present findings. Following the two time intervals considered by HES for his publication list, the same time intervals have been used for ”comparing” HES and DS CAs cores as a function of time interval in Sect. 4. Sect. 5 serves as a conclusion with suggestion for future work and applications.
2 Methodology
As mentioned in the introduction, in order to quantify Ausloos law and verify its validity limit, in the here above defined context, several publication lists have been selected. On one hand, the publication list, with mentioned coauthors of HES, DS, and MA are available through web sites and those of the Wroclaw scientists through personal contacts. On the other hand, the first three are large enough, to allow for expecting reasonable and meaningful statistical work. Since mine (JM) and those of the Wroclaw scientists are shorter, they can surely serve as a measure of variability of the findings.
In each list, many chapters in books and encyclopedia, or papers subsequent to scientific presentation at various scientific meetings can be ”easily” distinguished from papers in journals with peer review, searching when in doubt, e.g. for ”unusual journals”, whether a conference had ”motivated” the publication through some proceedings. In fact, several proceedings can appear even in (or as) scientific journal issues, - which are not necessarily indicated as ”special issues” by the publisher. Sometimes, some ambiguity occurs on whether a publication pertains to a scientific report presented at a conference or is a more elaborate paper. In doubt, the publication was considered to be in the ”proceedings” list. Note that books written, translated, or proceedings edited by the considered scientist are not counted here as relevant data.
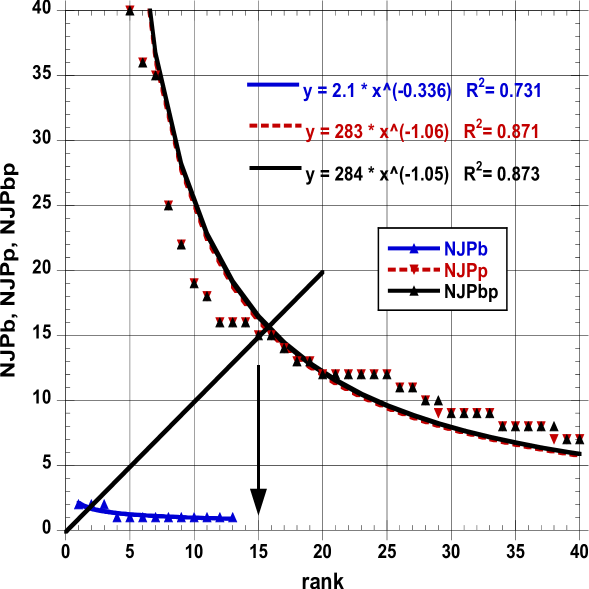
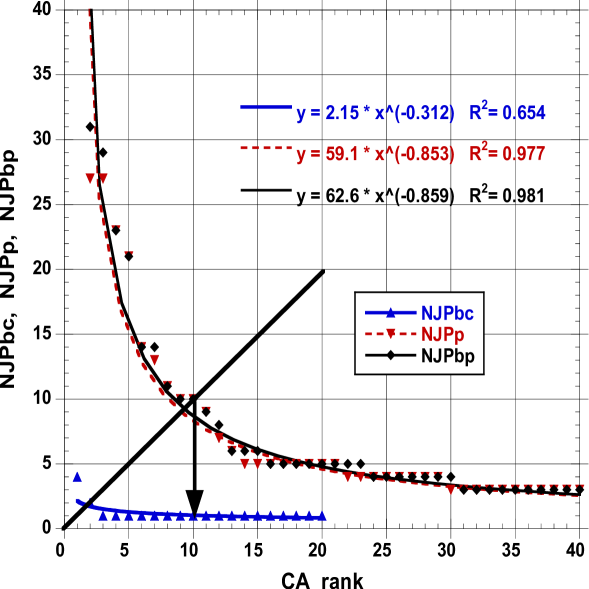
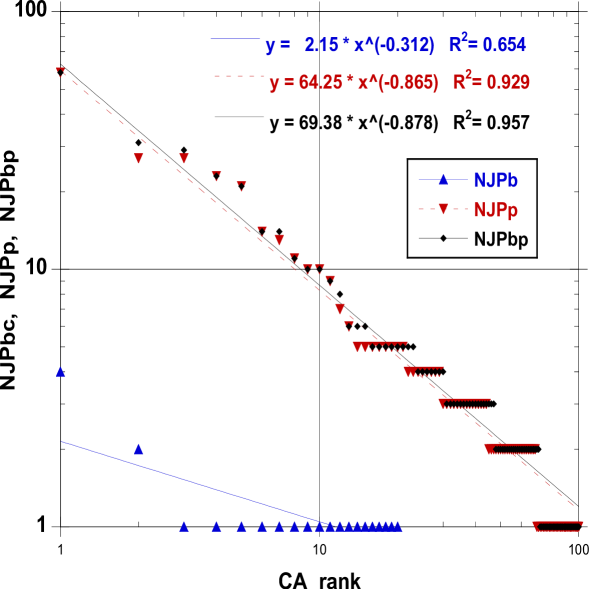
Thus, papers for encyclopedia and book chapters were first sorted out, see Table 1, as specific groups, (e) and (bc). It turns out that such contributions are not in great numbers. Moreover a test of Eq. (1) over such publications of e.g. HES, see Fig. 1 and MA, see Fig. 2, indicates that the numerical effect of NJPbc is a marginal contribution on NJPp, with respect to NJPbp, whether the whole range of or the central region of , near is used for a power law fit. Observe that the corresponding exponent is close to, but above, +1 in the HES case, and close to +0.86 in the MA case. Moreover the precision of the fit is rather acceptable in the case of the overall regime fits, i.e. and 0.981, for the HES and MA case respectively, interestingly indicating a slight departure from a perfect power law in the HES case. However the fit is much improved, i.e. for the HES case if the central region only ( 30) is used (figure not shown). This is shown for MA on Fig. 3: goes up to 0.88, with somewhat going down to . The variations can be considered to be weak, but in both cases +1. One might easily understand that a size effect, the number of data points, is implied in such variations. The case of the other authors is not shown for lack of space, but if shown would not bring any different qualitative information.
Therefore, it was decided to group all publications in two sets only, in fine merging the (bc) and (e) into a (generalized) ”proceedings” (p) list, i.e. NJPbp NJPp to be contrasted to NJPj for the peer review journal (j) list. However, it was made sure that they are all sound scientific papers, sometimes quoted in works which are admitted to be regularly accepted as ”papers”. Nevertheless, e.g., it was found after completion of the analysis in Sect. 3.2 that [10] which appears at first to be a regular article in a well known journal, but (after reading it) turns out to be a conference paper, was misplaced. Note that when attempting to remove ambiguities, it was considered that one could distinguish between papers published in either hard or soft cover books. But journals are also soft cover222For example, in the case of MA, a JP, i.e., [12], has been considered as a book chapter.. Maybe other similar cases could be found. One must admit that one cannot read all papers to find out whether such a misplacement exists. However, most of the analyzed data originates from deeply checked data bases. Note that care was made to count twice identical scientific publications. For example, HES has many papers reproduced, e.g. in a compendium or in another journal. Moreover, an has not been counted as a paper, but a ”Reply to …” or a ”Comment on …” has been considered a bona fide paper. Overall, the error in each counting has been estimated to be at most 2.5%.
Great care has been taken with the misprints of CA names: e.g., Buldryev and Giovanbattista, are surely Buldyrev and Giovambattista, respectively. Great care has also been taken concerning polish, spanish, german, chinese and korean names. First (given) names and middle names, the latter sometimes missing, have been checked: e..g., F.W. Starr and F. Starr are the same person; so is A. Petersen and A.M. Petersen. Such a (tedious) manual check has also allowed me to distinguish name homonyms, like Ch. Laurent and Ph. Laurent. HES also mentions that one of his most often quoted paper is attributed to some HFS! All such ”defects” and misprints have been a posteriori corrected before manually counting the authors. Though the paper grouping might be debatable, as well as the author selection, the lists can be considered as safely reliable for further analysis within the present framework.
The statistical characteristics (mean, median, standard deviation, skewness, kurtosis, …) of the various distributions are not given, but they are available upon request.
Notations for the following text and Tables are as follows :
- NJPmfCA :
-
number of joint publications with the most frequent (mf) coauthor;
- NJP1CA :
-
number of coauthors having written only 1 publication with the LI (whatever the number of coauthors on this publication);
- TNCA :
-
total number of coauthorships, whatever the CA frequency and number of publications; i.e., it is the integral of the histogram . ;
- NDCA :
-
number of different coauthors.
3 Analysis and Discussion of the data set
HES publication list amounts to more than 1100 ”papers”, broken into subgroups, as in Table 1. Its Curriculum Vitae & Selected Publications, taken on , lists, among other things, 15 book chapters333 HES mentions only 14 book chapters, but I have considered that [11], listed by HES as a journal publication, belongs to the book chapter category. As mentioned in the text, the sets (bc) and (e) are merged with the true proceedings one, but the category choice in this case has not much impact, as seen in Fig. 1. and 5 encyclopedia articles, 619 articles, in the period 1966-1999 plus more than 490 journal articles in the period 2000-up to 2012. [Listed in rank order by citation count]. Note that his curriculum vitae (CV) mentions 136 Research Associates and Visiting Scholars , at the end of 2012. DS has more than 600 publications, several of them in German, sometimes like comments. Several of his papers appear in society journals or pedagogical ones and in not so usual peer review journals. In so doing, he has a larger (than many other scientists in the field) number of single author (sA) papers; see Table 1. For HES and DS, in several cases, sA or JP contributions stem from invited lectures published for anniversaries. Such papers are counted in (p). MA has about 600 publications, mixing papers in peer review journals, proceedings (p), contribution to encyclopedia (e), and book chapters (bc). In the DS and MA cases, some ambiguity occurs because several contributions pertain to papers derived from summer school lectures. They were included in (p). Two polish workers (JMK and AP) have a similar career age as HES, DS and MA. One (JMK) has a career partially in the USA. The 4 others are younger, and essentially have a Poland based career. Yet, DG started his career in high energy physics; he has a paper in proceedings with 93 CA. From a gender point of view, all except KSW are male. With such a choice of authors, the career data indicates different orders of magnitudes for the size of the publication list, see Table 1. Such a choice allows to cover a large range of coauthorship ”types”.
For comparison, the characteristics of single author and joint publications of the 10 scientists so considered are given in Table 1. Note that in Table 1, the single author (sA) papers are distinguished from the joint publications (JP), either in peer review journals (j) or in other categories (p, bc, e). It is remarkable that the number of joint publications is much larger than the number of single author publications; the latter amounts to 5 to 10 % only. The same order of magnitude, i.e. about 40%, holds for the ratio NJPp/NJPj for HES and MA. However, this ratio is near 15% for DS, AP, KSW, and JM. In contrast DG, RW and JMK have a much higher ratio () than all others. Note, although this is a point outside the present discussion, that most of the NJPj or NsAPp are often quoted, - as exemplified in any study based on the -index!. Since it takes some time before a publication is quoted in some other work, one should consider that some non negligible error bar exists on such a measurement of citations, thus on the -index, - in contrast to the present considerations on coauthors, who are ”stacked to” the publication for ever.
A rough estimate indicates that about 20% of the JPp are quoted. An interesting Pareto number order of magnitude!
The data emphasizing CAs is summarized in Tables 2-4, grouping the papers into ”proceedings” (p) and journal (j) types and some is displayed through a few figures. In order to test Eq. (1), the overall range, i.e. , has been used for each fit. However the value was not always found to be 0.9 (as already demonstrated in Fig. 1). Therefore a fit to a power law like Eq. (1) was often attempted in a restricted range, near the region of interest, i.e. near , such that and , with , see each figure caption for more information on the specific value which is used. This emphasizes the most frequent CAs, i.e. the low regimes, but puts some limit on NJPmfCA, i.e. the very high cases. Two types of axis scales, i.e. lin-lin or log-log, are used, – but the fits are not always shown twice. The fit range is also indicated in each figure caption. For better vizualisation, only the low range (), and by symmetry, the range data is shown. Examined authors have been grouped on illustrating plots such that the data can be read as easily as possible, even though it it unavoidable that they do often overlap.
3.1 NJP Numerical Analysis
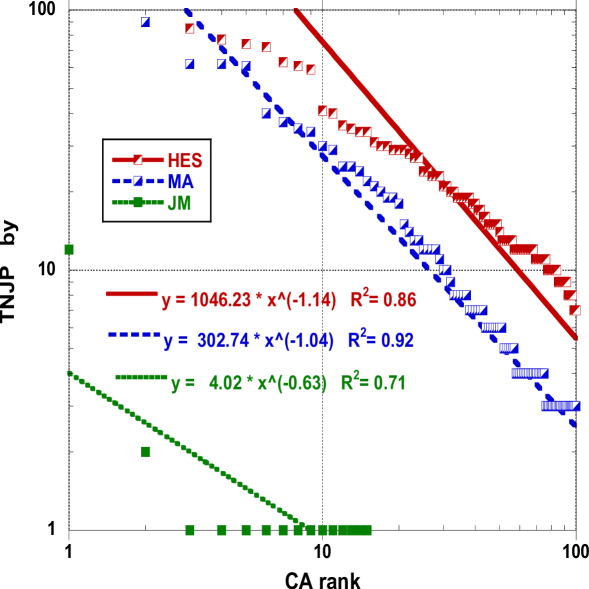
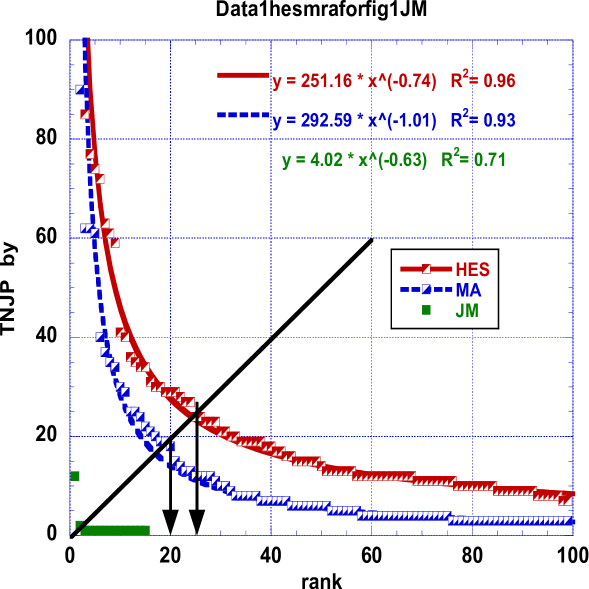
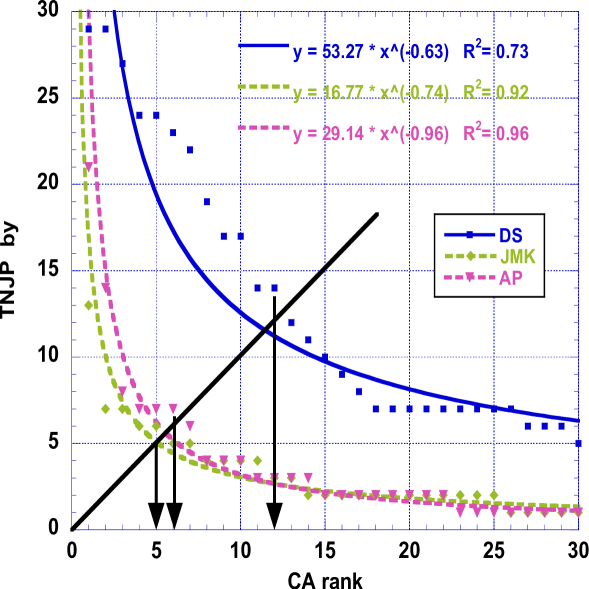
Not all data and fits can be displayed, but the relevant results are summarized in Tables, 2-4. A few (3) cases of the Total Number of Joint Publications (TNJP) data ranked according to the CA importance are displayed and numerically fitted on Figs. 4 - 5. Observe that (TNJP) is close to +1 for HES and MA (Fig. 4). The and values are thus reliable whatever the range fit, i.e. on the whole range or near , surely for MA, but note that for HES falls from 1.14 down to 0.74 if the range is reduced. Observe also that the overall (TNJP) falls below 0.8 for DS and JMK, and near 0.7 for KSW and RW.
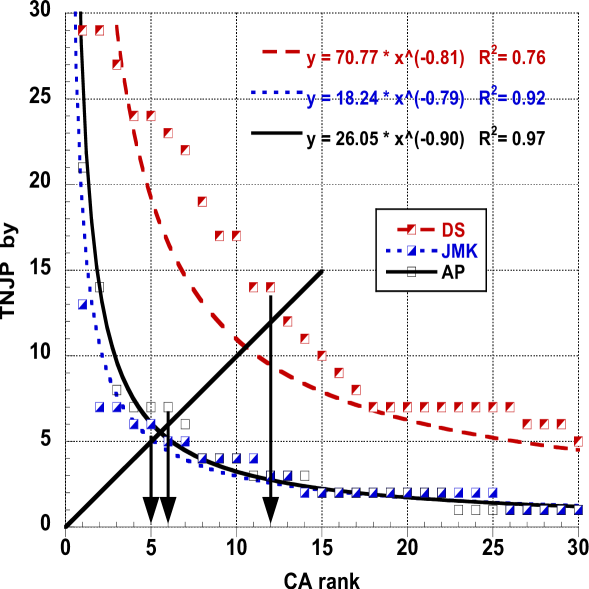
The core value is found, - e.g. as indicated for HES and MA by an arrow in Fig. 5 and for DS, JMK and AP in Figs. 7, 8, 9. The TNJP for all authors are also given in Table 2-4. The values range from 2 to 26.
Observe at one extreme, i.e. JM, who has a small number of frequent CAs, together with a small number of data points, the CAs with , - all of the 1CA type, much constraint the ”fit”, - factually decreasing to a lower value, i.e. 0.63 than the NJPj . This is somewhat similar to the case of DS for which the value does NOT increase from its NJPj to its TNJP value. Finally the case of DG is also of interest from the TNJP point of view, since it has the lowest , dragged down by the NJPp behavior, as hinted here above.
Such an observation further indicates the interest of investigating the effect of the number of CAs on specific types of publications, like the ”proceedings”, as done in the next section.
3.2 NJPp Numerical Analysis
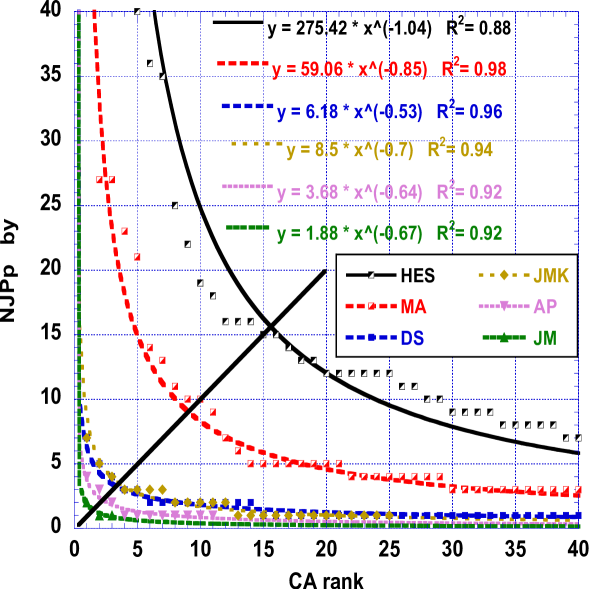
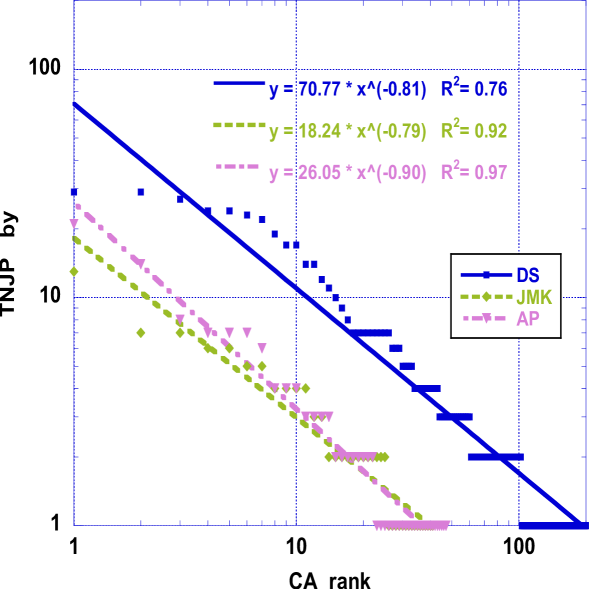
Several plots of the NJPp behavior have already been on Figs. 1 - 3. Others are presented in Figs. 6 - 9. In Tables 2-4 one can find the set of relevant numerical results. Interestingly, the NJPp power law fits are much better ( ) for almost all authors (except HES and DG!) than for the TNJP; see Figs. 6 - 9.
Let it be observed whether the hyperbolic law, Eq. (1), is obeyed or not, first, in the HES case, Fig. 1, for NJPp. The fits for NJPp are quite fine (), with , whatever the range considered. The value is well defined: 15 for NJPp. Moreover, the value can be large, as for KSW, i.e. , and be low, as for DG, i.e. .
A test has been made on several cases concerning the fit range. An example of the central range fit is shown in Fig. 3, for MA, Fig. 5, for HES and MA, and Fig. 9 for DS, JMK and AP. The numerical difference on , between fits with different ranges, is not large The NJPp MA value of is found to be equal to 10.
However some deviation from a nice hyperbolic fit is apparent in the vicinity of , - indicated by an arrow. Nevertheless the values are always well defined.
In all cases, it can be observed that the values are rather small : = 15 and 10 for HES and MA respectively, but fall below 4 for all others. In contrast DS, has a very low NJPp value (= 3), and a remarkably low value (). In fact, similarly low and values are also found for the polish workers. All NJPp values fall much below the NJP coauthor core value, i.e. = 25 and 20 for HES and MA respectively, as recalled in Table 2.
3.3 Discussion
The anomalous behaviors, i.e. large deviations from the expected Eq. (1) law, maybe on one hand attributed to the data itself and to the approximation of a simple scaling law. On the other hand, it might reflect some deeper information on the LI role, leadership, management, funding, research topics, …, and team organization, history, constraints [2, 3, 4].
First, indeed, one can expect to observe, as in many Zipf plots, some irregularity at low and at large . A so called ”queen effect” [1] indicated by a sort of horizontal curbing in the data, see Fig. 4 or Fig. 7, could be represented by a hyperbolic Bradford-Zipf-Mandelbrot-like law,
| (3) |
expectedly with [13]. In this low range, it is known that a so called ”king effect” [14], i.e. a sharp upturn at low values exists, if such a low ranked element has much preponderance. In the case of HES, one also encounters a king and a queen effect, in several cases. The king effect is due to Havlin, Buldyrev, Amaral, Gopikrishnan, and Plerou, for 1 to 5, those CA with NJPbp . The CA order differs from that in NJPj and TNJP (not shown). Similarly for MA, the king effect is Cloots who has markedly a NJPbp , see Table 2. For MA, the CA rank order also differs from that in NJPj and TNJP (not shown).
Some upturn seen in the case of HES, near 10 can be attributed to the fact that HES has been very active in many different fields for which the CAs are somewhat similar but with different emphasis, the more so due to the timing of his research. Such cases are much concerned with medical topics. It is understandable that a team effect, with kings and queens , are to be expected in such domains. Such domain effects are necessarily masked into the overall plot, but allow some distinction between papers in ”proceedings” and those in peer review journals.
Finally, the fact that the ”proceedings” (and also the journal) values fall much below the overall coauthor core value could be interpreted as only being due to the size of the number of CAs. However, very similar kings and queens occur in different publication types. The above finding may suggest that is topics dependent. A normalization, leading to a frequency plot, might be useful work in order to improve as a standard measure. However another interpretation might also pertain to the type of publication itself. In fact, it can be observed that the approximatively same value is found for the ratio NJPp/NJPj , for the TNCA for both HES and MA, i.e. . However this ratio, either for the NJP1CA or the NDCA, are very different for HES and MA. The values for the HES case are about half those for the MA case. Since NJPp is (very) roughly the same for HES and MA, see Table 2, this necessarily indicates a quite different emphasis and success in the publication of scientific papers with CAs, in peer review journals by HES and MA.
From its NJPp value, as well as its low value, one may conclude that DS is surely a special (top) scientist, in this respect.
4 Time regimes
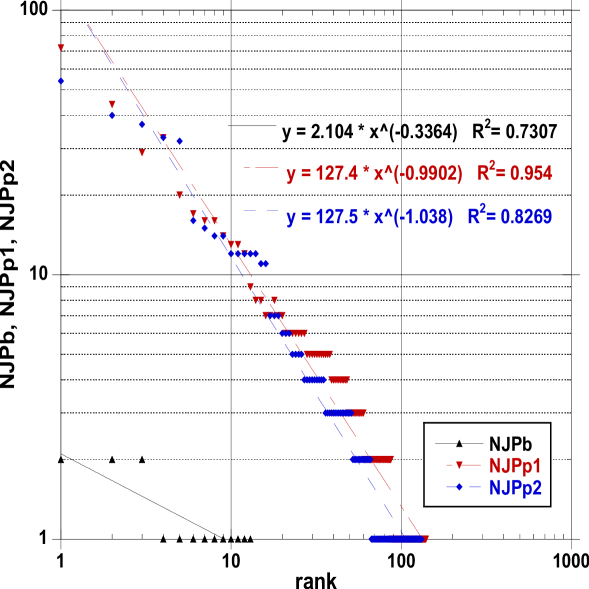
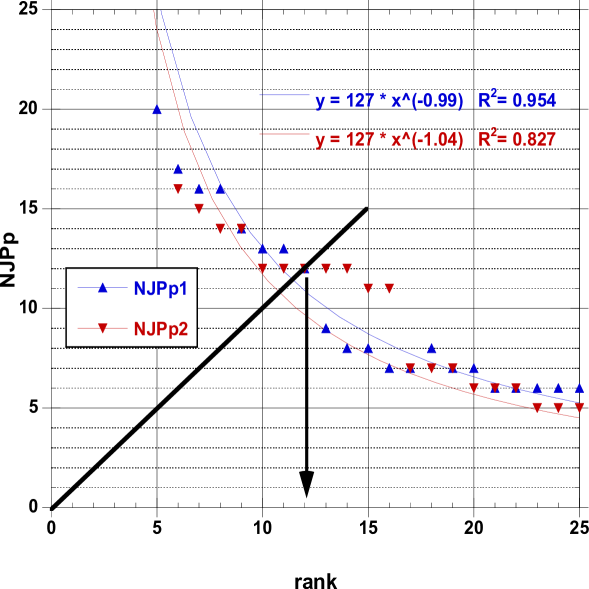
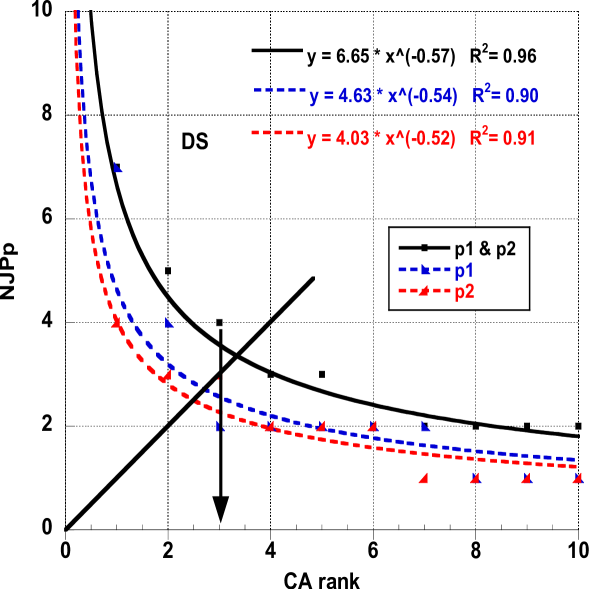
Since HES decomposes his publication list in his CV into two regimes [1966-1999] and [2000- …], it is interesting to find out whether there is some sort of time dependence of the above findings. On one hand, the scientific subjects have shifted; on the other hand, the coauthors might have also changed. Moreover the scientific output of research teams might have changed due to the use of many electronic means and other funding constraints. Thus, in Table 3, the HES and DS JP characteristics are reported for both ”time regimes”, while Fig. 10 and Fig. 11 illustrate the data in the case of HES and Fig. 12 in the case of DS. Interestingly, the NJP, NPmfCA, NDCA, NCA, , , and values do not seem to depend on the time regime, thus on the emphasis on one or another topics, nor on the CA. Surprise, surprise.
It is seen that NsA is different in the different regimes: this can be understood as follows: at the beginning of a career, it is more probable that either a (young) scientist belongs to a big group and thus at once gets many coauthors, or he/she searches for recognition, thus in publishing sA papers, - when or if allowed to do so.
5 Conclusions
Scientific production and other facts, like citations and (joint) publications, are used nowadays for quantifying scientific achievements [2, 3, 4, 5, 6, 15] of a scientist or a team. Yet everyone admits that statistical methods based on mere arithmetic counts are only partially adequate because any quantitative bias omits relevant qualitative features [17] and the counting is sensitive to data size, while interactions and contextual variations are somewhat hidden444 Let the work on the critical mass and the dependency of research quality on group size by Kenna and Berche [18] be mentioned.. A flurry of papers have been produced ”to improve” these ”measures”, like (not an exhaustive list!) [19, 20, 21, 22, 23].
It is somewhat of common knowledge that proceedings papers contain more coauthors than peer review journals. This is exemplified here in the ratio NDCA/TNCA, either for NJPj or NJPp; see Tables 2-4. Officially coauthorship should imply personal responsibility for the content of a paper. Yet, undeserved authorship, assigning authorship to persons because of their authority or prestige, or as courtesy, seems much allowed in proceedings papers, resulting from conference presentations. Along with increasing number of coauthors, the percentage of undeserved (false) authorship has been shown to increase [25, 26]. Conversely, some sense of ”obligation”, fear of offending someone, need for justifying some collaboration, pressure from another coauthor, or explicit demand, gaining favor or reciprocity [24], are common facts.
Ausloos coauthor core definition and subsequent measure [1] tackle such considerations in a constructive way, through the relationship between the number () of (joint) publications with coauthors ranked according to rank () importance. The approach presents a great difference with respect to the Hirsch index. The former emphasizes the role of persons. The latter test the popularity of a paper.
A test of the findings in [1], i.e., , with , has been made here above and discussed considering two prolific highly respected authors, often quoted, and several others working in the field of statistical physics. The role of coworkers, in fact coauthors, has been examined supposing that publications in peer review journals and in so called proceedings might have some different influence on the core of coauthors of a LI. This is proved to be so for the here above examined cases. It is observed that the fit values are usually quite good, in particular considering that a mere power law fit is attempted. The values of the so called coauthor subcores fall below the overall coauthor core value, and differ whether publications are in peer review journals or in so called proceedings. Practically, the values seem to be size and publication type dependent as well. Inn conclusion, contrary to the universal value somewhat thought of in [1], it seems that and are scientist dependent. Thus practical considerations on a LI and research team behavior can be observed through the TNJP exponent and the coauthor core value .
Whence, much can still be done after the above, in particular, checking (i) the deviations from a regular hyperbolic law; (ii) the the king and queen effects; (iii) the effect of NDCA long tail; (iv) the influence of NJP1CA; (v) the effect of the number of CAs per paper[27, 28]; (vi) globalization of measures in considering the role of the main author, and in the ranking of his team mates. Some modelization is left for further work. One could imagine extensions of Egghes success-breeds-success model [29], leading to not necessarily decreasing distributions.
Technically, one could thus measure the relevant strength of a research group centered on some leader, e.g. through the various ratios discussed in the main text. Nevertheless, the invisible college [30, 31] becomes visible and easily quantified, including hubs in so doing. One may conjecture that one can introduce selection and rewarding policies in the funding of a team (or LI) through Ausloos coauthor core measure [1]. To indicate applications toward practical consequences, e.g. on team (or LI) funding or criteria for career evolution, are outside the scope of this paper.
Acknowledgements Thanks to M. Ausloos for private communications on [1], comments prior to manuscript submission and making available his publication list broken according to the present investigation.
References
- [1] M. Ausloos. A scientometrics law about co-authors and their ranking. The co-author core. Scientometrics (in press);
- [2] A.M. Petersen, F. Wang, and H.E. Stanley, Methods for measuring the citations and productivity of scientists across time and discipline, Phys. Rev. E 81 (2010) 036114 [9 pages]
- [3] A.M. Petersen, M. Riccaboni, H.E. Stanley, and F. Pammolli, Persistence and uncertainty in the academic career, Proc Natl Acad Sci USA 109 (2012) 5213-5218
- [4] A. M. Petersen, W.-S. Jung, J.-S. Yang, and H.E. Stanley, Quantitative and empirical demonstration of the Matthew effect in a study of career longevity. Proc Natl Acad Sci USA 108 (2011) 18-23.
- [5] J.E. Hirsch, An index to quantify an individual’s scientific research output. Proc Natl Acad Sci USA 102 (2005)16569-16572.
- [6] J.E. Hirsch, An index to quantify an individual’s scientific research output that takes into account the effect of multiple coauthorship. Scientometrics 85 (2010) 741-754.
- [7] L.S. Kwok, The White Bull effect: abusive coauthorship and publication parasitism. Journal of Medical Ethics 31 (2005) 554-556.
- [8] A. Clauzet, A.C.C. Shalizi, M.E.J. Newman, Power-law distributions in empirical data, SIAM Rev. 51 (2009) 661-703.
- [9] H. Kretschmer, R. Rousseau, Author Inflation Leads to a Breakdown of Lotka s Law, Journal of the American Society for Information Science and Technology 52 (2001) 610-614.
- [10] H.E. Stanley, S.V. Buldyrev, A.L. Goldberger, S. Havlin, C.-K. Peng, M. Simons, Scaling features of noncoding DNA, Physica A 273 (1999) 1-18.
- [11] B. Urbanc, J.M. Borreguero, L. Cruz, and H.E. Stanley, Amyloid -Protein Aggregation: Ab initio discrete molecular dynamics approach to protein folding and aggregation, invited review, Methods in Enzymology [Amyloid, Prions, and other Protein Aggregates, Pt. B] 412, Chapter 19 (2006) pp. 314-338.
- [12] M. Ausloos, G.V. Lecomte, J. Harrison, and M. Krusius, Low Temperature Physics at the Millenium , in Physics 2000 as it Enters a Millenium, P. Black, G. Drake and L. Jossem, Eds. (IUPAP-36, 1999) pp. 27-33.
- [13] R.A. Fairthorne. Empirical hyperbolic distributions (Bradford-Zipf-Mandelbrot) for bibliometric description and prediction, Journal of Documentation 25 (1969) 319-343.
- [14] J. Laherrère, D. Sornette, Stretched exponential distributions in nature and economy: fat tails with characteristic scales, Eur. Phys. J. B 2 (1998) 525-539.
- [15] A. Fernández-Cano, M. Torralbo, M. Vallejo, Reconsidering Price’s model of scientific growth: An overview. Scientometrics 61 (2004) 301-321.
- [16] C.D. Kelly, M.D. Jennions, The h index and career assessment by numbers. Trends in Ecology and Evolution, 21 (2006) 167-170.
- [17] R.J. Ormerod, Is content analysis either practical or desirable for research evaluation?, Omega 28 (2000) 241-245.
- [18] R. Kenna, B. Berche. Critical mass and the dependency of research quality on group size, Scientometrics 86 (2011) 527-540.
- [19] V. Durieux, P.A. Gevenois, Bibliometric Indicators: Quality Measurements of Scientific Publication, Radiology 255 (2010) 342-351
- [20] M. Schreiber, Twenty Hirsch index variants and other indicators giving more or less preference to highly cited papers, Annalen der Physik (Berlin) 522 (2010) 536 554.
- [21] M. Schreiber, C.C. Malesios, S. Psarakis, Exploratory factor analysis for the Hirsch index, 17 h-type variants, and some traditional bibliometric indicators, Journal of Informetrics 6 (2012) 347-358.
- [22] R. Zhang, An index to link scientific productivity with visibility, (2009) .
- [23] L. Bornmann, R. Mutz, H. Daniel, Are there better indices for evaluation purposes than the h-index? A comparison of nine different variants of the h-index using data from biomedicine. Journal of the American Society for Information Science and Technology, (2008) 830 837.
- [24] T. Martin, B. Ball, B. Karrer and M. E. J. Newman, Coauthorship and citation in scientific publishing,
- [25] R.M. Slone. Coauthors contributions to major papers published in the AJR: Frequency of undeserved coauthorship. American Journal of Radiology 167 (1996) 571-579.
- [26] Lj. Vuckovic-Dekic, Multiauthorship - what is it, and does it matter?, Archive of Oncology 8 (2000) 139.
- [27] M. E. J. Newman, Scientific collaboration networks: I. Network construction and fundamental results. Physical Review E 64, 016131 (2001).
- [28] J. W. Hsu and D. W. Huang, Distribution for the number of coauthors. Physical Review E 80, 057101 (2009).
- [29] L. Egghe, R. Rousseau, Introduction to Informetrics. Quantitative Methods in Library, Documentation and Information Science, Elsevier, Amsterdam (1990).
- [30] H. Kretschmer, Coauthorship networks of invisible colleges and institutional communities, Scientometrics 30 (1994) 363-369.
- [31] A. Zuccala, Modeling the invisible college, Journal of the American Society for Information Science and Technology 57 (2006) 152-168.
| data summary | |||||||||
| NP | NJPj | NsAPj | NJPp | NsAPp | NJPbc | NsAPbc | NJPe | NsAPe | |
| HES | 1148 | 791 | 15 | 288 | 34 | 9 | 6 | 2 | 3 |
| DS | 612 | 374 | 115 | 46 | 77 | - | 13 | - | 4 |
| MA | 599 | 359 | 29 | 148 | 31 | 15 | 5 | 1 | 1 |
| RW | 98 | 32 | 7 | 21 | 5 | 11 | 1 | 0 | 0 |
| JMK | 60 | 28 | 8 | 19 | 5 | - | - | - | - |
| AP | 111 | 79 | 22 | 9 | 1 | - | - | - | - |
| DG | 45 | 12 | 14 | 9 | 10 | 0 | 0 | 0 | 0 |
| KSW | 43 | 27 | 7 | 4 | 5 | 0 | 0 | 0 | 0 |
| JM | 27 | 15 | 8 | 2 | 1 | 1 | 1 | 0 | 0 |
| HES | DS | MA | |||||||
| NJPj | NJPp | TNJP | NJPj | NJPp | TNJP | NJPj | NJPp | TNJP | |
| oldest P | 1965 | 1969 | 1965 | 1968 | 1973 | 1968 | 1971 | 1971 | 1971 |
| latest P | 2012 | 2012 | 2012 | 2012 | 2011 | 2012 | 2012 | 2011 | 2012 |
| NJPmfCA | 195 | 104 | 299 | 27 | 7 | 29 | 97 | 58 | 155 |
| NJP1CA | 275 | 102 | 269 | 172 | 32 | 178 | 152 | 103 | 172 |
| TNCA | 2639 | 1250 | 3889 | 691 | 72 | 763 | 1055 | 502 | 1557 |
| NDCA | 568 | 242 | 592 | 268 | 46 | 280 | 273 | 168 | 319 |
| 0.999 | 1.045 | 1.135 | 0.688 | 0.535 | 0.796 | 1.03 | 0.860 | 1.04 | |
| 0.914 | 0.873 | 0.86 | 0.752 | 0.965 | 0.722 | 0.91 | 0.981 | 0.92 | |
| 20 | 15 | 26 | 12 | 3 | 12 | 15 | 10 | 20 | |
| RW | JMK | AP | |||||||
| NJPj | NJPp | TNJP | NJPj | NJPp | TNJP | NJPj | NJPp | TNJP | |
| oldest P | 1997 | 1995 | 1995 | 1969 | 1971 | 1969 | 1969 | 1980 | 1969 |
| latest P | 2012 | 2010 | 2012 | 1999 | 1999 | 1999 | 2012 | 2010 | 2012 |
| NJPmfCA | 5 | 10 | 15 | 6 | 7 | 13 | 17 | 4 | 21 |
| NJP1CA | 13 | 11 | 24 | 24 | 13 | 16 | 25 | 8 | 25 |
| TNCA | 62 | 62 | 124 | 60 | 51 | 111 | 118 | 17 | 135 |
| NDCA | 34 | 23 | 46 | 35 | 25 | 41 | 45 | 11 | 47 |
| 0.561 | 0.767 | 0.743 | 0.618 | 0.702 | 0.787 | 0.89 | 0.64 | 0.94 | |
| 0.867 | 0.901 | 0.918 | 0.887 | 0.943 | 0.915 | 0.945 | 0.92 | 0.96 | |
| 4 | 4 | 6 | 4 | 3 | 5 | 5 | 2 | 6 | |
| DG | KSW | JM | |||||||
| NJPj | NJPp | TNJP | NJPj | NJPp | TNJP | NJPj | NJPp | TNJP | |
| oldest P | 2000 | 2000 | 2000 | 1996 | 1999 | 1999 | 2001 | 2006 | 2001 |
| latest P | 2012 | 2000 | 2012 | 2012 | 2006 | 2012 | 2012 | 2006 | 2012 |
| NJPmfCA | 5 | 5 | 10 | 6 | 3 | 9 | 10 | 2 | 12 |
| NJP1CA | 4 | 3 | 7 | 10 | 0 | 10 | 10 | 0 | 10 |
| TNCA | 14 | 104 | 118 | 44 | 5 | 49 | 23 | 2 | 27 |
| NDCA | 7 | 99 | 104 | 21 | 3 | 21 | 12 | 1 | 14 |
| 0.755 | 0.239 | 0.547 | 0.594 | 1.255 | 0.715 | 0.67 | 0.67 | 0.63 | |
| 0.933 | 0.321 | 0.615 | 0.865 | 0.954 | 0.961 | 0.76 | 0.92 | 0.71 | |
| 2 | 2 | 2 | 3 | 1 | 3 | 2 | 1 | 2 | |
| HES | DS | |||||
| time span regimes | time span regimes | |||||
| [1966-1999] | [2000-2012] | [1966-2012] | [1966-1999] | [2000-2012] | [1966-2012] | |
| NJPp1 | NJPp2 | NJPp | NJPp1 | NJPp2 | NJPp | |
| NJP | 150 | 138 | 288 | 41 | 31 | 72 |
| NJPmfCA | 72 | 54 | 104 | 7 | 4 | 7 |
| NJP1CA | 53 | 66 | 102 | 20 | 15 | 32 |
| NDCA | 140 | 132 | 242 | 27 | 21 | 46 |
| NsA | 28 | 8 | 36 | 46 | 32 | 78 |
| 0.99 | 1.04 | 1.045 | 0.54 | 0.52 | 0.565 | |
| 0.954 | 0.827 | 0.875 | 0.896 | 0.912 | 0.965 | |
| 12 | 12 | 15 | 2 | 2 | 3 | |