Mapping the File Systems Genome: rationales, technique, results and applications
Abstract
This paper provides evidence of a feature of Hard-Disk Drives (HDDs), that we call File System Genome. Such a feature is originated by the areas where (on the HDD) the file blocks are placed by the operating system during the installation procedure. It appears from our study that the File System Genome is a distinctive and unique feature of each individual HDD. In particular, our extensive set of experiments shows that the installation of the same operating system on two identical hardware configurations generates two different File System Genomes. Further, the application of sound information theory tools, such as min entropy, show that the differences between two File System Genome are considerably relevant. The results provided in this paper constitute the scientific basis for a number of applications in various fields of information technology, such as forensic identification and security. Finally, this work also paves the way for the application of the highlighted technique to other classes of mass-storage devices (e.g. SSDs, Flash memories).
1 Introduction
This paper reports evidence of an apparently surprising phenomenon that occurs in storage devices. In particular, this paper takes into consideration computer systems that are perfectly identical both from the hardware point of view (storage devices, motherboard, CPU, RAM, etc..) and software point of view (operating system and applications), and shows that the locations occupied by the file’s blocks differ greatly between any two storage devices of such identical computer systems. Such a distribution of file blocks has an entropy even greater if one analyses different computer system in terms of hardware and software. In other words, let us assume that we install on a computer C a given operating system, and let be the set of locations occupied by the file blocks at the end of this operating system installation. After formatting the storage device and having installed the same operating system on the same computer C, we observed that the new set of locations occupied by the file blocks at the end of the installation process significantly differs from . The complete set of the locations of the file blocks on a given storage device are called in this paper File System Genome (FSG). It appears from our study that the File System Genome is a distinctive and unique feature of each individual storage device.
The following sections discuss the underlying physical and logical phenomenons
originating
this feature, and present an extensive experimental campaign to support our
observations. In particular, these first time measured pieces of evidence have
been analyzed in a rigorous way by using information theory techniques.
In particular, our results demonstrate that the installation of the same
operating system software on two identical hardware configurations generate two
significantly different FSG.
The concept of FSG seems to
be applicable to many fields of computer science,which include for example
Forensic Identification. The Forensic Identification of electronic devices is
the ability to identify model, configuration, and other characteristics of an
electronic device in a court case. The characteristics that allow the unique
identification of a device are called device signatures. Such an ability provides a
valuable aid for law enforcement and intelligence agencies, especially in the
presence of illicit activities. In general, there are many scenarios in which
the Forensic Identification can be decisive. For example, it may be used to
confirm whether digital photographs have been acquired using a specific
camera [3], where the noise characteristics in a digital
image is used as camera’s signature; or it may be useful to confirm that a
document has been printed out using a specific printer [8].
Similarly, the concept of FSG can be used to develop a scheme to verify the
ownership of a particular storage device.
For example, consider the following scenario: suppose that the IT security
officer of an organization has to verify that a lost storage device, just found
again, belongs to the organization. The aim of the adversary is to forge the
content of a storage device in such a way that it is considered as belonging to
the organization, so as to have it introduced in the IT infrastructure of the
opponent—for instance, this device carrying a stuxnet-like worm. Assume that
the security officer has computed previously the
FSG on the read-only files of his storage device, keeping it in a safe place. If
the FSG of the found storage device corresponds with the one the IT security
officer had guarded, then he can demonstrate the property of the item. Note
that since the IT security officer computes the FSG only on read-only files, the
FSG remains valid and unchanged, even if the IT security officer modifies the
storage device after calculating the FSG. A simple solution based on computing
the hash of the entire storage device is unsatisfactory because two storage devices
with the same data have the same hash,
while they have different FSG, as it will be shown in the following.
In addition, FSG can be a useful building block for
authentication protocols as well. Consider for instance the following scenario:
the security policies of a Government Organization prevents the employees from bringing electronic devices belonging to the organization (namely internal
devices) outside the organization building. At the same time, such security
policies allow an employee to bring his own electronic devices (namely external
devices), such as laptop or smart phones, inside the organization’s building.
The Government Organization can leverage FSG to reliably distinguish between
internal and external devices.
Contributions
Our results evidence a distinctive and unique feature of each individual storage devices, called File System Genome (FSG). In particular, the main contributions of this paper are:
-
1.
We put forward the definition of FSG, which can be used to distinguish two devices even if they use the same configurations (hardware and software) and store the same data. To the best of our knowledge, this feature has not been considered before.
-
2.
We devise an algorithm to map the FSG compliant with ext4, one of the most spread file systems used in both server and client workstations and we collect a huge set of real installations of the Debian GNU/Linux (more than installations of such operating system).
-
3.
We evaluate the File System Genome by investigating the entropy and min-entropy values, that characterize the diversity of the installations as stochastic process
Our results prove that an host can be reliably identified based on the File System Genome, showing a straightforward application to the forensics identification domain. Further, we believe that the File System Genome can be used as a building block for authentication protocols and, in general, to enforce other security properties.
Roadmap
The paper is organized as follows: Section 2 describes the causes of the non-determinism of the file block locations; it investigates the relevant aspects in the architecture of a modern operating systems focusing on the Linux kernel. Section 3 describes the environment and testbed in which our experiments have been performed and the evaluations of the proposed fingerprinting technique. Section 4 surveys related work, while Section 5 concludes the paper outlining future directions.
2 The non-determinism of the file block locations
This section investigates the software and hardware components that are involved in the choice of the block addresses selected during a write operation. Due to the unpredictable interleaving of these components, the overall result is the introduction of a certain level of randomness in file allocation, that originates the FSG diversity we measured in our experiments. This section also provides a description of the main features of the file system we based our experiments upon, and survey how the related structures influence the FSG.
In this paper we focus on Hard Disk Drives (HDDs): a type of storage device that stores data on rotating magnetic disks. The most important components of HDDs are: the mechanical arm, the head and the disk. These components are involved during every write operation; to perform a write, the arm places the head in the right position; then, the head writes the data on the rotating disk. The arms placements is the most time consuming operation, referred as seek time.
To reduce the seek time it is convenient to limit the movements of the arms. One of the kernel components that is involved in the seek-time optimization is the File Systems (FS). Indeed, whenever a user-space process invokes the write() system call, the data are copied in kernel space, splitted into blocks and prepared for the physical write [4]. When a write() system call returns, data are just placed in a write cache that resides in RAM. As such, there are no block locations that are marked as occupied when the write() system call returns to the caller. Through this mechanism, multiple physical write requests can be aggregated, reducing the mean seek time. The physical write on the storage device is performed by the kernel in predetermined time intervals through a specific operation called sync. The choice of the locations where the blocks has to be placed is performed by the sync operation, on the basis of the free blocks and the blocks present in the write cache.
Based on these observations, we define the File System Genome as the list of block locations used by a set of files.
Definition 1 (File System Genome (FSG))
Let be a File System hierarchy; The File System Genome, , is a matrix where each row represents the list of locations used to store the data blocks of the file belonging to .
The surprising results exposed in this paper highlight that the File System Genome presents a large amount of randomness may represent a distinctive and unique feature of each individual storage device.
In order to explain this phenomenon, consider the installer of a generic operating system. In Figure 1, during the installation process several files are written to the disk.
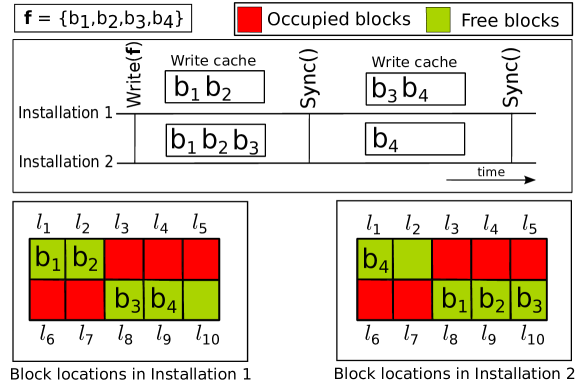
We take as a reference a generic file , which is composed by four blocks (). When the sync is invoked by the kernel, a different set of blocks is present within the write cache of the two installations. During installation only and are in the write cache at the time of sync. In this case, the best locations (i.e. the locations that minimize the seek time) are all the positions with at least two consecutive free blocks, that is the locations . Whereas, during installation , and are in the write cache at the time of the sync. In this case there is only one possible solution: . From this point onwards, the locations selected for the subsequent physical writes during installation diverge from the one selected by the installation . Please note, when the installer invokes the write system call for , the lists of free and occupied blocks are identical for the two installations, nevertheless that the described operating system optimization mechanisms can cause significative variations in the choices of the block locations. Further, Figure 1 describes only one example whereas there are many possible cases that depend on several factors such as the interleaving of the processes.
In two consecutive operating system installations, a different set of blocks can be present in the write cache for the same file. In addition, if we consider that the execution of the write and the sync operations are totally asynchronous and can have unpredictable interleavings, one can conclude that the overall effect is a non-determinism in the choice of the block location during each installation. Also, we have assumed for simplicity in Figure 1 that the sync operations occur at the same time during two different installations, however in reality such sync operations are unrelated, hence the degree of non-determinism is even higher as will be demonstrated in the following.
The following subsection provides a more detailed description of the unpredictable interleaving of FS operations in the case of the Linux kernel.
2.1 Linux I/O architecture for storage devices
Linux supports multiple file system types through a multi-tiered software architecture. In this section, we describe the kernel components involved during an I/O operations, focusing on the most widespread file system in the Linux environment: the Extended File System version (ext4).
2.1.1 Virtual File System
The Virtual File System (VFS) is an intermediate layer between the file system modules
(e.g. ext4) and the kernel system calls.
The first advantage of using the VFS is that different file systems can be
managed in a similar way by the kernel.
The interfaces exposed by the VFS are wrappers, that
forward a function to the FS specific implementation.
The abstraction provided by the VFS allows a user-level developer to invoke the I/O
system calls (e.g. read() and write()) without worrying about the
specific underlying FS . The VFS implements a common file model and all the FS drivers must comply with it.
The VFS splits large I/O requests into chunks of fixed-size and forces single-block
allocations without providing any information about the pending
operations on that file to the FS implementation. Due to a different
interleaving of the processes, the number of blocks that has been forwarded
to the lower layers at the sync time, can vary across different execution of
the installation procedure.
As such, the VFS influences which blocks are marked as free and which blocks
are present in the write cache when the kernel invokes the sync operation.
2.1.2 The Ext4 file system
Ext4 inherits several features from its previous versions; for this reason in the following we provide an overview of ext2 and ext3.
Ext2 and ext3 introduced several new features to improve the performance and the resilience to disk failures of the FS. In order to limit the internal fragmentation, they organize the blocks into groups. Each group covers adjacent tracks and includes both data and meta-information. In details, each block group contains: i) a copy of the file system’s superblock; ii) a group descriptors; iii) the block group bitmap, namely a structure that takes into account the free blocks in the group; iv) the inode data structures (bitmap and table); and, v) the data blocks. The ext2 and ext3 file systems preallocate exceeding data blocks to regular files before they are actually used. Such a strategy reduces fragmentation when the file size increases, since the data are allocated in adjacent location.
Ext4 is the last version of the family [9]. Ext4 supports larger file and larger partitions with respect to the previous versions, and introduces several new features. However, for the sake of this work, we focus on two of these features: i) the delayed allocation; and, ii) the multiple allocation. Delayed allocation, defers block allocations from the time of the write system calls to the time of sync. This feature brings several advantages: it increases the opportunity to combine many block allocation requests into a single request reducing fragmentation and saving CPU cycles; further, it avoids unnecessary block allocation for short-lived files. At the time of the write system call, ext4 estimates only the required number of blocks to reserve (marking it with the BH_DELAY flag) checking that enough free blocks are available in the file system to satisfy the write. Later, when the sync operation starts, all the dirty blocks (i.e. marked as BH_DELAY) are processed and clustered according to the logical locality that is established by the multiple allocation component. This component attempts to accommodate the requirements of both large and small files; in details, for small files ext4 uses a per-CPU locality policy which is shared by all allocations under the same CPU; this strategy allows to keep small files close to each other. In contrast, the allocation request of large files is performed using a per-file locality policy; as such, ext4 maintains an in-memory preallocation range for each file, and uses that to solve the fragmentation issues caused by concurrent allocations. With respect to the ext3 block allocation policy (single-block allocation), ext4 provides better performance for both small and large files [9]. These features of ext4 may contribute to increment the FS diversity; on the one hand, the per-CPU locality binds a write operation to the scheduling order, that cannot be considered deterministic. On the other hand, for two independent installations, a different set of blocks may be present in the write cache for the same file. Such diverse settings could lead to different allocation decisions; in particular, if only few blocks of a large file are present in the write cache, at the time of the sync, then the multiple allocation could wrongly exchange a large file for a small one. Due to the differences in the locality policies between large and small files, in ext4 this scenario cause differences in the the block locations, influencing the FSG.
Ext4 introduced several improvements in the block group management (e.g. flex_bg [9]), however, as in the previous versions, also in ext4 the top level directories are always spread in different groups. In the other cases, ext4 behaves as follows: if the new inode is a directory, then a forward search is made for a block group with both free space and a low directory-to-inode ratio; if that fails, then of a random group is returned. For other inodes, a forward search is performed from the parent directory’s block group to find a free inode (for more details please refer to the file fs/ext4/ialloc.c in the version 3.2.39 of the linux sources). Under these circumstances, during the installation procedure, the choices of the groups of the first files is demanded to a random function. Further, due to the delayed allocation and multiple allocation, also if the same block group is chosen in two different installations, there are differences in the obtained FSG.
2.2 Hardware faults
This subsection describes how the status of an HDD may influence the FSG.
Some physical blocks of an HDD can be marked as damaged by the widely used Self-Monitoring, Analysis and Reporting Technology system (SMART) 111http://en.wikipedia.org/wiki/S.M.A.R.T..
The SMART controller provides a way to measure drives’ characteristics at the firmware layer, by collecting the functional statistics of the HDD, e.g. track-seek retries, read errors, write faults, reallocated sectors, head fly height, and environmental temperature. Once the SMART recognizes an high error rate for some physical blocks, that blocks are marked as unusable.
Many factors can causes damages to an HDD. Damaged blocks, generated by manufacturing errors, are already present in the devices when they leaves the factory. In such case, the HDD owner will never uses the bad blocks, in some circumstances it may modify the disk’s geometry. More in general, an HDD can receive shocks (physical or electrical) and some blocks may be damaged. An HDD can also have one or more bad blocks. These blocks are handled in a different way by the SMART. The disk, at first, try to recover the information; next, it moves the recovered information to one or more spare blocks. The original block will be marked as ’bad’ and will no longer be addressable. The spare blocks are a limited resource.
Hardware faults, device lifetime, custom configurations or usage patterns contribute to the definition of the FSG.
3 Experiments and discussions
In order to provide a reliable support to our solution, we performed an extensive experimental campaign, described in detail and discussed in the following.
3.1 Test-bed and settings
In this section we describe the environment for our experiments and the strategy followed to obtain our results.
Our testbed includes the GNU/Linux OS Debian (version 6.0.6,
code-name squeeze) and the Ext4 file system implemented on the Linux
Kernel (version ). We choose this configuration due to its open-source
nature and its wide spread diffusion; indeed, the availability of the source
code allowed a deeper investigation on the causes of the randomness in the
FSG.
Usually, the installation procedure requires a large amount of time, since it
is an interactive process and often it involves slow-access devices (e.g. CD-Rom
or DVD). In order to mitigate these aspects,
we apply two strategy. On the one hand, we exploit the preseed feature
of the
Debian installer; the preseeding strategy simply provides a way to set answers
to questions asked during the installation process. In such way, there is no
need for a user monitoring the installation procedure since this task becomes fully
automated.
On the other hand, in order to reduce the time required to complete the
installation procedure, we copied the entire Free Software distribution of
Debian GNU/Linux on an USB drive, and used it as a source media for the actual
operating system installation.
The preseed feature requires the definition of a configuration file preseed.cfg located in the root of the initrd (initial ramdisk). The answers written in this file are read during the loading stage and they define the behaviour of the Debian software. In such a way, we can define how the installer works in advance; in details:
-
•
Environment. The keymap, the language the country and the time zone are set to US; the hardware provides an Ethernet card configured by the dhcp server; the installer creates two users (root and guest)
-
•
Disk settings. We do not use LVM or RAID technologies, but we required a regular installation: we use the entire disk and create the swap and the root partitions using the atomic mode in the preseed configuration where all files are placed in single partition. Since it is the default setting for the installer, we claim this parameters are the common ones used by the GNU/Linux users.
-
•
Post installation procedure. In addition, we have used the Post installation procedure to gather all the data and the statistics needed for our study. In particular, when each installation is completed, a script (named osfingerprint.sh) is started. This script fetches and saves the data that will be used in the subsequent data analysis. The post installation procedure collects the list of the blocks locations used by each file of the file systems.Each reboot triggers a new installation.
The post installation procedure gets the list of the blocks locations used by each file of the file systems. These data have gathered through the tool debugfs, a linux tool which can be used to examine and change the state of an ext2, ext3, or ext4 file system. All the data collected after each installation are sent to a remote repository.
All the experiments have been performed in the Computer Lab of the Computer Science Department of the Sapienza University of Rome. This laboratory is equipped with 28 workstations, having all the same hardware configuration: Intel(R) Pentium(R) 4 CPU , of volatile memory (DDR ) and of Hard Disk. We stress the fact that all the workstations have the same hardware configuration, being physically indistinguishable from each other. Moreover, the installed CPU does not provide Hyper-Threading support. It is important to recall that a multi-threaded environment may increase the non-determinism increasing the diversity between the installations. In this context, our testbed represents a worst case for our solution.
The experiments required about two weeks, and were carried out during the Christmas holidays. We collected and analyzed about installations. We claim this is a relevant data set providing a reliable support for the assessment of the FSG . To the best of our knowledge, this is the first dataset harvested from real operating system installations.
3.2 Installation corpus
In our experiments, we created two distinct dataset: i) the standard dataset, that represents the installations with the basic packages; and, ii) the full dataset, that represent the installations enriched with additional software. In particular, the standard installation is composed by files whereas the full installation contains files. Table 1 reports a high-level comparison between the full and the standard installations.
| Type | Standard | Full |
|---|---|---|
| Total Num. Files | 26389 | 121587 |
| Total Num. Blocks | 164360 | 873861 |
| Required Disk space | 642 MB | 3413 MB |
In details, the standard installation includes a desktop environment (Gnome 3) and common tools (e.g. a rich text editor like Libreoffice, graphics software, shell script etc.). Further, the standard installation includes some server environment software, e.g. the web-server (the Apache2 developed by the Apache Software Foundation), print-server (Cups systems), the DNS-Server (The ISC Bind application), file-server (Samba), mail-server (Exim Internet Mailer, namely the default choice of the Debian installer) and the SQL-database (Oracle MySQL server).
| Number of blocks | Standard | Full |
|---|---|---|
| [0 - 9] | (24108) | (110550) |
| [10 - 99] | (2096) | (10110) |
| [100 - 499] | (154) | (768) |
| [500 - 999] | (24) | (93) |
| [1000 - 1999] | (3) | (35) |
| [2000 - 3999] | (4) | (21) |
| more than 4000 | (0) | (7) |
In part of the experiments, we consider only the first block allocated for a file. We claim that this aspect does not adversely affect our results since the majority of the files of an operating system is stored in just few blocks as showed in table 2.
3.3 Evaluations
In order to introduce our full experiments, we have first studied the contribution of three specific files to the characterization of the FSG.
3.3.1 Single file analysis and representation of the File System Genome
We performed a punctual analysis with the aim to explore how single files can contribute to the diversity of the File System Genome.
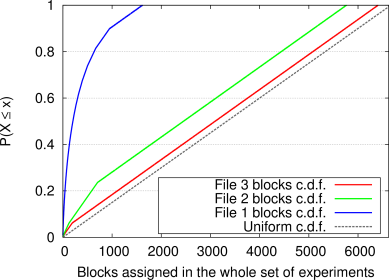
We have chosen three specific files that are part of the standard installation of Debian GNU/ Linux OS. The files considered occupies a single data block and are written in the following order: File 1 before File 2 and File 2 before File 3. Figure 2 shows the Cumulative Distribution Function (c.d.f.) related to the three random processes after installations of these three specific files. In the picture, the dotted line represents the uniform c.d.f, namely the ideal distribution where the block allocator choose a different block with the same probability in each installation. The other lines report the measured c.d.f. of the considered files. This figure shows that the random process of File 1 appears more predictable than the random process of File 3. Indeed, the random process of File 1 does not appear to be uniform: a file block is stored with probability one in the first locations. However, the c.d.f of File 2 and File 3 tend to approximate the ideal uniform distribution represented by the dotted line. This is due to the fact that the initial state of the installer procedure, is equal for all the installations. As the installation proceeds, the entropy of the random process gradually increases, getting close to the uniform distribution.
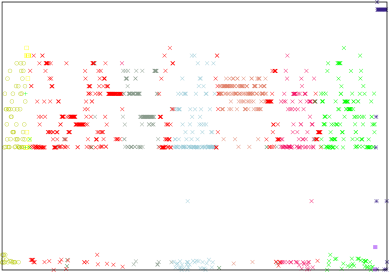
Figure 3 shows a graphical representation of a FSG of a specific Debian GNU/ Linux OS installation. In the figure, the x -axis lists the files that form the operating system installation, while the y-axis indicates the location of the first file block allocated for each file (the other file blocks are ignored in drawing the figure for clarity). We colored each point with the color of the parent directory to which the file belongs (in details, we consider only the /boot, /etc, /lib, /root, /usr and /var parent directories). As can be seen from the colors in the figure, the files in different parent directories tend to intermingle in the same areas of the storage device.
3.3.2 Entropy and min-entropy
The entropy and the min-entropy are largely used in many fields of security and networking, as metrics to distinguish network attacks or connection type [7, 15]. In fact, entropy-based approaches are attractive since they provide more fine-grained insights than statistical traffic analysis techniques. In our context, the entropy-based approaches capture fine-grained patterns in the selection of the block locations.
The concept of Entropy was introduced by Shannon in [14]. The classic definition says that entropy is a measure of the uncertainty associated with a random variable.
The entropy of a discrete random variable is defined by the formula:
where is the probability that assumes the value .
Min-entropy captures the amount of randomness that can be provided by a given distribution. According with the definition in [13], we compute the min-entropy with the following formula:
In other words, the min-entropy of a distribution is equal to the probability of the most likely element in being drawn from . As such, the min-entropy can be considered as a lower bound for the Shannon entropy.
The min-entropy of File System Genome is computed by Algorithm 1. The array contains all the installations in our dataset; the array contains the list of files of the current installation. is the list of the block locations, , used by file in installation . The matrix contains partial results; the -th row stores the statistics of the file for all the installations: each column stores the number of times that the block location has been assigned to the file . The first part of the algorithm is devoted to the computation of the matrix , then, we compute the min-entropy for each file of the installation. It is important to notice that the probability of choosing a location of a file is calculated by dividing by the number of performed installation, instead of the number of block locations available in the disk. Indeed, the number of block locations in an HDD is greater then the number of performed installations. Therefore, we consider this estimation as a lower bound of the real value of the min-entropy. Note that this analysis has been inspired by [16], where authors evaluate whether an accelerometer sensor can be considered as source of randomness, and by [5], where the author evidences how modern web browsers can be fingerprinted.
The entropy is estimated in a similar way; the only difference with respect to Algorithm 1 is in the lines 11 up to 14 that are replaced by the entropy estimation according to the previous formula.
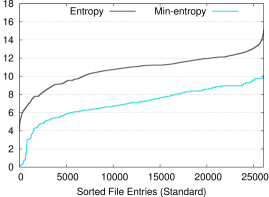
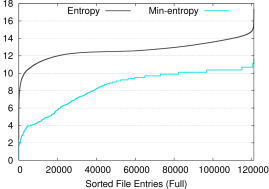
Figures 4(a) and 4(b) show the entropy and min-entropy of the standard and full installations respectively. The graphs represents the evaluation related to for each of the installations types. On the x-axis are reported the files considered to evaluate entropy and min-entropy. Note that, the full installation contains more files rather than the standard one, i.e. the x-axes have well distinct order of magnitude. As the graphs show, the operating system strives to cluster the blocks of the file—that is, exploiting the space locality principle. Nonetheless, as it can be noticed, the entropy and min-entropy values reach high values, justifying the rational of our proposal. As such the results of the entropy measures highlight a significant amount of diversity in the collected corpus of installations and suggest that File System Genome can be considered a distinctive and unique feature. Moreover, all the experiments have been performed using the same components (in terms of hardware and software); we emphasize this is the worst case, in fact, using distinct configuration (e.g. different HDD and CPU as well as FS ) we can get even more profitable results.
4 Related work
The research area closest to the issues addressed in our paper appears to be Forensic identification. It is worth describing some of these related results, even though we stress that the approach we consider in this paper has not been considered before.
Forensic identification is subject of many research and it is used in many applications. A well know forensic identification task involves the characterization of printers. Despite the large use of digital communications, printed document is still used in many criminal and malicious activities. Consider for examples the forgery or alteration of national documents, e.g. an ID card. Printed material may be also used as evidence of illicit activities, e.g. meeting notes, paper correspondences, boarding passes or bank transactions, [10]. Hence, it may be desirable to have the capability of identifying the manufacturer, model, or even a specific device that was used to produce a paper document. In this context, forensic characterization of printer papers involves finding features in the printed document that are uniquely related to a specific printer. This printer signatures directly emerge from printer mechanism as shown by many research, [1, 2] and others. Forensic identification of printers are manifold. A forensic technique used for the identification of printer device exploits the print quality defect, namely the banding in electro-photographic (EP). Results in literature, show that different printers expose different sets of banding frequencies that are related to brand and model. In the same fashion, it is possible to extract printer signatures by capturing the banding signal within the height of one text character. A surprising result, [11], shows that the print quality defects, are considered as texture in the printed regions of the document. The features can be extracted from individual printed characters, in particular, the letter “e” in a document. In this case, authors extract the signature using machine learning approaches.
Next, there exists many forensic identification technique for wired and wireless (RF) communication devices. In [6], authors propose a novel approach based on the utilization of the signal characteristics of wired Ethernet card for use in a security context. In fact, the ability of distinguish two NIC may be used as communication filter able to prevent arp spoofing attacks and, in general, to control the authenticity of either the source or the destination of a wired communications. The signature of a wired network interface can be extracted from the minute variations of the transient portion extracted by the produced signal. This variations result from hardware and manufacturing inconsistencies,
Wireless devices can be identified using similar approaches. Software that implements such forensic mechanisms can remotely identify the types of devices located in a specific environment, realizing a layer Intrusion Detection Systems. These techniques, [12], are usually implemented by the following steps: i) a specially designed probe signal is sent in the wireless domain, ii) the response signal is then captured and iii) exterminated in order to verify the identity of the wireless device. In fact, the response signal contains unique distortion feature generated by the RF circuitry of the device in a nonlinearities fashion; these distortions are used as fingerprint of the device.
5 Conclusions
This paper introduces File System Genome, a novel solution for the unique identification of HDDs. The File System Genome technique leverages the diversity of the physical blocks locations used to store the files of an operating system.
To support our proposal, we justify our rationale, providing an insight of the reasons that make two different installations of the same OS on the same machine fundamentally different, when analyzed with the lens of our proposal. Our findings are supported by an extensive experimental campaign: we carried out some installations of the Debian GNU/Linux operating systems. All the installations have been performed in a real testbed using the same hardware (storage devices, motherboard, CPU, etc..). The resulting huge data set has been analyzed resorting to sound information theory tools (entropy and min-entropy). All the analyzed metrics show that the File System Genome is a distinctive and unique feature of each individual HDD. Note that, given the rationales our solution is based upon, we expect that the File System Genome can be successfully applied to other mass storage devices as well (e.g. SSDs, Flash memories).
As for future work, we plan to spend our efforts spent in two directions: the use of the File System Genome as a building block for authentication protocols based on challenge/response; and, the definition of the genomes of other species, namely other file systems and operating systems.
References
- [1] G. N. Ali, P. Chiang, A.K. Mikkilineni, J.P. Allebach, G.T.C. Chiu, and E.J. Delp. Intrinsic and extrinsic signatures for information hiding and secure printing with electrophotographic devices. In International Conference on Digital Printing Technologies, pages 511–515, 2003.
- [2] Gazi N. Ali, Pei-Ju Chiang, Aravind K. Mikkilineni, George T.C. Chiu, Edward J. Delp, and Jan P. Allebach. Application of principal components analysis and gaussian mixture models to printer identification. In International Conference on Digital Printing Technologies, volume 20, pages 301–305, 10 2004.
- [3] Paul Blythe and Jessica Fridrich. Secure digital camera. In in Proceedings of Digital Forensic Research Workshop, pages 17–19, 2004.
- [4] Daniel Bovet and Marco Cesati. Understanding the Linux Kernel, Second Edition. O’Reilly & Associates, Inc., Sebastopol, CA, USA, 2 edition, 2002.
- [5] Peter Eckersley. How unique is your web browser? In Proceedings of the 10th international conference on Privacy enhancing technologies, pages 1–18, 2010.
- [6] R.M. Gerdes, M. Mina, S.F. Russell, and T.E. Daniels. Physical-layer identification of wired ethernet devices. In Information Forensics and Security, IEEE Transactions on, volume 7, pages 1339–1353, 2012.
- [7] Yu Gu, Andrew McCallum, and Don Towsley. Detecting anomalies in network traffic using maximum entropy estimation. In In ACM SIGCOMM, pages 32–32, 2005.
- [8] Nitin Khanna, Aravind K. Mikkilineni, Anthony F. Martone, Gazi N. Ali, George T. C. Chiu, Jan P. Allebach, and Edward J. Delp. A survey of forensic characterization methods for physical devices. In Digital Investigation., volume 3, pages 17–28, 2006.
- [9] A. Mathur, M Cao, S. Bhattacharya, A. Dilger, A. Tomas, and L. Vivier. The new ext4 filesystem: current status and future plans. In Linux Symposium, 2007.
- [10] Aravind K. Mikkilineni, Gazi N. Ali, Pei-Ju Chiang, George T.-C. Chiu, Jan P. Allebach, and Edward J. Delp. Signature-embedding in printed documents for security and forensic applications. In Security, Steganography, and Watermarking of Multimedia Contents, pages 455–466, 2004.
- [11] Aravind K. Mikkilineni, Osman Arslan, Pei ju Chiang, Roy M. Kumontoy, Jan P. Allebach, and George T. c. Printer forensics using svm techniques. In International Conference on Digital Printing Technologies, pages 223–226, 2005.
- [12] J.C. Pedro and N.B. Carvalho. Intermodulation Distortion in Microwave and Wireless Circuits. Artech House Microwave Library. Artech House, 2003.
- [13] A. Renyi. On measures of information and entropy. In Proceedings of the 4th Berkeley Symposium on Mathematics, Statistics and Probability, pages 547–561, 1960.
- [14] Claude E. Shannon. A mathematical theory of communication. In The Bell system technical journal, volume 27, pages 379–423, 1948.
- [15] Domenico Vitali, Antonio Villani, Angelo Spognardi, Roberto Battistoni, and Luigi V. Mancini. Ddos detection with information theory metrics and netflows - a real case. In SECRYPT, pages 172–181, 2012.
- [16] J. Voris, N. Saxena, and T. Halevi. Accelerometers and randomness: perfect together. In Proceedings of the fourth ACM conference on Wireless network security, pages 115–126, 2011.