Radio frequency spectroscopy measurement of the Landé factor of the state of Ba+ with a single trapped ion
Abstract
We report an improved measurement of the Landé factor of the state of singly ionized barium. Measurements were performed on single Doppler-cooled 138Ba+ ions in linear Paul traps using two similar, independent apparatuses. Transitions between Zeeman sublevels of the and states were driven with two independent, stabilized radio-frequency synthesizers using a dedicated electrode within each ion trap chamber. State detection within each Zeeman manifold was achieved with a frequency-stabilized fiber laser operating at 1.76 m. By calculating the ratio of the two Zeeman splittings, and using the measured Landé factor of the state, we find a value of 1.200 371 for .
I Introduction
As atomic theorists’ computational techniques become increasingly accurate and sophisticated, precision experiments are necessary to confirm the results of their calculations. The substructure of the long-lived state of Ba+ (s Nagourney et al. (1986); Gurell et al. (2007)) is an ideal testing ground since calculations are complicated by uncertainty in the wavefunctions used. For this state, the Landé factor is expected to be 6/5 from pure L-S coupling, however QED and relativistic corrections to this quantity have not been predicted by atomic theorists to our knowledge. A method similar to Ref. Lindroth and Ynnerman (1993) could offer an improved prediction. A precision measurement of this quantity could offer insight into these higher order corrections.
Additionally, relativistic coupled cluster (RCC) calculations can be employed to calculate hyperfine structure constants Sahoo (2006), and an experiment Lewty et al. (2012) has measured hyperfine constants in the state of 137Ba+ () to the highest precision to date. If the hyperfine constants are measured in the level as well, the nuclear magnetic octupole moment of 137Ba+ can be extracted unambiguously, as all second-order theory corrections can be eliminated Beloy et al. (2008). However, the situation for the level is complicated by the fact that the strength of the hyperfine interaction is on the same order as that of the Zeeman interaction in a magnetic field of convenient size. Thus, to measure the hyperfine constants with sufficient accuracy to test atomic theory, the Landé factor of the level of Ba+, , must be measured to higher accuracy than previous measurements Moore (1908); Back (1923); Curry (2004); Kurz et al. (2010).
II Experimental Procedure
For this measurement of , we performed precision radio-frequency (rf) spectroscopy on single trapped 138Ba+ ions using two independent experimental apparatuses. The ions are confined with linear Paul traps, one similar to Olmschenk et al. (2007), and the other to Gulde (2003), driven with an rf potential operating at approximately 11.4 MHz and 11.9 MHz respectively. We will refer to these as the “rod” trap, and the “blade” trap in the following discussion, owing to their designs. A pair of current-carrying coils generates a stable, adjustable magnetic field of up to 10 Gauss, which provides a quantization axis for the ion, as well as the Zeeman splitting of the levels.
The energy level diagram along with the relevant transitions for 138Ba+ is shown in Fig. 1. The ion is Doppler cooled on the transition with a laser operating at 493 nm. Since the state can decay into the long lived state ( 80s Gurell et al. (2007)), the ion must be repumped using a second laser at 650 nm. Both of these beams are linearly polarized for Doppler cooling. The ion can be optically pumped into either Zeeman sublevel with efficiency by switching from a cooling 493 nm beam to a second, circularly-polarized beam which is aligned parallel to the quantization axis.
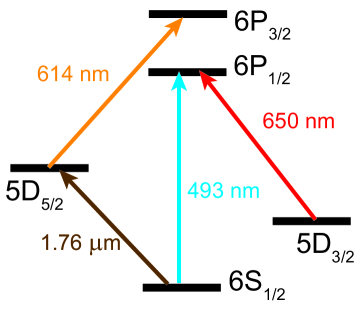
A narrowband fiber laser operating at 1.76 m is frequency stabilized to a reference cavity with a finesse of approximately 1000 as detailed in Kurz et al. (2010). This laser is used to drive the transition from the () ground state sublevel to the () metastable sublevel using adiabatic rapid passage sweeps Noel et al. (2012); Wunderlich et al. (2007). Exciting the ion to the shelved state removes the ion from the cooling cycle Nagourney et al. (1986). State detection is performed using a photomultiplier tube (PMT) to count photons emitted from the transition while the cooling lasers are incident on the ion: a shelved ion will appear “dark,” unshelved will be “bright.” The ion is returned to the cooling cycle using 614 nm light that addresses the transition in the “rod” trap, while in the “blade” trap, the 1.76 m laser is used.
Within each ion trap chamber, a dedicated current loop is used to generate tunable rf magnetic fields, which can drive magnetic dipole (M1) transitions between Zeeman sublevels. An rf synthesizer generates a stable sinusoidal voltage which is amplified and dropped over a 50 ohm rf resistor, producing a current that is passed through the current loop to ground. The synthesizer in the “rod” setup was referenced to a SymmetriCom Cs frequency standard; the synthesizer in the “blade” setup demonstrated agreement to the Hz level when compared to the same frequency standard.
The experimental sequence for the measurement of the Zeeman splitting is as follows. We first Doppler cool the ion on the 493 nm and 650 nm transitions for approximately 20 ms. The main 493 nm light is extinguished, and the secondary 493 nm beam with circular polarization optically pumps the ion into the () sublevel in 10 s . The 493 nm and 650 nm beams are then fully extinguished, and the ion is driven to the () sublevel using an adiabatic rapid passage sweep with the 1.76 m laser. Typical efficiency for the adiabatic rapid passage is % in the “blade” trap and 80% in the “rod” trap. A constant frequency pulse of rf magnetic field, triggered on a specific phase of the 60 Hz ac voltage is then applied. Then the 1.76 m laser is swept again. If a transition between the Zeeman sublevels was driven by the rf pulse, the ion would remain in the state and would be “dark” when the cooling lasers are turned on. If no transition occurred, the ion would be returned to the state and appear “bright.” The fluorescence state of the ion is recorded, and, if the ion was “dark,” the ion is returned to the cooling cycle. The experiment is then repeated, varying the frequency of the rf magnetic field, until a resonance frequency, , is found. In a similar way, the Zeeman transition frequency of the ground state, , is measured.
To calculate the Landé factor of the state, and must be measured in quick succession to counter the effects of fluctuations in the ambient magnetic field. The resonance frequency of each state is given by:
| (1) |
where is Planck’s constant, is the Bohr magneton, and is the magnitude of the laboratory magnetic field. Given measured resonance frequencies, can be calculated from:
| (2) |
assuming that the magnetic field remains constant over the duration of the experiment. The experimentally measured value of is 2.002 490 6(11) Knab et al. (1993).
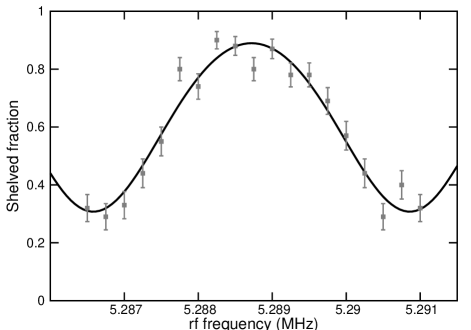
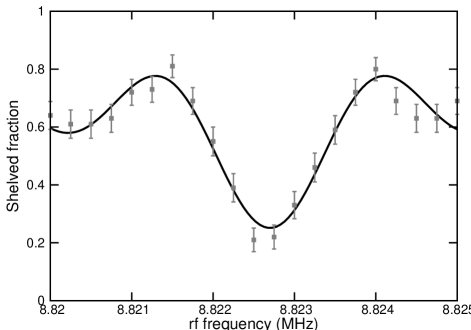
We measured the resonance frequencies, and , at an applied field of approximately 3-4 Gauss in each setup. A typical measurement of the ground and exited states “shelving” probability is shown in Fig. 2. The fraction of the trials finding an ion in the “dark” state is plotted against the frequency of the applied rf current, with error bars indicating the 1- statistical standard deviations based on 100 trials at each frequency. The curves are found from four parameter least squares fits to the function:
| (3) |
where . The four fit parameters are two scaling factors, and , which account for imperfect transfer efficiency with the 1.76 m laser and imperfect optical pumping, the Rabi frequency of the transition, , and the resonance frequency, .
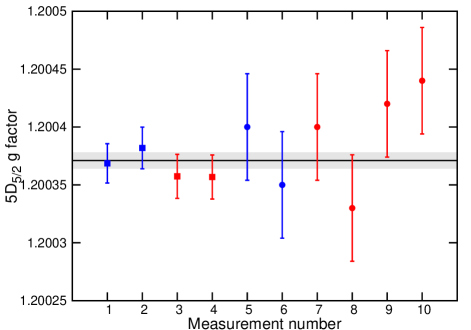
Each pair of independent resonance measurements allows us to calculate . The results of these measurements are summarized in Fig. 3, shown with a combined statistical uncertainty and systematic uncertainty. The statistical uncertainty arises from the binomial uncertainties in the measured shelved fractions at each frequency propagated through to an error in the fit resonance frequency, , and the systematic uncertainty will be discussed in the following section.
III Systematic Effects
There are several systematic effects that could skew the measurement of , however all appear to be well controlled in our experiment. The effects that we analyze are magnetic field fluctuation, magnetic field gradients, ac Zeeman effect, and 60 Hz jitter.
Because neither experimental apparatus employs magnetic shielding, fluctuating ambient magnetic field is the most important systematic effect. We are aware of several sources for this error. The largest is due to the public transit system in close proximity to the experiments. Large unbalanced currents powering electric buses transiently change the magnetic field in the laboratory. Additionally, we have observed magnetic field drifts as magnetized objects in the laboratory slowly relax.
To quantify this effect, we proceeded in two directions. Since the ground state splitting, , is proportional to the magnetic field, any change in the ambient field would change the resonant splitting. By repeating the measurement of , we can observe any fluctuations in the magnetic field. Doing so, we find that the magnetic field fluctuates randomly by approximately 180 G over a 5 minute period for the “blade” setup. This appears as an uncertainty in of . Additionally, we installed a three-axis fluxgate magnetometer near the “rod” trap and monitored the magnetic field while data was being collected. We find that the largest drift over the course of a measurement of the Zeeman resonance (approximately 400 s) corresponds to a 20 G drift in the ambient field resulting in a conservative systematic error of to each measurement of . Since the magnetic field fluctuates randomly, multiple measurements will reduce this error. Any fast fluctuations of the magnetic field will result in broadening of the Zeeman resonance line shape.
A magnetic field gradient could also affect this measurement if the ion were to shift its position over the course of the experiment. To check this, we measured the ground state resonance, , at two positions along the trap axis separated by 26 m. The observed change in the resonance frequency corresponded to a change in the magnetic field of 360 G, indicating a 0.14 G/cm gradient. However, we find that during a single experiment, the ion does not change its position by more than 1 m, placing an upper limit of on the systematic uncertainty of .
Presence of trapping rf voltages may cause an ac-Zeeman effect that would perturb the resonance frequencies of the ground and excited states differently. This effect may manifest itself either because the ion exhibits enhanced micromotion and oscillates at along a magnetic field gradient or due to an ac current at produced by the trapping electrodes, which would produce an oscillating magnetic field at the ion. Either of these ac-Zeeman effects depend on the amplitude of the rf voltage that drives the trap. Measuring at vastly different trap rf voltages, we find that an ac-Zeeman effect does not result in a statistically significant shift. The measurements at low (high) trap rf voltage are plotted in blue (red) in Fig. 3. We can place a fractional error of on this effect.
Lastly, the experiment is triggered at a specific phase of the ac line voltage. The small jitter in this line trigger would affect the measurement of below the level.
A summary of these systematic effects can be found in Table 1.
| Error Source | “Rod” | “Blade” |
|---|---|---|
| B Fluctuations | ||
| B Gradient | ||
| ac Zeeman Effect | ||
| 60Hz Jitter | ||
| Total |
IV Conclusions
Using precision rf spectroscopy, we have measured the Landé factor of the level of 138Ba+ to be 1.200 367 in the “rod” apparatus and 1.200 388 in the “blade” apparatus. These independent measurements combine to yield a value of 1.200 371. The reduced of these 10 measurements was found to be 0.7. This measurement offers a factor of 70 reduction in statistical uncertainty from the previous measurement Kurz et al. (2010) and is, to our knowledge, the most accurate measurement to date. It should be noted that our group’s previous result Kurz et al. (2010) disagrees with this new measurement by more than 3.5-. The value in Kurz et al. (2010) is heavily shifted by a couple of outlying data points, which were included for completeness. We reanalyzed this data, removing the outliers, and find a result of 1.2004(5), which is consistent with the improved measurement reported here. It has also come to our attention that there is a new reported value of that differs in a statistically significant way from the result reported here Lewty et al. (2013). We feel that the simplicity of the methodology and analysis of the experiment reported here lends confidence to our result.
The improved measurement of should enable us to perform the measurement of the hyperfine intervals of 137Ba+ once magnetic shielding is employed in the experimental setup, which is necessary for all of our future work. This will reduce the most significant systematic error present in this experiment and will allow us to place better constraints in the future.
Acknowledgements.
The authors wish to thank John Wright, Richard Graham, Zichao Zhou, Chen-Kuan Chou, Nathan Kurz, Brent Graner, Jennie Chen, Eric Lindahl, and Blayne Heckel for helpful discussions. Additional thanks to William Terrano and H. Erik Swanson for the use of a fluxgate magnetometer. This research was supported by National Science Foundation grants 0906494 and 0904004.References
- Nagourney et al. (1986) W. Nagourney, J. Sandberg, and H. Dehmelt, Phys. Rev. Lett. 56, 2797 (1986).
- Gurell et al. (2007) J. Gurell, E. Biémont, K. Blagoev, V. Fivet, P. Lundin, S. Mannervik, L.-O. Norlin, P. Quinet, D. Rostohar, P. Royen, et al., Phys. Rev. A 75, 052506 (2007), URL http://link.aps.org/doi/10.1103/PhysRevA.75.052506.
- Lindroth and Ynnerman (1993) E. Lindroth and A. Ynnerman, Phys. Rev. A 47, 961 (1993), URL http://link.aps.org/doi/10.1103/PhysRevA.47.961.
- Sahoo (2006) B. K. Sahoo, Phys. Rev. A 74, 020501 (2006), URL http://link.aps.org/doi/10.1103/PhysRevA.74.020501.
- Lewty et al. (2012) N. C. Lewty, B. L. Chuah, R. Cazan, B. K. Sahoo, and M. D. Barrett, Opt. Express 20, 21379 (2012), URL http://www.opticsexpress.org/abstract.cfm?URI=oe-20-19-21379.
- Beloy et al. (2008) K. Beloy, A. Derevianko, V. A. Dzuba, G. T. Howell, B. B. Blinov, and E. N. Fortson, Phys. Rev. A 77, 052503 (2008).
- Moore (1908) B. E. Moore, Annalen der Physik 330, 309 (1908), ISSN 1521-3889, URL http://dx.doi.org/10.1002/andp.19083300208.
- Back (1923) E. Back, Annalen der Physik 375, 333 (1923), ISSN 1521-3889, URL http://dx.doi.org/10.1002/andp.19233750503.
- Curry (2004) J. J. Curry, Journal of Physical and Chemical Reference Data 33, 725 (2004), URL http://link.aip.org/link/?JPR/33/725/1.
- Kurz et al. (2010) N. Kurz, M. R. Dietrich, G. Shu, T. Noel, and B. B. Blinov, Phys. Rev. A 82, 030501 (2010), URL http://link.aps.org/doi/10.1103/PhysRevA.82.030501.
- Olmschenk et al. (2007) S. Olmschenk, K. C. Younge, D. L. Moehring, D. N. Matsukevich, P. Maunz, and C. Monroe, Phys. Rev. A 76, 052314 (2007).
- Gulde (2003) S. Gulde, Ph.D. thesis, University of Innsbruck, Innsbruck, Austria (2003).
- Noel et al. (2012) T. Noel, M. R. Dietrich, N. Kurz, G. Shu, J. Wright, and B. B. Blinov, Phys. Rev. A 85, 023401 (2012), URL http://link.aps.org/doi/10.1103/PhysRevA.85.023401.
- Wunderlich et al. (2007) C. Wunderlich, T. Hannemann, T. Körber, H. Häffner, C. Roos, W. Hänsel, R. Blatt, and F. Schmidt-Kaler, Journal of Modern Optics 54, 1541 (2007), URL http://www.tandfonline.com/doi/abs/10.1080/09500340600741082.
- Knab et al. (1993) H. Knab, K. Knöll, F. Scheerer, and G. Werth, Zeitschrift für Physik D Atoms, Molecules and Clusters 25, 205 (1993), ISSN 0178-7683.
- Lewty et al. (2013) N. C. Lewty, B. L. Chuah, R. Cazan, B. K. Sahoo, and M. D. Barrett (2013), preprint, URL http://arxiv.org/abs/1305.4453.