Theoretical Procedures and the effect on PDFs and
Abstract:
I consider the effect on partons distribution functions (PDFs) of changes in the theoretical procedure used in a PDF fit. I consider using the 3-flavour fixed flavour number scheme instead of the standard general mass variable flavour number scheme used in the MSTW analysis. This results in the light quarks increasing at most values, the gluon distribution becoming softer at high values of and larger at small , and the coupling constant falling, particularly at NNLO. The fit quality also deteriorates.I also consider lowering the kinematic cut on for DIS data and introducing higher twist terms which are fit to data. This results in much smaller effects on both PDFs and , with changes generally smaller than uncertainties, except for quarks at very high . I show that the fixed flavour scheme and variable flavour scheme structure functions differ significantly for at high . I demonstrate that in the fixed flavour scheme there is a slow convergence of large logarithmic terms of the form in this regime. I conclude that some major differences in PDF sets are largely due to the choice of flavour scheme used.
There have recently been improvements in the PDF determinations by the various groups, generally making the predictions more consistent. However, there are still some large differences which are sometimes much bigger than the individual PDF uncertainties [1, 2, 3]. This is particularly the case for cross sections depending on the high- gluon.In this article I investigate potential reasons, based on different theoretical procedures that can be chosen for a PDF fit.
I first examine the number of active quark flavour used in the calculation of structure functions, where there are two choices for how one treats the charm and bottom quark contributions. In the Fixed Flavour Number Scheme (FFNS) , i.e. for massive quarks are only created in the final state. This is exact but does not sum all terms in the perturbative expansion. The FFNS is known at NLO [4] but not fully at NNLO (). Approximate results can be derived e.g. [5], (and are sometimes used in fits, e.g. [6]) but these NNLO corrections are not large except near threshold and very low . In a variable flavour scheme one uses the fact that at the heavy quarks behave like massless partons and the terms are summed via evolution. PDFs in different number regions are related perturbatively, where the perturbative matrix elements are known exactly to NLO [7]. The original Zero Mass Variable Flavour Number Scheme (ZM-VFNS) ignores corrections in cross sections, i.e. , but this is an approximation at low and PDF groups use a General-Mass Variable Flavour Number Scheme (GM-VFNS) taking one from the two well-defined limits of and instead. Some variants are reviewed in [8].
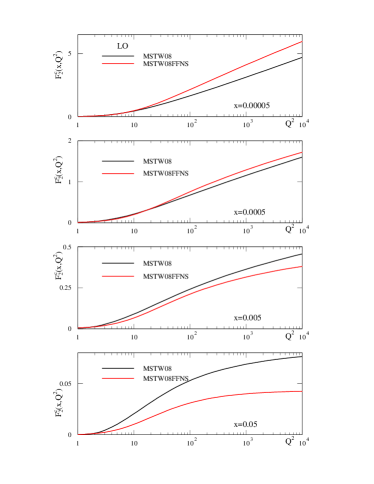
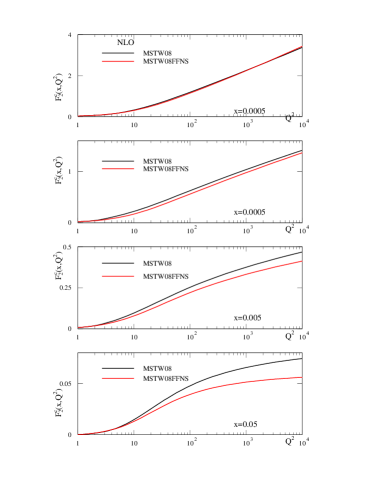
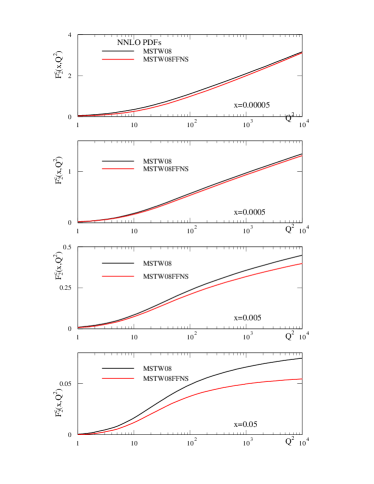
The predictions using FFNS and the TR’ GM-VFNS [9] for using the MSTW2008 input distributions [10] are shown in Fig. 1. At LO there is a big difference between the two. At NLO at high for the FFNS is nearly always lower than for the GM-VFNS, significantly so at higher . For FFNS at NNLO only NLO coefficient functions are used, but (various choices of) approximate corrections give only only minor increases. There is no dramatic improvement in the agreement between FFNS and GM-VFNS at NNLO compared to NLO, contrary to what one might expect.
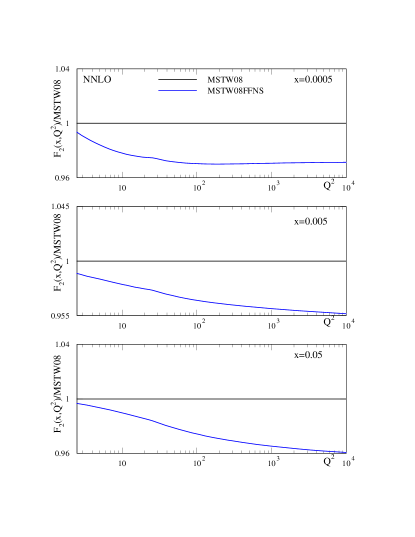
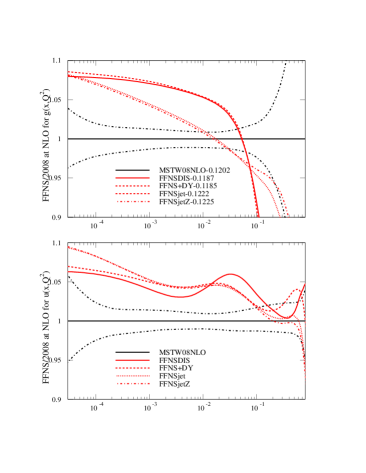
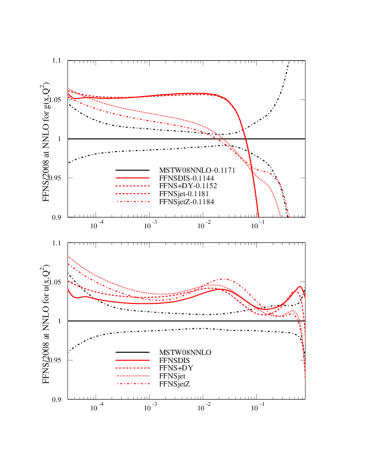
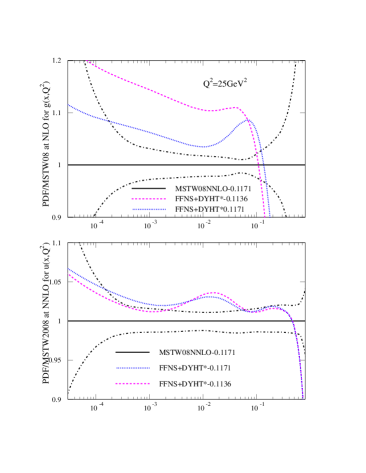
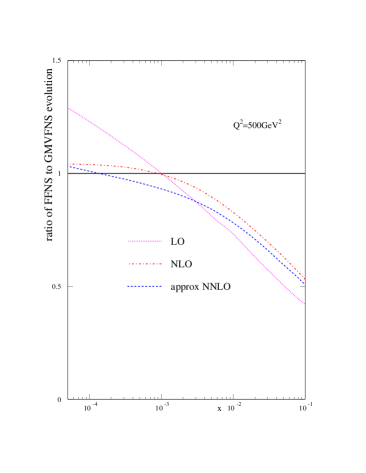
This - difference in can lead to over changes in the total , see Fig 2. At this is mainly due to . At lower there is a contribution to the difference from light quarks evolving slightly more slowly in FFNS. For the FFNS and GM-VFNS are very similar. In order to test the importance of this difference I have extended an investigation in [12] and performed fits using the FFNS scheme. At NNLO heavy flavour coefficient functions are used as default (which has been done in other fits, e.g. [11]). Approximate expressions change the results very little. Fits are primarily to only DIS and Drell-Yan data, but are also extended to Tevatron jet and Drell-Yan data using the 5-flavour scheme in these cases. The data chosen are as in [10]. The fit quality for DIS and Drell-Yan data are at least a few tens of units higher in in the FFNS fit than in the MSTW2008 fit. FFNS is often slightly better for , but is flatter in for for the total . When using the FFNS the fit quality for DIS and Drell Yan deteriorates by units when Tevatron jet and data are included, as opposed to units or less when using a GM-VFNS. The resulting PDFs evolved up to (using variable flavour evolution for consistent comparison) are shown in Fig. 3. The PDFs and are different in form to the MSTW2008 PDFs, with larger light quarks, a gluon which is bigger at low and much smaller at high and a smaller . Some similar differences have been noted in [13, 14]. Using FFNS rather than GM-VFNS leads to much larger changes than any variation in choice of GM-VFNS [12].
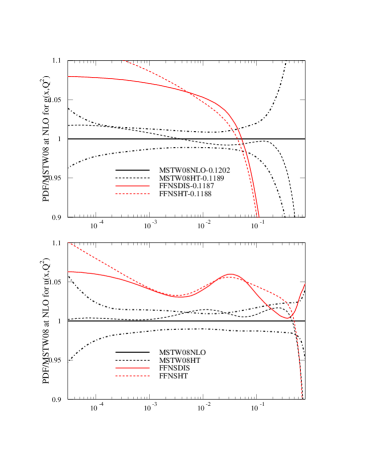
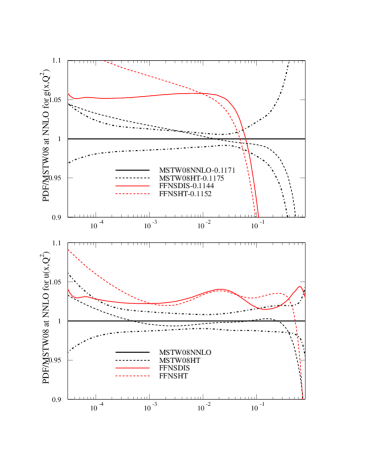
I have also investigated the effect of lowering the cut to and parameterising higher twist corrections in the form in 13 bins of , and fitting the and PDFs simultaneous, as in [15]. The are similar to this older study, though larger at the smallest . The effect on the PDFs and is small, using either FFNS or GM-VFNS, except for very high- quarks, as shown in Fig. 4. I also perform FFNS fits restricting higher twist from the lowest values and omitting the less theoretically clean nuclear target data (except dimuon cross sections, which constrain the strange quark). This results in values of of at NLO and at NNLO, very close to those in [11], where the scheme choice, data types, and form of higher twist (and the resulting PDFs) are similar.
I also perform fits where is fixed to the higher value obtained in the GM-VFNS. This results in the FFNS gluon being a little closer to that using GM-VFNS, as shown in the left of Fig. 5 and very similar to [14], where studies are performed with fixed . The fit quality to DIS and low-energy DY data in the FFNS fit is 8 units worse when than for 0.1136. The fit to HERA data is better, but worse for fixed target data. One can understand the need for to be smaller in FFNS. To compensate for
smaller at the FFNS gluon must be bigger in this region, and from the momentum sum rule, is smaller at high .The correlation between the high- gluon and when fitting high- DIS data drives down (for reduced gluon the quarks fall with too quickly, hence the need to lower ), requiring the small gluon to even bigger, until stability is reached.
To explain the differences between FFNS and GM-VFNS evolution, shown for in the right of Fig. 5, I consider high . At LO in the FFNS (setting all scales as )
| (1) | |||||
| (2) |
At LO in the GM-VFNS, where we have
| (3) |
The first terms in each expression are equivalent. The difference between the LO expressions is
| (4) |
where . The effect of is negative at high and positive at small . That of is negative at high , but smaller than . Hence, the difference is large and positive at high and large and negative at small , as observed in Fig 5. Moreover, this difference must be eliminated at NLO by defining the leading-log term in the FFNS expression to provide cancellation, i.e.
| (5) |
up to quark mixing corrections and sub-dominant terms. In the NLO evolution all terms cancel in the difference. However, the derivative of contains which does not cancel. This leads to . The factor of is large, positive at high and negative at small , but not until smaller than at LO. Therefore, is large and positive at high , negative for smaller and positive for extremely small . This explains the behaviour correctly. Repeating the argument at NNLO This is large and positive at high then changes sign twice but stays small until becoming negative at tiny . Again this explains the behaviour correctly.
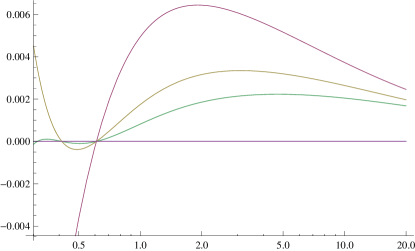
To look at the effect of this dominant high- difference between GM-VFNS and FFNS evolution, it is useful to define the moment space anomalous dimension obtained from . This is shown at LO, NLO and NNLO for in Fig. 6. At high , values of correspond to , where only tends to zero slowly as the perturbative order increases. This explains why FFNS evolution for only slowly converges to the GM-VFNS result with increasing order.
Acknowledgements
I would like to thank A. D. Martin, W. J. Stirling and G. Watt for numerous discussions on PDFs. This work is supported partly by the London Centre for Terauniverse Studies (LCTS), using funding from the European Research Council via the Advanced Investigator Grant 267352.
References
- [1] G. Watt, JHEP 1109 (2011) 069 [arXiv:1106.5788 [hep-ph]].
- [2] S. Forte and G. Watt, arXiv:1301.6754 [hep-ph].
- [3] R. D. Ball, et al., JHEP 1304 (2013) 125 [arXiv:1211.5142 [hep-ph]].
- [4] E. Laenen, S. Riemersma, J. Smith and W. L. van Neerven, Nucl. Phys. B 392 (1993) 162.
- [5] H. Kawamura, N. A. Lo Presti, S. Moch and A. Vogt, Nucl. Phys. B 864 (2012) 399 [arXiv:1205.5727 [hep-ph]].
- [6] S. Alekhin, J. Blumlein and S. Moch, Phys. Rev. D 86 (2012) 054009 [arXiv:1202.2281 [hep-ph]].
- [7] M. Buza, Y. Matiounine, J. Smith and W. L. van Neerven, Eur. Phys. J. C 1 (1998) 301 [hep-ph/9612398].
- [8] J. R. Andersen et al. [SM and NLO Multileg Working Group Collaboration], arXiv:1003.1241 [hep-ph], and references therein.
- [9] R. S. Thorne, Phys. Rev. D 73 (2006) 054019 [hep-ph/0601245].
- [10] A. D. Martin, W. J. Stirling, R. S. Thorne and G. Watt, Eur. Phys. J. C 63 (2009) 189 [arXiv:0901.0002 [hep-ph]].
- [11] S. Alekhin, J. Blumlein, S. Klein and S. Moch, Phys. Rev. D 81 (2010) 014032 [arXiv:0908.2766 [hep-ph]].
- [12] R. S. Thorne, Phys. Rev. D 86 (2012) 074017 [arXiv:1201.6180 [hep-ph]].
- [13] A. M. Cooper-Sarkar, arXiv:0709.0191 [hep-ph].
- [14] R. D. Ball et al. [ The NNPDF Collaboration], arXiv:1303.1189 [hep-ph].
- [15] A. D. Martin, R. G. Roberts, W. J. Stirling and R. S. Thorne, Eur. Phys. J. C 35 (2004) 325 [hep-ph/0308087].